Enabling Social Navigation on the Web
∗Athanasios Papagelis
University of Patras
Greece
[email protected]
Manos Papagelis
University of Toronto
Canada
[email protected]
Christos Zaroliagis
CTI & University of Patras
Greece
[email protected]
Abstract
For a place that gathers millions of people the Web seems pretty lonely at times. This is mainly due to the current pre-dominant browsing scenario; that of an individual partici-pating in an autonomous surfing session. We believe that people should be seen as an integral part of the brows-ing and searchbrows-ing activity towards a concept known as so-cial navigation. In this work, we extend the typical web browser’s functionality so as to raise awareness of other people having similar web surfing goals at the current mo-ment. We further present features and algorithms that facili-tate online communication and collaboration towards com-mon searching targets. The utility of our system is estab-lished by experimental studies. The extensions we present can be easily adopted in a typical web browser.
1
Introduction
It is estimated that the size of the WWW in June 2008 was 174 million websites [1]. Over the last couple of years its growth has been largely driven by the increasing number of new forms of media on the web including blogs, social networks, video and photo sites, audio such as podcasts and much more.
The main aggregation point for accessing all these forms of media remains theweb browser. Typically, websites con-tain links to other websites, and thus, web browsers allow a user to easily access information by traversing these links, a process known asbrowsingornavigation.
Browsing may be defined as opportunistic, reactive and unplanned information searching [17]. It is also commonly assumed that the browsing experience over the Internet is typically passive, in a sense that a user’s search objective is not shared by anyone else and people cannot interact with web content, make personal notes, share comments and URLs [4].
∗Supported by the Future and Emerging Technologies Unit of EC (IST
priority – 6th FP), under contract no. FP6-021235-2 (project ARRIVAL).
However, traditionally, information search involves a se-ries of interactions between the searcher and any available information source, including other people. Moreover, re-cent surveys of search strategies among knowledge workers [11] and in education [10] revealed search needs that are not supported by current search interfaces, such as the desire to collaborate.
We build on these observations and focus on enhanc-ing the user browsenhanc-ing experience towards a process known as social navigation[5]. Social navigation describes the process where a number of people that share interests and searching goals decide to coordinate their efforts. As a de-sign approach social navigation tries to raiseawarenessthat social activities should be part of our information process-ing environments. Systems based on social navigation con-cepts typically make people more aware of each other and thus contribute to a more social experience of the informa-tion space. At the same time, awareness of others and their actions make aspacefeel more alive and turn it into some-thing we might perceive asplace[6, 8].
To this end, we introduce a system that aims to enable social navigation on the Web and make the following con-tributions:
• We extend the web browser’s scope by providing means for connecting, communicating and sharing in-formation with other users in a synchronous way. • We present an intuitive user interface that is able to
visualize awareness of others and their actions. • We present algorithms that render the visualization
tool scalable and evaluate the utility of the system by conducting user experimental studies.
In the rest of the paper, we first present an overview of the related work and a description of the system. Then, we formalize the problem of correlating temporal user naviga-tional patterns and provide algorithmic solutions. We con-tinue with an experimental evaluation of the system. Fi-nally, we summarize our contribution.
2
Related Work
Interfaces to databases have traditionally been designed as single-user systems. The existence of other users and their activities have been implicitly assumed to be an at-tribute of the system that should be hidden from end-users [14]. Similar design approach has been adopted for access-ing information on the web.
In recent years the emergence of the field ofcomputer supported cooperative workhas highlighted the importance of collaborative approaches in many diverse activities. In regards of online collaboration, research onannotating on-line documents has emerged. Annotations are usually in the form of comments, notes or search trails attached to any on-line document [9]. Then, onon-line navigation experience can be enhanced by providing to future users annotations from users in the past [18].
More recently, research on social navigationattracts a lot of attention. Social navigation is based on the social navigation theory introduced by Dourish and Chalmers [6]. It works by taking advantage of patterns of agreement and tastes between users [3]. These patterns are often consistent across a time period. The premise is that users who agreed with each other in the past are likely to agree in the fu-ture. Further, research incollaborative searchaims at facil-itating collaboration ofsmall groupson performing search tasks, such as students working together on assignments, friends seeking information about recreational events, cou-ples planning vacations and more [12].
Our work is complementary to work on annotation since we aim to offer real-time annotation and information shar-ing of online content and is mostly related to research in social navigation and collaborative search. It complements work on social navigation in that we aim to enable oppor-tunistic collaboration between people that share temporal patterns of agreement and tastes. It also differs from work on collaborative search in that we aim to enable collabora-tion on performing search tasksat-large, with people not on one’s contact list. Overall, we aim to facilitate collaboration by supporting awareness that more people exist in the same place at the same time and at providing means of real-time opportunistic communication with one another via the web browser.
3
System description
In this section we thoroughly describe our system that aims to enhance the user’s browsing experience. Before elaborating on the actual browser extensions, we present a motivating example of the required functionality.
Motivating Example: Consider a searcher that tries to find a good diet book. A common searching scenario consists of
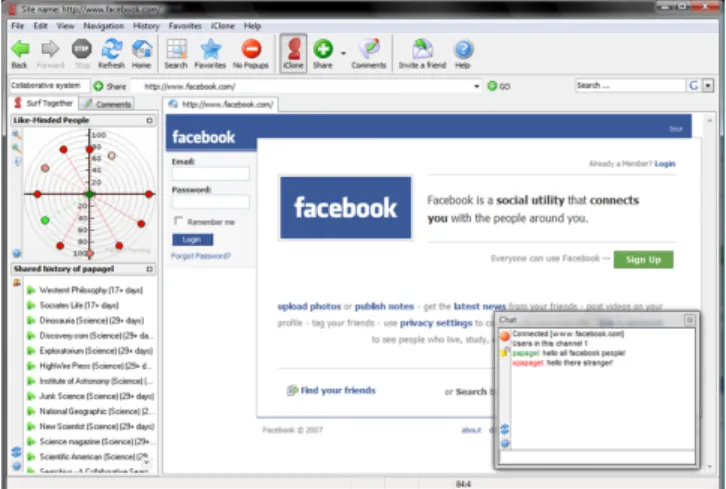
Figure 1. The web browser application. On the left, thesemantic neighborhood radar(top) and theshared his-tory list(down) of a user are presented. On the right, the
website-based chat is presented that enables communica-tion between users that co-exist in a website. On the top of the browser thecollaborative annotation toolis presented that allows annotations to be assigned to shared websites (button “Share” near the address bar).
submitting free text queries in a search engine (e.g., “diet book”, “diet book reviews”) and visiting a few of the re-turned results. These results lead to other, potentially use-ful, websites that the searcher may decide to visit. These sites can lead to other sites and so on. The sequence of the recently visited websites can be used to represent a tempo-ral user profile. This profile can then be compared to the temporal profiles of other currently online users to detect the most similar ones. Our system should identify these people, present them to the searcher in a comprehensive way and provide ways to communicate with them. As the searcher’s interests shift through time people that appear in the interface shade away producing an up-to-date set of rel-evant users. In fact, each user’s set of relrel-evant users is dy-namic and gets constantly updated due to its own and other user’s browsing activity.
3.1
Browser Extensions
Our system is implemented as a stand-alone web browser application. More specifically, it consists of a number of tools, tightly integrated with a typical browser to extend its functionality. During the navigation process, informa-tion is collected and communicated to the main web server. Therefore, our system resembles the client-server architec-ture model, where many clients (web browsers) connect to a main server. Figure 1 presents a typical screenshot of this application from the end-user’s point of view. In the re-maining of the section we describe these extensions.
(a) (b) (c) (d)
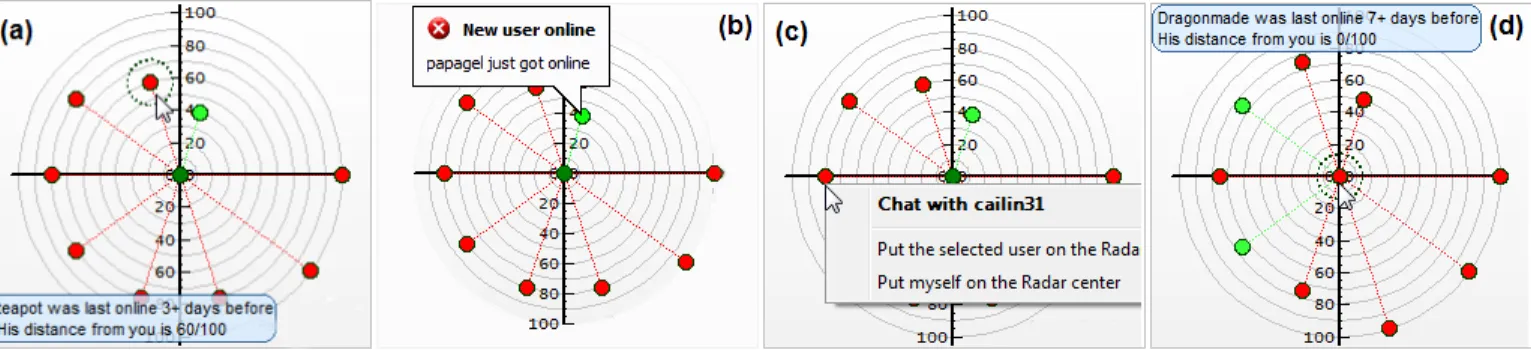
Figure 2.(a) The active user appears at the center of the radar. The distance of the dot at the center of the radar to any other dot represents the proximity of the users represented by these dots. The color of a dot represents the status of the associated user. By moving the mouse pointer over the radar we can discover more information for each user. (b) Activity indicators inform a user about the recent activities of other people in the neighborhood. (c) By right-clicking on a person, options to invite him to a private chat or to put him at the center of the radar are provided. (d) Choosing another person at the center of the radar reveals the users in his neighborhood.
3.1.1 The Semantic Neighborhood Radar
Visualizing a concept is often challenging since one needs to balance between informative, comprehensive and compu-tationally feasible interfaces. We choose to represent the in-formation of recently relevant users using a radar metaphor. A radar in the real world, that operates on an objectx(the reflector), scans a wide area, measures the distance of other objects toxand presents these objects along with their dis-tances fromxon a display.
In our case, objects are users and distance is a metric of user to user proximity. This visualization enables users to instantly conceive the details of our conceptual model. It also has the nice property of displaying a lot of information in a restricted area.
The radar represents people as dots. The active user, for which the radar is defined, appears at the center of the radar, while the people most relevant to the active user are plotted on the radar in distances from the center that respect the computed proximity of each user to the active user (see Fig-ure 2(a)). Conceptually, this represents asemantic neigh-borhoodaround the active user, with the captured semantic being the correlation of recent user navigational patterns.
Note, however, that when we are placing dots (users) on the radar we do not ask to respect all pair-wise similari-ties of all users. That case usually appears in the litera-ture as theordination problem, where we need to represent
n-dimensional data by a small number of salient dimen-sions and thus be able to display multivariate data on the two-dimensional surface. The main tool for the ordination problem is the family of thedimensionality reduction tech-niques, including eigenvalue decomposition, multidimen-sional scaling, latent semantic analysis and more. Despite the wide adoption of these techniques in various problem areas, they suffer from limitations that render them
inad-equate in our case; they cannot be applied on a dynamic environment where the 2D layout needs to be regularly up-dated.
The radar metaphor evokes the proximity functionality we discussed, but also adds new features such as:
• Representing the Time-axis on the Radar: An es-sential aspect when representing users on the radar is to clearly indicate whether they are (recently) active or inactive. Active users are represented as green dots, while inactive users are represented as red dots. Fur-thermore, we would like to represent how recently a specific user has been relevant to the active user. To represent this information for each dot we use a spec-trum of its color (either green or red) that spans from dark to light, with darker meaning more recently. The active user is therefore always represented as a dark green dot at the center of the radar (see Figure 2(a)). • Action indicators: In addition to who is relevant and
to what degree, we would like to also make available information of what people in our neighborhood are doing. To this end, we design action indicators that track the activity of people in the neighborhood and communicate the actions to the user (e.g., who got on-line, etc.). Action indicators are visualized in the form of a balloon assigned to a specific user. By this way, despite the stateless environment on which browsers operate, we are able to track the state of the radar in-formation (see Figure 2(b)).
• Private Chat: One of the direct communication fea-tures that are provided by the system is the private chat. A user is able to start a private chat conversation (af-ter invitation) with any of the users presented in the semantic neighborhood radar. (see Figure 2(c)).
• Exploration of other Neighborhoods: Another fea-ture of the radar is that it provides the possibility to set another user at its center. By this way, one can explore the neighborhood (the relevant users) of another user. By traversing from a neighborhood to another, one can discover and communicate with more people (see Fig-ure 2(c) and FigFig-ure 2(d)).
3.1.2 Website-based Chat
The website-based chat allows people that coexist in a web-site, during their navigation, to directly communicate with each other. Navigating a website automatically makes you a part of that website’s virtual public chat room. There-fore communication between all users in a specific website is enabled (see Figure 1). Note, that our system enables the concurrent communication of users at any website and is not the same with the Web applications that allow to a website owner to directly communicate with its visitors. In-terestingly, the website-based chat forms the foundation for transforming aspacetoplace[8].
3.1.3 Sharing Information Spaces
Pointing out interesting information in a collaborative sys-tem is essential. Beyond (private or public) chatting, our system further supports exchange of information in the form of a shared history feature. During navigation, a user may share websites (along with tags) with the people that ap-pear in his radar. A user receiving suggestions for websites would need to click on a user’s dot at the radar to indicate his intention to see this list (see Figure 1).
3.1.4 Collaborative Annotation System
Our system provides the functionality to annotate a website with a set of keywords. By this way, a set of keywords is assigned to each website coming from different users at different times and therefore define a collaborative website annotation system (see Figure 1). These keywords can then form the basis for a number of applications.
4
Algorithms
With millions of users accessing billions of webpages everyday one would consider a visit of a useruto a web-sitewat time tto be the primitive action that takes place in the overall web browsing activity. From a user’su per-spective the chronologically ordered sequence of visits to a number of webpages defines a web history logHu. Our system functions as the aggregation point of these individ-ual history logs by defining a unified web history logH. In its most simple form,H consists of a chronologically or-dered sequence of visit records of the form (u,w,t).
Such click-through information presents a challenging opportunity for analysis and mining with the goal of per-sonalization and has been extensively used in research [15, 2, 16]. However, most existing approaches use the click-through data to devise similarity measures with lit-tle consideration of thetemporal factor. At the same time, these data are often dynamic and contain richtemporal in-formation[19]. In this section we present atime-dependent similarity model that exploits the temporal characteristics of historical click-through data. The intuition is that since the information needs of users change through time, user pro-filing algorithms should take into account the timestamps of the historical click-through data in order to identify re-gions of significant similarity that may be a consequence of functional relationship.
Formally, given the unified web history logHof all users and with respect to a temporal factorT, we would like to find a set of users that have similar web history in the time period bounded by T. In other words, we would like to identify users that recently navigated same websites. To ex-press the temporal factor we use as a surrogate for time the number of the lastTrecords in the unified logHand oper-ate on the subsetHT ⊆ H of the lastT visits. In similar manner if we would like to constrain a specific user’su his-tory log to its lastSvisits we writeHuS ⊆Hu.
Note that in order a web browser client to show the radar to a useru, it needs to communicate with the main server and retrieve the required information. This information con-sists of the set of users relevant toualong with their asso-ciated similarity values. Instead of computing this informa-tion whenever a client sends a request asking for the infor-mation to show on the radar, we perform all computations in a preprocessing phase that takes place in specific time intervals and cache the results. The premise of the prepro-cessing is that whenever a client requests information, this would be promptly available. Therefore we require that the client-server communication takes place in periodic time in-tervals that allow for the pre-computation phase to finish. Algorithm 1 describes the steps of the preprocessing phase. Algorithm 1 takes as parameters the unified history log
H, the temporal factor T, the temporal factor S and the maximum number of relevant users to be retrieved for each userk. First, it forms the setHT of the lastT records of the unified logH. Then, it identifies the set of unique users
U in the setHT and for each useru∈ U retrieves the set of its temporal history logHuS that corresponds to its last |S|log records fromH. For each pair of usersui,uj inU it computes their affinity by computing the overlap of their temporal history setsHS
ui andH
S
uj and saves the score to
arrayA. For each useru∈U it computes the top-kusers according to the scores inAand saves them inL. Finally,
Lis returned that keeps information about the most relevant users of each user along with their scores.
Algorithm 1Finds Relevant Users
1: procedureCOMPUTERELEVANTUSERS(H,T,S,k) 2: Lis a HashTable of the formL < u, < Set >>
3: Ais a HashTable of the formA << i, j >, Ai,j >
4: HSis a HashTable of the formHS < u, HS u >
5: HT =getLastRecords(H, T)
6: U =getU niqueU sers(HT)
7: for allu∈Udo 8: HuS=getLastRecords(Hu, S) 9: end for 10: for allui∈Udo 11: for alluj∈U do 12: ifui 6= uj&&i < jthen 13: Ai,j =Af f inity(HuSi, H S uj) =s(i, j) 14: end if 15: end for 16: end for 17: for allu∈Udo 18: Lu=getT opK(A, k, u) 19: end for 20: returnL 21: end procedure
For computing the affinity between usersi,jwe employ a simple realization of the set-similarity algorithm. Given two setsHS
ui,H
S
uj, withi6=j, we can quantify the affinity
of the sets by functions measuring their overlap, such as theintersection(I) or thejaccard similarity coefficient(J). For example, the similaritysbetweeniandj, based on the intersection measure, is defined as:
s(i, j) = I(H S ui, H S uj) max(|HS ui|,|H S uj|) = |H S ui∩H S uj| max(|HS ui|,|H S uj|) (1) Other choices for quantifying user affinity are also pos-sible. Our framework can easily incorporate any of these choices. Then, the distancedbetweeniandjis defined as:
d(i, j) = 1−s(i, j) (2)
Note that this method does not take into account the pop-ularity of the websites that participate in the similarity com-putation. However, it is reasonable to assume, that some websites are more important than others for defining simi-larity in our context. Indeed, we would like to weight web-sites in such a way that less popular webweb-sites are more sig-nificant than popular ones when determining similarities.
A way to naturally capture this property is to weight websites according to their inverted frequency in the uni-fied history logHT. More specifically, the frequency of a websitewinHT is given by:
fw=
nw
P
i∈HT ni
wherenw is the number of timeswappears in HT. This count is normalized to prevent a bias towards longer logs and to give a measure of the importance of the website w
within the particular logHT. Then, a weightz
wof an ele-ment in the set is defined as follows:
zw=
1
fw
We may now consider a weighted version of our set simi-larity algorithms, where there is a weightzeassociated with each set elemente(i.e., with each website). Our approach is to convert aweighted setinto anunweighted bagby mak-ingzecopies of each elemente. We use standard rounding techniques if weightszeare non-integral. In that case, the similaritysbetweeniandjis defined as:
s(i, j) = P w∈|HS ui∩HujS |zw max(P w∈|HS ui|zw, P w∈|HS ui|zw) (3)
We restrain our algorithmic description to the simplified assumption that the sets of users recent history logs fit in memory and that computation of set similarities between time intervals is feasible. Actually, we can enforce that condition by dynamically tuning the temporal-constraint ac-cording to system overload and available processing power.
5
Evaluation
Evaluating the utility of the proposed system is chal-lenging on its own. Properties of the the social navigation paradigm differ substantially from ones in traditional sys-tems, rendering many evaluation techniques obsolete. In our context, we are interested to evaluate the utility of the system in terms ofcollaboration effectiveness andoverall user satisfaction. Consequently, we have to resort to user studies to address the evaluation issue. Given these consid-erations, we evaluate our system under two hypotheses:
• Hypothesis 1: Our system is able to raise awareness that other people have similar information needs at the current moment and to further identify and present these users in an informative way.
• Hypothesis 2: Our system serves as an online collab-oration tool that helps people fulfill collaborative tasks more efficiently.
5.1
Data Sets
Information seeking on the web typically involves sub-mitting queries to search engines supplemented by manual navigation [13]. Queries are usually classified according to
their intent into three classes: navigational, informational and transactional. For the needs of our experimental evalu-ation we focus on informevalu-ational queries (IQ), for which an-swers are assumed to be present on many web pages. These queries are the most likely to be benefited by social navi-gation tools, since the information seeking task requires to constructively select information from several sources. We further distinguish the informational queries into two cate-gories; ambiguous (AIQ) and unambiguous (UIQ). AIQs do not require that a specific answer is sought, while UIQs usu-ally look for a specific answer. For the various experimental scenarios we consider the queries of Table 1.
Table 1. Queries Data Set
Type Query
AIQ1 Find information and reviews about iPhone
AIQ2 Find information about Ancient Rome
AIQ3 Find reviews about Xbox
AIQ4 Find information about Egyptian pyramids
AIQ5 Collect information about USA presidents
AIQ6 Collect information about space exploration
U IQ1 Find the list of the current prime ministers
of the world that are lawyers
U IQ2 Find the list of paintings that have been sold
for more than 1 million dollars
5.2
Experimental Studies
First Study: To test the first hypothesis we asked from 24 students (subjects), to participate in a study. The subjects were familiar with the Web searching task but not aware of our browser extensions.
First, subjects were asked to surf the web using our ap-plication without a specific objective for a time interval (phase-1). Then, each subject was assigned a search task from the set of the ambiguous informational queries of Ta-ble 1 (AIQ1...AIQ6). Each query was assigned to
ex-actly four participants. Participants were not aware of each other’s assigned search tasks. Subjects were asked to fulfill their assigned task for a predefined time period (phase-2). After this period has elapsed subjects were asked to surf the web without a specific objective for another time interval (phase-3).
The objective of this experiment is to evaluate how well the radar groups together subjects that have been assigned the same searching scenario. The intuition behind this ex-periment is that although subjects are free to perform the given searching task following their judgement, there is a high probability that some intersection between the subjects that have been assigned the same task will occur.
Second Study: To test the second hypothesis we asked from 16 students (subjects) to participate in a study. We separated
the subjects into four groups of four subjects each. The first two groups (group1, group2) were assigned the query
U IQ1and the other two groups (group3, group4) were
as-signed the queryU IQ2from Table 1.
Then, subjects were asked to fulfill their assigned task for a predefined time period. The subjects of group1 and group3 were allowed to use the browser extensions provided by our application to communicate their findings, while the subjects of group2 and group4 were asked to use a typical web browser.
The objective of this experiment is to evaluate whether and to what degree direct collaboration, that is inherent to systems like ours, could improve the performance of an informational task. The intuition behind this experiment is that as people in group1 (group3) collaborate towards a common goal they will outperform group2 (group4) and will produce better results (either more or the same amount but in less time).
5.3
Results
First Study: A simple radar observation revealed the fol-lowing: At the end of phase-1 subjects were far away from each other which indicates that they did not share the same interests. Then, at the end of phase-2, subjects that had the same search task approached each other. Finally, in phase 3, subjects drew away from each other.
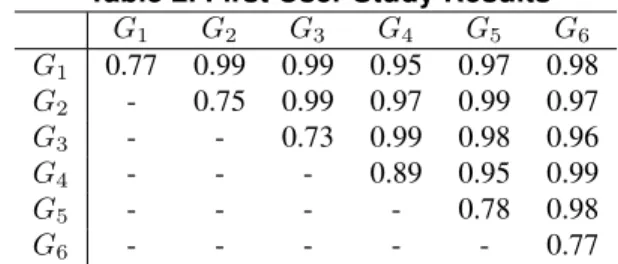
For this experiment we used as evaluation metric the av-erage distance avgd between the set of users defined by each query. Formally, let the set of subjects that have been assigned the queryAIQxbeGx. Then the average distance between subjects ofGxandGyis defined as:
avgd(Gx, Gy) =
P
i∈Gx,j∈Gy(d(i, j))
n ,∀i < j (4)
wherenis the number of distinct pairs of subjects between
GxandGyandd(i, j)is the distance of subjectsiandjas defined in Equation 2. Table 2 shows the results for phase-2.
Table 2. First User Study Results
G1 G2 G3 G4 G5 G6 G1 0.77 0.99 0.99 0.95 0.97 0.98 G2 - 0.75 0.99 0.97 0.99 0.97 G3 - - 0.73 0.99 0.98 0.96 G4 - - - 0.89 0.95 0.99 G5 - - - - 0.78 0.98 G6 - - - 0.77
The results indicate that our algorithm was able to cap-ture the fact that some users had similar search interest. Note the diagonal of the Table 2, where it is clear that sub-jects that have been assigned the same search task came closer at the end of phase-2.
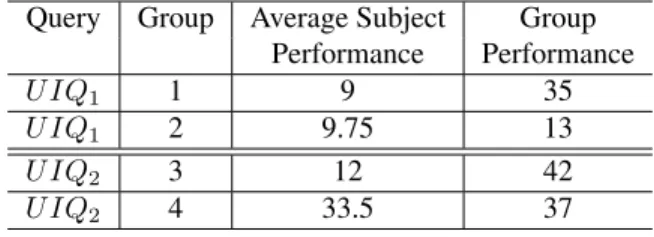
Second Study: For this experiment we need metrics to eval-uate the performance of individuals and of groups. For the former, we define themean subject performanceto be the average number of distinct results found by the subjects of a group. For the latter, we define theperformance of a group to be the number of distinct results found by all subjects in a group. Table 3 presents the results of this experiment.
Table 3. Second User Study Results
Query Group Average Subject Group Performance Performance
U IQ1 1 9 35
U IQ1 2 9.75 13
U IQ2 3 12 42
U IQ2 4 33.5 37
Regarding U IQ1, subjects in group1 and group2 had
similar individual performance. However, group1 outper-formed group2. Users of group1 coordinated their effort by communicating a simple strategy. They separated the work-load (e.g., by continent) to four equal parts and assigned each part to a subject. On the other hand, all subjects in group2, which where not collaborating, followed a natural strategy of looking for prime ministers of popular countries causing their results to have a large overlap. Eventually, the results of the one were subsumed by the results of the other. RegardingU IQ2, subjects of group3 coordinated their
effort by assigning only one member to the straightforward task of collecting the top paintings from available listings (e.g., Wikipedia). The rest of the subjects continued search-ing for expensive paintsearch-ings by either submittsearch-ing more so-phisticated queries in search engines or by visiting the web-sites of known galleries and auction houses. On the other hand, subjects of group4 spent most of their time collecting the same paintings from listings of the top paintings.
6
Concluding Remarks
To enable social navigation on the web, we had to design a system that makes use of web history logs to encourage communication and collaboration among large groups of people. To support these features some personal informa-tion and a certain, limited amount of visibility of users’ ac-tions is required, which eventually infringes on user privacy. Privacy concerns could therefore serve as a major stumbling block towards acceptance of our system.
Erickson and Kellogg [7] introduced the concept of so-cial translucenceas an approach to designing systems that support social processes. According to this concept it is not only necessary to see other users, but to clearly communi-cate what information is disclosed and how it is used. We followed the same approach when designing our system and
made sure that it entails a balance of visibility, awareness of others, and accountability.
The main idea of our system is to utilize temporal cor-relations between users’ web history logs. Though intu-itive the realization of such a system is not trivial since it poses a number of challenges spanning from technical to social aspects. Overall, the proposed application operates as a system for storing meta-data of web browsing activity, chat conversations and URL suggestions. By seamlessly merging the available collaboration data our system forms the foundation for a practical social navigation system.
References
[1] Web server survey (by www.netcraft.com), January 2008. [2] E. Agichtein, E. Brill, S. T. Dumais, and R. Ragno.
Learn-ing user interaction models for predictLearn-ing web search result preferences. InSIGIR, pages 3–10, 2006.
[3] J. Budzik, S. Bradshaw, X. Fu, and K. J. Hammond. Clus-tering for opportunistic communication. InWWW, 2002. [4] S.-J. Chang and R. E. Rice. Browsing: A
multidimen-sional framework. Annual Review of Information Science and Technology, 28, 1993.
[5] A. Dieberger. Supporting social navigation on the world-wide web.Int. J. of Human-Computer Studies, 46, 1997. [6] P. Dourish and M. Chalmers. Running out of space: Models
of information navigation.Proceed. of HCI’94.
[7] T. Erickson and W. A. Kellogg. Social translucence: an ap-proach to designing systems that support social processes.
ACM Trans. CHI, 7(1), 2000.
[8] S. Harrison and P. Dourish. Re-place-ing space: the roles of place and space in collaborative systems. InCSCW, 1996. [9] J. Kahan and M.-R. Koivunen. Annotea: an open rdf
infras-tructure for shared web annotations. InWWW, 2001. [10] A. Large, J. Beheshti, and T. Rahman. Gender differences in
collaborative web searching behavior: An elementary school study.Inf. Process. Manage., 38, 2002.
[11] M. R. Morris. A survey of collaborative web search prac-tices. InCHI, 2008.
[12] M. R. Morris and E. Horvitz. Searchtogether: an interface for collaborative web search. InUIST, 2007.
[13] S. Pandit and C. Olston. Navigation-aided retrieval. In
WWW, 2007.
[14] T. Rodden, J. Mariani, and G. Blair. Supporting cooperative applications. InCSCW, 1992.
[15] J.-T. Sun, H.-J. Zeng, H. Liu, Y. Lu, and Z. Chen. Cubesvd: a novel approach to personalized web search. In WWW, 2005.
[16] J. Teevan, S. T. Dumais, and E. Horvitz. Personalizing search via automated analysis of interests and activities. In
SIGIR, 2005.
[17] M. B. Twidale, D. M. Nichols, and C. D. Paice. Browsing is a collaborative process.Inf. Process. Manage., 33(6), 1997. [18] A. Wexelblat and P. Maes. Footprints: history-rich tools for
information foraging. InCHI, 1999.
[19] Q. Zhao and S. C. H. H. et al. Time-dependent semantic similarity measure of queries using historical click-through data. InWWW ’06, pages 543–552.