Softwarization of SCADA: Lightweight Statistical
SDN-Agents for Anomaly Detection
Giulia Rinaldi
∗, Florian Adamsky
†, Ridha Soua
‡, Andrea Baiocchi
∗, and Thomas Engel
‡,
∗ [email protected],[email protected], University of Rome Sapienza, Italy
† [email protected], Hof University, University of Applied Sciences, Germany
‡ {name.surname}@uni.lu, SnT, University of Luxembourg, Luxembourg
Abstract—The increasing connectivity of restricted areas such as Critical Infrastructures (CIs) raises major security concerns for Supervisory Control And Data Acquisition (SCADA) systems, which are deployed to monitor their operation. Given the impor-tance of an early anomaly detection, Intrusion Detection Systems (IDSs) are introduced in SCADA systems to detect malicious ac-tivities as early as possible. Agents or probes form the cornerstone of any IDS by capturing network packets and extracting relevant information. However, IDSs are facing unprecedented challenges due to the escalation in the number, scale and diversity of attacks. Software-Defined Network (SDN) then comes into play and can provide the required flexibility and scalability. Building on that, we introduce Traffic Agent Controllers (TACs) that monitor SDN-enabled switches via OpenFlow. By using lightweight statistical metrics such as Kullback-Leibler Divergence (KLD), we are able to detect the slightest anomalies, such as stealth port scans, even in the presence of background traffic. The obtained metrics can also be used to locate the anomalies with precision over 90% inside a hierarchical network topology.
I. INTRODUCTION ANDPROBLEMSTATEMENT
Critical Infrastructures (CIs) are cyber-physical system and assets that are vital to citizens’ daily lives and national economies. Consequently, their destruction or impairment would damage public health or safety, energy supplies, trans-portation, telecommunications, etc. Since these CIs use sys-tems and equipment that are separated by great distances (as much as thousands of kilometres), Supervisory Control And Data Acquisition (SCADA) systems are used to monitor their operation and to send commands and programs remotely. In the past, there has been little worldwide awareness of the importance of securing SCADA systems; authorities used “security by obscurity”, together with air-gapped isolation. The former uses proprietary software, hardware, and commu-nication protocols. However, the limitation of this approach was demonstrated by the devastating effect of the Stuxnet worm [1], considered the first publicly-known malware used to target a CI. Network attacks can hamper the correct operating modes of SCADA devices such as Remote Terminal Units (RTUs), or Programmable Logic Controllers (PLCs).
In addition, with the rapid development in industry and hence the need for ever-increasing connectivity to reach remote sites, SCADA systems started to use standardized communications protocols in order to have access to Internet and corporate networks and to ensure remote control. Today, Modicom Communication Bus (Modbus) TCP [2], Distributed Network Protocol (DNP3) [3], and IEC 60870-5-104 [4] are typically
used in modern SCADA systems. This situation gives rise to new security concerns for SCADA operators, since these protocols were designed with a strong focus on reliability rather than security.
Intrusion Detection Systems (IDSs) were introduced to detect malicious activities as early as possible. Detecting known and unknown attacks at an early stage is fundamental to preventing further damage. An IDS can collect valuable information about an attack to prevent it in the future. Agents or probes are the main components of an IDS. They capture network packets and extract relevant information from them. The role of an agent can involve more sophisticated manage-ment functions such as the processing of collected data. The data gathered by agents is sent to the IDS for further investi-gation. However, since SCADA systems are large-scale, these solutions introduce additional delay to the anomaly detection latency. In addition, anomaly detection today is implemented using agents that are rigid in terms of placement and function-ality with respect to the to the type of anomaly metric they can handle. This leaves SCADA operators in an unpleasant situation given the complexity of SCADA systems and the diversity of attacks. Thus, it is challenging to design adequate agents or probes that can be sufficiently flexible and efficient. Recently, Software-Defined Network (SDN) methodology has been proposed as a solution to address these challenges by splitting the data flow operations from network control. In the same vein, we propose an SDN-enabled SCADA architecture enriched with lightweight statistical and programmable agents to ensure timely anomaly detection. The key advantage of our solution is the flexibility in the definition of the statistical agents and their placement. In addition, being in vicinity of the SDN-enabled switches, the proposed agents ensure timely anomaly detection. The contributions and the structure of this paper are as follows:
• We detail our proposed SDN-based architecture and lightweight statistical SDN agents in Section III. • We evaluate our lightweight SDN agents in a virtual
SCADA running Modbus, DNP3, and IEC 60870-5-104 and under several attacks (SYN flooding attack, TCP and UDP port scan, etc.) in Section IV.
• In Section IV-C we demonstrate the ability of our ap-proach to locate anomalies in the SDN-enabled SCADA network.
II. TECHNICALBACKGROUND A. SCADA Systems
1) Architecture: The SCADA architecture is built in form of a hierarchical tree structure. At the root node is the Human Machine Interface (HMI), where all information is consoli-dated and displayed on screens. This is also the place where employees monitor and control the whole infrastructure. The HMI is connected to RTUs/PLCs. These are microprocessor-controlled devices which provide an interface to multiple sensors and actuators. The RTUs/PLCs, sensors, and actuators together build a substation, which can be geographically distant, depending on the size of the SCADA network.
2) Network Protocols and Traffic Patterns: The main com-munication protocols for SCADA networks are Modbus TCP, DNP3, and IEC 60870-5-104. These protocols were designed over twenty years ago and are known to be highly vulnerable to simple network attacks [5], [6]. Detection of attacks and anomalies in SCADA networks exploits the fact that traffic flows exhibit predictable patterns and have the following characteristics:
• Deterministic: the operation of a device should be pre-dictable, given that critical processes depend on it. • Hierarchical: Devices communicate in a one-to-many
fashion (one master device and several slaves), using a polling communication style.
• Consistent: SCADA master devices poll field devices at set time intervals, thus giving rise to periodic traffic patterns. In [7], it was found that typical SCADA traffic consists of a regular exchange of packets inside long-lived (about one hour) TCP connections. This is different from the traffic patterns of traditional Information and Communication Technology (ICT) devices, where human activity affects packet timing. Moreover, the network topology in SCADA system tends to remain unaltered over time, given that nodes are added or removed rarely.
B. Software-Defined Network (SDN)
In a scenario where the communication between the In-dustrial Automation and Control Systems (IACS) components uses SDN, the SCADA system could host an IDS application. The control layer of a SDN architecture communicates with the infrastructure via a specific protocol called OpenFlow. This protocol allows the SDN control software to modify the packet forwarding table from layer 3 switches or routers dynamically. On top of the control layer is the application layer, which uses an API to communicate with the control layer. It is possible to run applications which extend the functionality of an SDN-based network, e.g., load balancer, IDS, or a network monitor. OpenFlow is the de-facto standard communications inter-face defined between the control and data planes of an SDN architecture. Data plane are OpenFlow-enabled devices and can be monitored and configured by SDN controllers through a secure channel. An OpenFlow Switch consists of: a) one or more flow tables; b) a group table whose role is to carry out packet look-ups and forwarding; c) an OpenFlow channel
that connects the switch to the controller. The SDN controller can add, update, and delete flow entries of the switch flow tables via OpenFlow. This can be done in a reactive way (in response to a specific request) or proactively. Each flow table in an OpenFlow-enabled switch contains a set of flow entries. A flow entry comprises match fields, counters, and a set of instructions to apply to matching packets. The lifetime of a flow entry is controlled by a timer; the associated timeout can be either idle or hard. If an idle timeout is set, a flow entry expires if no packet has matched that entry for the given number of seconds. With a hard timeout, the flow entry is deleted after a given number of seconds irrespective of the packets matching that entry.
III. LIGHTWEIGHTSDN-BASEDAGENTS FORINTRUSION
DETECTION
A. Attacker Model
We consider two types of attacker: a lazy one, who aims to create damage by flooding the network; and a smart one, who needs to investigate the network before moving on to more sophisticated attacks. We consider the following attacks:
1) SYN Flooding Attack: is a memory-exhaustion attack in which an attacker exploits the fact that a receiver must allocate memory for the half-open TCP connection until a timeout occurs. If an attacker sends enough packets in a short time frame, the receiver runs out of memory and cannot accept TCP connections from legitimate users. This is a classic network attack that results in a denial-of-service (DoS). SCADA devices are still vulnerable to this kind of attacks (e.g. CVE-2017-14028 [8], CVE-2018-10632 [9]).
2) Port Scan: checks which TCP/UDP ports are open on a specific target. The resulting information is useful in conducting reconnaissance and preparing more sophisticated attacks. The de facto standard application for port scanning is nmap. In our experiments, we considernmapusing the half-open or stealth scanning technique, which sends SYN packets to the port and waits for the response. If the response is a SYN/ACK packet, the port is open. If the response is a RST packet, the port is closed. In addition, we use the option-sV, which probes the open port to get more service information.
B. Distributed Statistical SDN-Agents for Attack Detection
Our approach exploits the inherent centralized intelligence of an SDN architecture. We define a new logical element, the Traffic Agent Controller (TAC), which is responsible for collecting statistical data concerning the traffic flows, pre-processing them, and populating a centralized database to be used by the IDS processes. The TAC is seen by the switches as another local controller, additional to the central one, which can be supported by the OpenFlow protocol. TACs are specialized controllers, since they are targeted specifically to enable the traffic-monitoring and attack-detection functions. A TAC is implemented as a software running on a virtual machine or on a set of devices that can be introduced to the local SCADA sub-network where the switches to monitor
are located. Decoupling the TAC function from the monitored switch has a number of advantages:
• Flexibility in the design of the monitoring platform, e.g., deploying one TAC for each switch allows a trade-off to be made between the amount of control traffic load due to the collection of measurements and the number of TAC devices to be introduced into the SCADA network. • No impact on existing switches, which do not need to be
patched or replaced. The only assumed supported func-tionality of the switches is running OpenFlow protcol. • Flexibility in the deployment of the traffic monitoring and
attack detection functions in an existing SCADA network, with minimal impact on the network, which is a major requirement for this specific environment.
• The TAC software can be easily developed starting from an implementation of the central SDN controller and removing all those functions that are not needed for the specific purpose of the TAC.
To deploy the TACs, we proceed as follows: The central SDN controller is initially configured with information on location and addresses of the TAC devices introduced to the network. It is up to the central controller to assign switches to their respective TACs. Then, the central SDN controller tells to each switch the TAC it must register to. The switch opens an OpenFlow link with its associated TAC, which acts as a passive server in this phase. The TAC asks the SDN controller for the list of connected hosts and any other relevant topological information. This is more efficient than discovering the information on its own by means of discovery messages, as this discovery can more easily be done by the SDN controller. Once this first phase is completed, each TAC has registered the switch it is in charge of, knows which hosts are connected to its associated switch, and has established OpenFlow links with the associated switch. We start then the collection of data traffic. Let TACS denote the TAC controlling the switch S.
Data collected by TACS comprises two kinds of information:
1) Periodic reports of switch counters, triggered by explicit requests sent by T ACS to the switchS
2) Specific packets belonging to each new flow passing through the switch S (e.g., TCP SYN packets). To collect the second type of information, we exploit the intrinsic behavior of an SDN-enabled switch: the first packet of each new flow is sent to the SDN controller, so that it can determine the appropriate flow entry in the flow table. Since the TAC is seen by the switch as just another SDN controller, the switch automatically sends the first packet of each new flow to both the central SDN controller and to the TAC it is registered with. Consequently, our proposed approach ensures that the traffic-monitoring function carried out by TACs integrates smoothly with the classic SDN-based SCADA network. The only major change perceived by a switch is that it now has two controllers to talk to via OpenFlow channels. No specific upgrade or modification is required to the switches, provided they support OpenFlow and they have the internal counters needed by the traffic monitoring process.
In the following, we detail the TAC operating mode.
Traffic Agent Controller (TAC)
Central SDN Controller
Main Thread
Periodic Thread
Statistical Thread Ports Hosts Connections
Feature Set
SDN-enabled Switch
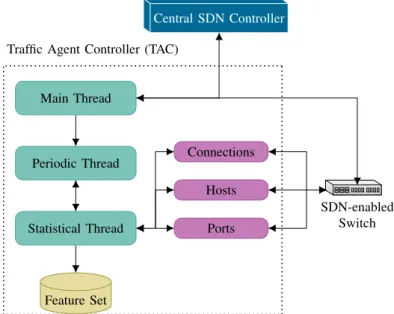
Fig. 1: Architecture of the TAC with its different threads. Green boxes are threads and purple boxes are collectors.
1) TAC operating mode: The logic structure of the TAC is described in Figure 1. The TAC is composed of three threads: Main, Periodic and Statistical.
The Main Thread is the starting point and handles all OpenFlow messages. It also starts the Periodic Thread. This thread has the role of triggering the Statistical thread every time interval ∆. The periodic collection depends on the fact that the TAC runs lightweight code and the latency of TAC-to-switch message exchange is negligible. In more depth, the nominal collection times are tk = t0+k∆, k ≥ 0. Let
δk denote the delay due to: (i) OpenFlow message exchange
between the TAC and the monitored switch; (ii) internal processing at the switch and the TAC. Switch counters should be sampled at times tk. The actual times when counters are
sampled are ˆtk = t0+k∆ +δk. The sampling interval is
ˆ
tk−ˆtk−1= ∆+δk−δk−1= ∆+k, wherekis the delay jitter.
The jitter has a negligible effect provided that k ∆, ∀k.
In our experiments we pushed the periodic collection up to a frequency of one measurement per second (∆≥1s). If a 1% jitter is tolerable, the periodicity of the collection is sufficiently accurate as long as the delay jitterk is within10ms. This is
certainly compatible with OpenFlow message exchange times between the TAC and the associated switch, provided that the TAC is deployed in same local network.
TheStatistical Threadis responsible for collecting the host, port and connection statistics that will populate the central database used by the IDS. The features can be obtained from three types of request:
Host Statistics are collected only if the switch is a leaf1.
We create the AGGREGATE_STATISTICS_REQUEST
for each host connected to the switch. TAC re-quires the statistics for each linked device as source and as destination. This request is inserted in
a OPENFLOW_MULTIPART_MESSAGE. Features
col-lected are the number of packets, number of bytes, and number of flow entries in which each host is involved.
Port Statistics are related to the physical port of the switch. We implement an
OPENFLOW_MULTIPART_-MESSAGE, but the sub-message is a
PORT_STATISTICS_REQUEST. The TAC obtains
counts of received bytes, received packets, dropped packets, received frame alignment errors, received packet overrun errors, received Cyclic Redundancy Check (CRC) errors, transmitted bytes, dropped packets at the transmitter side, and overall collisions.
Connection Statistics collects the statistics from the linked switches. Since the TAC is recognized as an SDN controller, the linked switch will send a
OPENFLOW_PACKET_IN to ask which action to apply,
when it cannot find any flow entry in its flow tables. Hence, the TAC sees the first packet of each flow. We distinguish UDP and TCP flows. If the first packet of the flow is a TCP SYN, we set the flow entry “hard” timer to2 ms. This hard timer, also adopted by [10], ensures that the flow entry gets deleted immediately after having sent the TCP SYN packet. If the three-way handshake of TCP completes successfully, the final ACK, arriving at the same switch, does not find any flow entry and is forwarded to the SDN controller. This allows us to check the outcome of the TCP three-way handshake, which is an important indicator for SYN flooding attacks and port scans. We consider the following connection features: the number of attempted TCP connection setups (SYN messages), the number of successfully set-up TCP connections, of failed TCP connections, of UDP datagrams and of different destination ports related to TCP packets and to UDP packets.
All these statistics are collected every∆seconds. A collec-tion event is referred to as a snapshot. After N collections, we have anobservation. Let ΩX = ΩX(∆, N) be the set of
observation data for the feature X. The observation data go through two steps: approximation and identification.
2) Approximation: is the learning process, in which a new state of the network is saved. In this step, we estimate the probability distribution of the observed features from the ob-servation data. If{x1, . . . , xm}denotes the possible outcomes
of feature X, then P(xi) = Py∈ΩXI(y=xi)/|ΩX|, i = 1, . . . , m, where|W|is the cardinality of the setW andI(E) is the indicator function of eventE.
3) Identification: is the cornerstone of our anomaly detec-tion algorithm. It compares the probabilities of the trained statisticsQ(x)with the observed statisticsP(x)by calculating the Kullback-Leibler Divergence (KLD) [11], given by:
D(P||Q) =KLD(P, Q) =X
x∈X
P(x) log2P(x)
Q(x). (1)
We will refer to the KLD asentropy. The KLD is non-negative, being 0 if and only if P(x) = Q(x), ∀x. It can be shown that P
x∈X|P(x)−Q(x)| ≤
p
2D(P||Q), so that the KLD provides a bound for the “dissimilarity” of the observed (P) and the reference (Q) probability distributions. The reference probability distribution Q(x) is estimated from snapshots in which we are sure that the network is not under attack or undergoing some transient phase.
By using entropy in Equation 1, which measures the amount of disorder in the observed data, and taking into account the peculiarities of traffic pattern in SCADA systems, it is possible to detect even small deviations from the reference state, and to differentiate regular behavior from that when under attack. Furthermore, the particular characteristics of the SCADA-generated traffic, specifically its periodic shape [12], allow us to retain the observation data from one normal day for a long time, without the need for frequent updates and recalculation of the reference probability distributionQ(x).
C. Attack Localization
Determining the attacker’s location is a crucial task for a SCADA network operator, since finding the anomaly location when the attack is on going allows the deployment of appro-priate mitigation techniques. Finding the attack location is also important during the post-attack period, as it may provide a security forensic expert with relevant information regarding the attack propagation. In the following, we describe how we make use of KLD-entropy to pinpoint the attacker’s location. Let us consider a tagged switch s, having n ports, of which m are active ports (m ≤ n), i.e., a device is connected to that port. The switch collects data for several features, making up an overall set of features.
A(s) = {T, U, D1, S1, ..., Dm, Sm}. The first feature set
T contains features for TCP, namely tcp_connections,
tcp_failed, rst_pkt, and tcp_port_counts. The
UDP feature set U contains udp_connections and
udp_port_count. Both feature sets T andU can be
cal-culated for each switch. For each active portj(j= 1, . . . , m) of switch s, the considered features are numbers ofbytes, pkts and flows for: (i) the aggregate input traffic of port
j and the traffic originated by each of the devices connected to switch s, carried by port j (set of features Sj); (ii) the
aggregate output traffic of port j and the traffic destined to each of the devices connected to switch s, carried by port j
(set of featuresDj).
Letadenote a generic feature andKLD(a)the correspond-ing entropy value. We define the anomaly score of the feature setF for switchsas ASF(s)≡Pa∈FKLD(a).
Localization of attacks proceeds in two steps. First, we assign on overallAS(s)to the switch s, defined asAS(s)≡
AST(s)+ASU(s). The obtained anomaly score is compared to
thresholds to determine the alarm level of the switch,AL(s), which can be (l)ow, (m)edium or (h)igh, according to whether
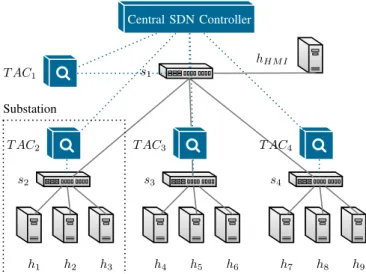
ü ü ü ü Central SDN Controller h1 h2 h3 h4 h5 h6 h7 h8 h9 s1 s2 s3 s4 hHM I T AC1 T AC2 T AC3 T AC4 Substation
Fig. 2: Simplified SCADA architecture, which is the founda-tion of our experimental evaluafounda-tion. Straight lines represent the data plane and dotted lines represent connections in the control plane.
the switch is safe, suspect, or definitely under attack.
AL(s) = h, ifAS(s)≥h exp val
m, ifm exp val≤AS(s)< h exp val l, ifAS(s)< m exp val.
(2)
IfAL(s)is (h)igh or (m)edium, we proceed to second step and calculate the anomaly scores of portjof the considered switch as ASSj(s) andASDj(s),j = 1, . . . , m. We say that portj
is under attack if and only if both anomaly scores associated with that port are above the upper threshold. The port is safe if both anomaly scores are below the lower threshold. Other outcomes are considered to be inconclusive, requiring further measurements.
In a SCADA network, in which the network topology is based on a hierarchical tree structure, the anomaly score of a sub-tree is the sum of the anomaly scores of all switches belonging to that sub-tree. To locate an anomaly in a SCADA network, one can iterate over the network tree topology, starting from the root node and visiting the child nodes, each time discontinuing the visit if the overall sub-tree anomaly score is low. If the sub-tree anomaly score is medium or high, the nodes connected to the sub-tree root are visited in turn.
IV. PERFORMANCEEVALUATION A. Experimental Setup
We used Mininet 2.3.0 to build the network and Flood-light 1.2 as the central SDN controller. The communication between TAC and the switches is done with OpenFlow 1.3. Figure 2 depicts the architecture that used throughout the paper. Our architecture consisted of one HMI at the top level and three substations. Each substation was composed of one SDN switch linked to three sensors/actuators. We considered three typical SCADA protocols: Modbus, DNP3,
and IEC 60870-5-104. A Modbus server ran on hosts h1,h4,
andh7, a DNP3 server onh2,h5, andh8, and an IEC
60870-5-104 server on h3, h6, and h9. The HMI was connected
to all sensors/actuators (h1–h9), read measurements and sent
commands periodically.
Although SCADA presents remarkably regular traffic due to the fact that the majority of the devices generate data in a periodic fashion, unusual behaviors can occur, such as testing a new monitor configuration, software update requests, malfunctioning devices, etc. To simulate this behavior, we ran-domly selected one host from each substation which generates background HTTP traffic at random intervals.
B. Experimental Evaluation
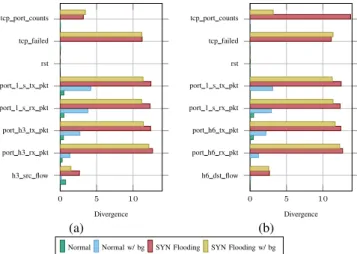
We setδ= 60sandT = 24in all our experiments. Before collecting observations with attacks, we obtained two obser-vations of the SCADA network without attacks. One of these observations was considered as the reference behavior and the other one was a first observation to compare with the reference one. We then carried out four distinct attacks: SYN flooding attack, half-open TCP port scan, UDP port scan and, finally, TCP port scan against multiple targets (see Section III-A). Moreover, for each attack, we changed the location of the attacker and the victim hosts. The KLD entropy, given its low computation overhead, was used to identify the presence of network anomalies. To show the merit of our approach, we compare the entropy of the selected features without attack to the entropy when under attack and with background traffic. To this end, in Figure 3a we plot the divergence of the selected features between the probability distribution under attack and the reference distribution (red lines) with the divergence for some features between an observation without attack and the reference distribution (green lines).
1) SYN Flooding Attack: In this attack, the attacker running on h3, which is connected to switch s2, is targeting the host
h6, connected to switchs3. Figure 3a shows the results related
to switchs2and Figure 3b shows the obtained entropy of the
different selected features of switchs2 and switchs3. During
this attack, the adversary starts to send a large number of SYN-packets without waiting for an answer from the destination and hence, without concluding the well-known handshake of TCP. As we can see in Figure 3, the feature tcp_failed has a high entropy value. Furthermore, the entropy of TCP port increases substantially when the attack is taking place. Another indicator is the entropy linked to the number of packets that pass through the physical port of the switch that is connected to the device involved in the attack. It is worth mentioning that the entropy ties to flows: while in switch s2 (where the
attacker is connected) the number of source flows increases, switchs3 (where the target is located), presents an increasing
number of destination flows. Consequently, the KLD entropy successfully detects the deviation in the entropy distribution during an attack, even in the presence of background traffic.
2) Half-open TCP Port Scan: In this experiment, the at-tacker is located in hosth4, which is connected to switch s3.
0 5 10 tcp port counts tcp failed rst port 1 s tx pkt port 1 s rx pkt port h3 tx pkt port h3 rx pkt h3 src flow Divergence (a) 0 5 10 tcp port counts tcp failed rst port 1 s tx pkt port 1 s rx pkt port h6 tx pkt port h6 rx pkt h6 dst flow Divergence (b)
Normal Normal w/ bg SYN Flooding SYN Flooding w/ bg
Fig. 3: Results of host h3 connected to switch s2 running a
SYN flooding attack against hosth6 connected to switch s3.
The error bars indicate the difference relative to the results with background traffic. The first row shows results for switchs2 and second shows results for s3.
and 4b) show the divergence of the selected features related to switch s3 and s4 respectively. As expected, we have a
0 5 10 tcp port counts tcp failed rst port 1 s tx pkt port 1 s rx pkt port h4 tx pkt port h4 rx pkt h4 src flow Divergence (a) 0 5 10 tcp port counts tcp failed rst port 1 s tx pkt port 1 s rx pkt port h7 tx pkt port h7 rx pkt h7 dst flow Divergence (b)
Normal Normal w/ bg TCP Port Scan TCP Port Scan w/ bg
Fig. 4: Comparison between the results without background traffic (a) and with background traffic (b) ofh4running a TCP
port scan attack against h7. The results show the significant
statistical measures of switchs4
pick of the entropy related to the features linked to TCP connections:tcp_port_counts,tcp_failed, andrst. The most relevant feature isrst, which represents the entropy of reset packets counter. During a half-open TCP port scan, the attacker sends many SYN packets to different TCP ports on the target, and the inactive ports respond with a reset packet. In theory, the entropy of this feature should only increase in the switch where the attacker is located (switchs3). However, our
entropies are calculated over the traffic that passes through the switchs3 without excluding the packets which do not belong
to its sub-network.
3) UDP Port Scan: An attacker would scan not only scan TCP ports but also UDP ports to increase the attack vector. In this experiment, the attacker is running in host h8 and
attempts to scan h4. The results can be seen in Figure 5.
With and without background traffic, the entropy of the
fea-0 5 10 udp port counts
udp connection port 1 s tx pkt port 1 s rx pkt port h8 tx pkt port h8 rx pkt h8 src flow Divergence (a) 0 5 10 udp port counts
udp connection port 1 s tx pkt port 1 s rx pkt port h3 tx pkt port h3 rx pkt h2 dst flow Divergence (b)
Normal Normal w/ bg UDP Port Scan UDP Port Scan w/ bg
Fig. 5: Comparison between the results without background traffic (a) and with background traffic (b) ofh8running a UDP
Port scan attack against h4. The results show the significant
statistical measures of switch s4.
turesudp_connectionandport_udp_countsare very high compared to the normal state of the SCADA network. For instance, considering the switch s4, the KLD value of
udp_connectionandport_udp_countsis between 9–
10. For switch s2, the value range of these features is 8–9.
Note that an attacker who wants to get a wider overview of the network would use a port scanner to try a range of target IP addresses. For each responding IP address, the corresponding host would be scanned, searching for open ports.
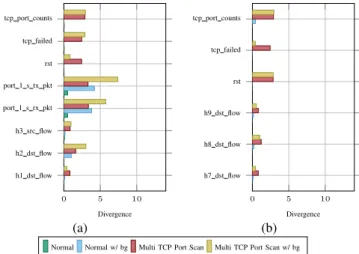
4) TCP PortScan Attack – Multiple Target: This attack is similar to that carried out in Section IV-B2, but in this experiment the port scan attack is done for a whole range of IP addresses, i.e., searching for multiple target hosts. The attacker ish3, linked to switchs2. The obtained entropies for
switchs2and switchs4are shown in Figure 6a and Figure 6b
respectively. The features related to TCP show an increase of their entropy under attack, clearly indicating the presence of an anomaly in the SCADA. In addition, the entropy linked to the flow shows a slight deviation from the normal distribution, which can also be an an indicator for an ongoing attack.
C. Example of Attack Localization
We evaluate the ability of our approach to localize an attack using the information collected by the different TACs. As a reference, we use the normal observation described in the previous section. As detailed in Section III-C, we consider the values of the anomaly scores AS. To determine the different thresholds appearing in Equation 2, we apply k-means cluster-ing. Table I reports the results obtained. Then, we evaluate the anomaly scores of the network sketched Figure 2 under four
0 5 10 tcp port counts tcp failed rst port 1 s tx pkt port 1 s rx pkt h3 src flow h2 dst flow h1 dst flow Divergence (a) 0 5 10 tcp port counts tcp failed rst h9 dst flow h8 dst flow h7 dst flow Divergence (b)
Normal Normal w/ bg Multi TCP Port Scan Multi TCP Port Scan w/ bg
Fig. 6: Comparison between the results without background traffic (a) and with background traffic (b) of h3 running a
TCP Portscan attack against all the hosts. The results show the significant statistical measures of switch s2 and, as example,
the results related to switchs4.
````
````
`
Attacks
Thresholds
Medium exp value High exp value
SYN Flooding 1.16 10.49
TCP Port Scan 0.11 0.39
UDP Port Scan 1.03 10.08 TCP Port Scan Multi 1.18 2.55
TABLE I: Computed thresholds for all attacks using k-means clustering.
attacks. The output of the overall scoreAS(s),∀switch s, is shown in table II. TheGreen,BrownandRedcolors indicate respectively no involvement in any attack, strange behavior of the switch and finally a definite involvement in an ongoing attack.
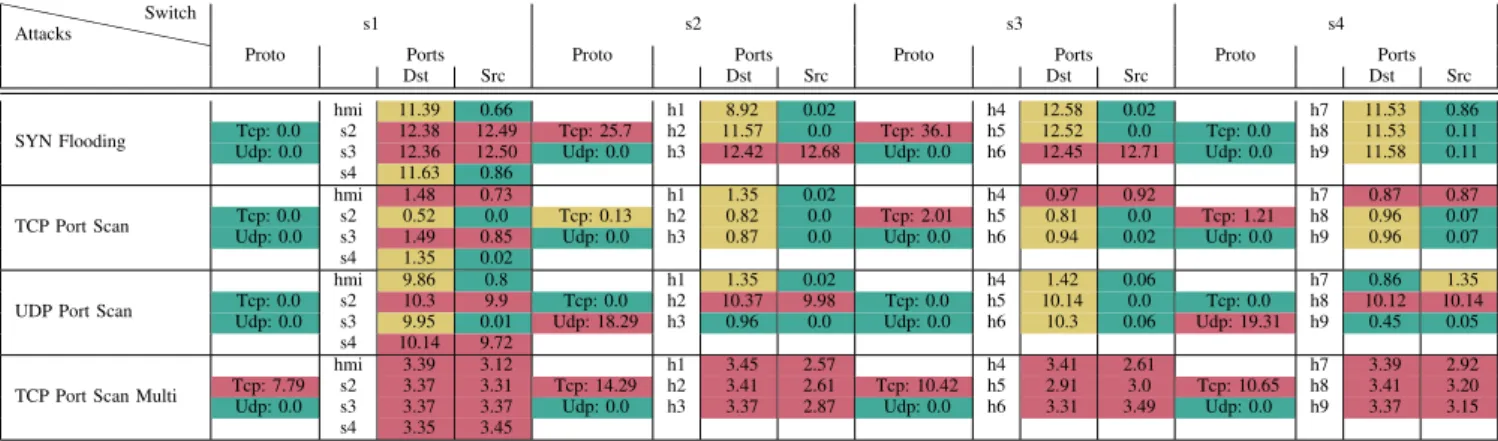
Table III shows the results of the second step of the attack localization analysis, where we aim at pinpointing switches and links under attack. To set alarm level values, hence colors, we use Equation 2, with the same thresholds as above (see Table II). As explained in Sec. III-C, a port is Red if and only if the destination and source scores of that port are both higher thanhigh exp value. It is important to underline that we are able to discard alarms on specific links, when they are false positives, even if the attack was only of short duration. For example, the TCP port scan affected only one snapshot in an observation. In this case, there is an outlier, i.e., the link between the switch s1 and the host that in the SCADA
Switch SYN Flooding TCP Port Scan UDP Port Scan TCP Port Scan Mult.
s1 0.0 0.0 0.0 4.81
s2 23.15 0.09 36.68 10.68
s3 25.05 1.69 0.0 7.49
s4 0.0 0.89 39.51 7.99
TABLE II: Comparison between the overall AS for Network under SYN flooding attack, UDP port scan, TCP port scan, TCP port scan against multiple targets.
system plays the role of HMI turns out to have a nonGreen
alarm level. The reason why we find an outlier is that the traffic produced by this host is not easily predictable: since the HMI hosts the central controller of the SCADA network, it randomly queries, sends commands and receives replies from sensors. Examination of table II indicates that the switch s1
is not involved in the attack, so we can easily deduce that we are in presence of a false positive.
V. RELATEDWORK
Literature on signature-based IDSs in SCADA systems has revealed their limitations. For instance, exhaustively defining the signature of an attack is a laborious task and is impossible to recognize unknown attacks (zero-day attacks). Additionally, IACSs present peculiarities such as predefined set of users, a prior known relationships between the controlled plant and system topology. These characteristics contribute to the derivation of a normal behavior that can be exploitable by anomaly-based IDS. In this light, several studies have focused on the detection of anomalies in SCADA [13]–[19]. These techniques can be further classified into six methods [20]: 1) statistical [13]–[16], 2) classification-based [17], 3) clustering and outlier-based [18], [19], 4) soft computing, 5) knowledge-based and 6) combination learners.
Given that statistical approaches do not require prior knowl-edge of normal system behavior and are able to trigger alarms or notification when a threshold is exceeded (i.e. significant deviation), several statistical IDSs have been proposed, such as Network at Guard (N@G) and Flow-based Statistical Ag-gregation Scheme (FSAS).
Nevertheless, IDSs are traditionally implemented as mid-dleboxes with dedicated devices for monitoring, filtering, and possibly manipulating network traffic. This design has many limitations, as SCADA systems are undergoing rapid change (distributed deployment, increased connectivity, etc.) and subsequently these middleboxes must be reprogrammed to implement new services [21]. Although SDN is deemed to address only network operation and resource management, a number of recent research papers have proposed the use of SDN to ensure the implementation of efficient and flexible security policies [21]–[23]. SDN allows the deployment of a variety of defenses without altering the SCADA network pro-tocols or the logic behavior of the its elements. However, most of these efforts focus on the application of flexible security policies through the use of a centralized SDN controller. A preliminary work was carried out in [24], where the authors use multiple local SDN controllers, which are deployed in every substation. Each local SDN controller is connected to a local security controller which collects the data periodically from SCADA devices and checks for suspicious activity. In contrast to previous studies, our work focuses not only on the detection but also on the localization of attacks using multiple SDN controllers, which are co-located with local agents/probes.
`` ```` ``` Attacks Switch s1 s2 s3 s4
Proto Ports Proto Ports Proto Ports Proto Ports
Dst Src Dst Src Dst Src Dst Src
SYN Flooding
hmi 11.39 0.66 h1 8.92 0.02 h4 12.58 0.02 h7 11.53 0.86
Tcp: 0.0 s2 12.38 12.49 Tcp: 25.7 h2 11.57 0.0 Tcp: 36.1 h5 12.52 0.0 Tcp: 0.0 h8 11.53 0.11 Udp: 0.0 s3 12.36 12.50 Udp: 0.0 h3 12.42 12.68 Udp: 0.0 h6 12.45 12.71 Udp: 0.0 h9 11.58 0.11
s4 11.63 0.86 TCP Port Scan
hmi 1.48 0.73 h1 1.35 0.02 h4 0.97 0.92 h7 0.87 0.87
Tcp: 0.0 s2 0.52 0.0 Tcp: 0.13 h2 0.82 0.0 Tcp: 2.01 h5 0.81 0.0 Tcp: 1.21 h8 0.96 0.07 Udp: 0.0 s3 1.49 0.85 Udp: 0.0 h3 0.87 0.0 Udp: 0.0 h6 0.94 0.02 Udp: 0.0 h9 0.96 0.07
s4 1.35 0.02
UDP Port Scan
hmi 9.86 0.8 h1 1.35 0.02 h4 1.42 0.06 h7 0.86 1.35
Tcp: 0.0 s2 10.3 9.9 Tcp: 0.0 h2 10.37 9.98 Tcp: 0.0 h5 10.14 0.0 Tcp: 0.0 h8 10.12 10.14 Udp: 0.0 s3 9.95 0.01 Udp: 18.29 h3 0.96 0.0 Udp: 0.0 h6 10.3 0.06 Udp: 19.31 h9 0.45 0.05
s4 10.14 9.72 TCP Port Scan Multi
hmi 3.39 3.12 h1 3.45 2.57 h4 3.41 2.61 h7 3.39 2.92
Tcp: 7.79 s2 3.37 3.31 Tcp: 14.29 h2 3.41 2.61 Tcp: 10.42 h5 2.91 3.0 Tcp: 10.65 h8 3.41 3.20 Udp: 0.0 s3 3.37 3.37 Udp: 0.0 h3 3.37 2.87 Udp: 0.0 h6 3.31 3.49 Udp: 0.0 h9 3.37 3.15
s4 3.35 3.45
TABLE III: Comparison between the AS for all attacks. For each switch, we have the scores related to protocols and per each active ports the score related to set D and S.
VI. CONCLUSION
In this paper, we have presented an SDN-based attack detection framework, which is dedicated to SCADA systems. We leverage SDN, defining a lightweight dedicated controller, the TAC, that performs statistical data collection, processing and uploading in the centralized IDS data-base. In addition, since SCADA protocols such as Modbus, DNP3, or IEC-104 follow repetitive traffic patterns we have defined a KLD metric to assess whether the observed traffic contains attack profiles. Performance results of experimentation realized for SYN-flooding and port scan attacks show the effectiveness of the proposed attack detection algorithm.
REFERENCES
[1] N. Falliere, L. O. Murchu, and E. Chien, “W32.Stuxnet Dossier,” Symantec, Tech. Rep., 2011.
[2] “ModBus Application Protocol Specification V1.1b 3,” http://www. modbus.org/docs/Modbus Application Protocol V1 1b3.pdf, 2012, ac-cessed: 2017-11-24.
[3] “IEEE Standard for Electric Power Systems Communications-Distributed Network Protocol (DNP3),”IEEE Std 1815-2012 (Revision of IEEE Std 1815-2010), pp. 1–821, Oct 2012.
[4] “IEC 60870-5-104, Part 5-104: Transmission protocols - Network access for IEC 60870-5-101 using standard transport profiles,” International Electrotechnical Commission (IEC), Tech. Rep., 06 2006.
[5] N. R. Rodofile, K. Radke, and E. Foo, “Real-Time and Interactive Attacks on DNP3 Critical Infrastructure Using Scapy,” inProceedings of the 13th Australasian Information Security Conference (AISC 2015), 2015, pp. 67–70.
[6] P. Maynard, K. McLaughlin, and B. Haberler, “Towards Understanding Man-In-The-Middle Attacks on IEC 60870-5-104 SCADA Networks,” inProceedings of the 2nd International Symposium for ICS & SCADA Cyber Security Research 2014 (ICS-CSR 2014), Sep. 2014.
[7] J. R. Werling, “Behavioral profiling of SCADA network traffic using machine learning algorithms,”Master thesis, 2014.
[8] “14028,” Available from MITRE, CVE-ID CVE-2017-14028., 2017. [Online]. Available: http://cve.mitre.org/cgi-bin/cvename. cgi?name=CVE-2017-14028
[9] “10632,” Available from MITRE, CVE-ID CVE-2018-10632., 2018. [Online]. Available: http://cve.mitre.org/cgi-bin/cvename. cgi?name=CVE-2018-10632
[10] R. Mohammadi, R. Javidan, and M. Conti, “SLICOTS: An SDN-Based Lightweight Countermeasure for TCP SYN Flooding Attacks,” IEEE Transactions on Network and Service Management, vol. 14, no. 2, pp. 487–497, June 2017.
[11] S. Kullback and R. A. Leibler, “On information and sufficiency,”Annals of Mathematical Statistics, vol. 22, pp. 49–86, 1951.
[12] C.-Y. Lin and S. Nadjm-Tehrani, “Understanding IEC-60870-5-104 Traffic Patterns in SCADA Networks,” inProceedings of the 4th ACM Workshop on Cyber-Physical System Security, ser. CPSS ’18. New York, NY, USA: ACM, 2018, pp. 51–60.
[13] P. Dussel, C. Gehl, P. Laskov, J.-U. Busser, C. Stormann, and J. Kastner, “Cyber-critical Infrastructure Protection Using Real-time Payload-based Anomaly Detection,” inProceedings of the 4th International Conference on Critical Information Infrastructures Security, ser. CRITIS’09. Berlin, Heidelberg: Springer-Verlag, 2010, pp. 85–97.
[14] P. M. Nasr and A. Y. Varjani, “Alarm based anomaly detection of insider attacks in SCADA system,” in2014 Smart Grid Conference (SGC), Dec 2014, pp. 1–6.
[15] F. Simmross-Wattenberg, J. I. Asensio-Perez, P. C. de-la Higuera, M. Martin-Fernandez, I. A. Dimitriadis, and C. Alberola-Lopez, “Anomaly Detection in Network Traffic Based on Statistical Inference andalpha-Stable Modeling,”IEEE Transactions on Dependable and Secure Computing, vol. 8, no. 4, pp. 494–509, July 2011.
[16] I. Nevat, D. M. Divakaran, S. G. Nagarajan, P. Zhang, L. Su, L. L. Ko, and V. L. L. Thing, “Anomaly Detection and Attribution in Net-works With Temporally Correlated Traffic,”IEEE/ACM Transactions on Networking, vol. 26, no. 1, pp. 131–144, Feb 2018.
[17] I. Kang, M. K. Jeong, and D. Kong, “A Differentiated One-class Classification Method with Applications to Intrusion Detection,”Expert Syst. Appl., vol. 39, no. 4, pp. 3899–3905, Mar. 2012.
[18] K. Leung and C. Leckie, “Unsupervised Anomaly Detection in Network Intrusion Detection Using Clusters,” in Proceedings of the Twenty-eighth Australasian Conference on Computer Science - Volume 38, ser. ACSC ’05. Darlinghurst, Australia, Australia: Australian Computer Society, Inc., 2005, pp. 333–342. [Online]. Available: http://dl.acm.org/citation.cfm?id=1082161.1082198
[19] P. Casas, J. Mazel, and P. Owezarski, “Unsupervised Network Intru-sion Detection Systems: Detecting the Unknown without Knowledge,”
Computer Communications, vol. 35, no. 7, pp. 772–783, 2012. [20] M. H. Bhuyan, D. K. Bhattacharyya, and J. K. Kalita, “Network
Anomaly Detection: Methods, Systems and Tools,”IEEE Communica-tions Surveys Tutorials, vol. 16, no. 1, pp. 303–336, First 2014. [21] A. F. M. Pi´edrahita, V. Gaur, J. Giraldo, ´A. A. C´ardenas, and S. J. Rueda,
“Leveraging Software-Defined Networking for Incident Response in Industrial Control Systems,”IEEE Software, vol. 35, no. 1, pp. 44–50, January 2018.
[22] J. Proenc¸a, T. Cruz, P. Simoes, and E. Monteiro, “How to use Software-Defined Networking to Improve Security-–a Survey,” inProceedings of the 14th European Conference on Cyber Warfare and Security (ECCWS 2015), 07 2015.
[23] E. G. d. Silva, A. S. d. Silva, J. A. Wickboldt, P. Smith, L. Z. Granville, and A. Schaeffer-Filho, “A One-Class NIDS for SDN-Based SCADA Systems,” in2016 IEEE 40th Annual Computer Software and Applications Conference (COMPSAC), vol. 1, June 2016, pp. 303–312. [24] U. Ghosh, P. Chatterjee, and S. Shetty, “A Security Framework for SDN-Enabled Smart Power Grids,” in 2017 IEEE 37th International Conference on Distributed Computing Systems Workshops (ICDCSW), June 2017, pp. 113–118.