Citation: Farhad, Farnoosh, Zhang, Xiang and Smyth-Boyle, David (2019) Fatigue behaviour of corrosion pits in X65 steel pipelines. Proceedings of the Institution of Mechanical Engineers, Part C: Journal of Mechanical Engineering Science, 233 (5). pp. 1771-1782. ISSN 0954-4062
Published by: SAGE
URL: https://doi.org/10.1177/0954406218776338 <https://doi.org/10.1177/0954406218776338>
This version was downloaded from Northumbria Research Link:
http://nrl.northumbria.ac.uk/id/eprint/44861/
Northumbria University has developed Northumbria Research Link (NRL) to enable users to access the University’s research output. Copyright © and moral rights for items on NRL are retained by the individual author(s) and/or other copyright owners. Single copies of full items can be reproduced, displayed or performed, and given to third parties in any format or medium for personal research or study, educational, or not-for-profit purposes without prior permission or charge, provided the authors, title and full bibliographic details are given, as well as a hyperlink and/or URL to the original metadata page. The content must not be changed in any way. Full items must not be sold commercially in any format or medium without formal permission of the copyright holder. The full policy is available online: http://nrl.northumbria.ac.uk/pol i cies.html
This document may differ from the final, published version of the research and has been made available online in accordance with publisher policies. To read and/or cite from the published version of the research, please visit the publisher’s website (a subscription may be required.)
1
Fatigue behaviour of corrosion pits in X65 steel pipelines
Farnoosh Farhad
1,2,*, Xiang Zhang
2and David Smyth-Boyle
3Abstract
Corrosion pits are a form of geometrical discontinuity that lead to stress and strain concentration in engineering components, resulting in crack initiation under service loading conditions and ultimately fracture and failure. Initiation and propagation of cracks in offshore pipelines can lead to loss of containment and environmental and commercial impacts. In order to prevent such failures, tools to predict the structural integrity of pipelines need to be improved. This work investigates the fatigue behaviour of corrosion pits in API-5L X65 grade steel pipeline utilising numerical and analytical methods. Firstly, load-controlled fatigue tests were carried out on smooth X65 steel samples to establish S-N data. Secondly, local stress-strain behaviour at corrosion pits and its effect on fatigue crack initiation were investigated using elastic-plastic finite element analysis of samples containing a single corrosion pit under cyclic loading. Analysis of stabilised stress-strain hysteresis loops at corrosion pits showed that the local stress ratio at the pit changes from 0.1 to -0.4 while the applied stress amplitude increases with the same stress ratio of 0.1. Analytical methods were also used to predict the local maximum stress and strain at the pit, which showed a similar local stress ratio to the finite element analysis result but lower stress and strain ranges. Finally, fatigue crack initiation life was predicted using the combination of FE stress and strain analysis and the Smith-Watson-Topper (SWT) strain-life approach. An advantage of this method for life estimation is that this approach considers the local stress and strains at corrosion pits rather than applied stress.
Keywords: corrosion pit, crack initiation life, finite element analysis, cyclic plasticity, fatigue life prediction, X65 steel pipelines
1National Structural Integrity Research Centre (NSIRC), Cambridge, UK
2
Faculty of Engineering, Environment and Computing, Coventry University, Coventry, UK
3The Welding Institute Ltd. (TWI), Cambridge, UK
* Corresponding author: Farnoosh Farhad, National Structural Integrity Research Centre (NSIRC), Granta Park,
2
Nomenclature
a Pit depth
a/2c Pit aspect ratio a Material constant
b Fatigue Strength Exponent C Fatigue Ductility Exponent c Half of pit width
E Elastic modulus
E1 Percentage Elongation
K, K Monotonic and Cyclic Strength Coefficient Kf , Kt Fatigue notch and stress concentration factor
f
N Number of cycles to failure i
N Number of cycles to crack initiation
n,n Monotonic and Cyclic strain Hardening Exponent
r Pit radius
t Plate thickness
L
YS , YSU, YS Lower, Upper and Cyclic Yield Strength
S
, Applied and Local stress range
Local strain range
f
, f Fatigue Ductility and Fatigue Strength Coefficient e
Fatigue limit
f
, UTS True Fracture and Ultimate Tensile Strength m
3 1. Introduction
Corrosion pits are a form of geometrical discontinuity that leads to stress and strain concentration in engineering components. As a result, cracks are more likely to initiate from corrosion pits under cyclic loads. Offshore pipelines are subjected to cyclic loadings caused by sea waves, seabed movements and fluctuations in internal pressure [1]. Although carbon steels can be prone to localized forms of corrosion such as pitting in oil and gas production environments, they are commonly used for pipelines [2]. The consequences of fatigue crack development from corrosion pits can be serious, as the failure of offshore components can have serious safety, environmental and financial implications. Localized corrosion is cited as a primary factor in most of the failures reported by the oil and gas industry [2,3]. A more reliable fatigue life prediction model would result in an improvement in maintenance and inspection scheduling, in addition to the potential for further cost reductions due to fewer failures and increased operational safety. It is understood that pitting corrosion fatigue life comprises several stages, viz. pit initiation, pit growth, crack initiation, short crack growth and long crack growth [4,5]. The definition of crack initiation has been a subject of debate for many years and thus far there is no universal consensus. Although some workers have defined crack initiation as the stage that newly formed cracks reach dimensions of the order of the grain size [6], most approaches that attempt to model corrosion fatigue focus on the crack propagation stage rather than crack initiation [7]. Available models used to predict the fatigue crack initiation from corrosion pits [5,8–12] are based on the transition criterion, which is defined using long crack growth rate data and linear elastic fracture mechanics (LEFM). These prediction models assume pits as small cracks and use LEFM criteria to predict long crack. This approach neglects the short crack initiation life, which should not be neglected especially in the high cycle fatigue regime [13]. Limitations in applying this criterion to short crack initiation from pits mean that determining a criterion for short crack initiation from a pit remains a major challenge [14]. The proposed model in this paper does not assume pits as a short crack, but rather as a notch, i.e. a stress concentration site.
Under cyclic loads, it is understood that notches often deform plastically and the short crack initiates from the plastically deformed zones [6,15]. However, research on the pit-to-crack transition has been mostly restricted to considering plastic deformation around the pit, because the available models to predict crack initiation from corrosion pits assume corrosion pits as a crack. Consequentially, these approaches are based on stress intensity factor considerations and the LEFM concept, which is applicable only when small scale yielding is assumed. As the embryonic corrosion pit size is of the scale of microstructure and the level of stress is high, small-scale yielding and linear elastic assumption may be unrealistic for the purpose of estimation of the crack initiation from corrosion pits. The size of the plastic zone around the notch may be similar to the dimensions of the microstructure and hence short cracks interact with the microstructure. It follows that fatigue crack initiation is controlled by local stress at the notch root, and stress intensity factor is not the controlling driving force for crack initiation since the size of notch plastic zone and the microstructure are more significant for short crack initiation [6]. Clearly, fatigue life is more reliably estimated if using predictive models for both the crack initiation and crack propagation stages. In order to provide a more accurate prediction of the initiation phase, local stress field or cyclic strain approaches are of interest [1].
Pit-to-crack transitions under static loading have been investigated numerically and experimentally in previous studies [4,16–24]. However, in spite of the importance of cyclic
4
loading in reducing the life of components, the variation of local stress around corrosion pits under fatigue loading and its influence on fatigue life prediction have not been established. This issue constitutes a significant knowledge gap in the understanding of the pit-to-fatigue crack transition process. Understanding the mechanism involved in this transition and the initial development of the crack has potential to improve the prediction of fatigue life [25]. In reviewing the literature, it became apparent that no previous work was performed on finite element analysis (FEA) of corrosion pits under the cyclic loading.
One approach for the improved prediction of crack initiation is to account for the elastic-plastic behaviour of materials and derive the local stress and strain behaviour at corrosion pits. Moreover, accurate calculation of stress and strain values could provide additional information to assess the influence of mechano-electrochemical effects on the pit-to-crack process and corrosion /corrosion fatigue in general [26]. The combined influences of mechanical and chemical/electrochemical effects (hereafter termed mechano-electrochemical effects) have been studied since the beginning of the 19th century [27]. Previous studies have focused on stress corrosion cracking, corrosion fatigue [28] and hydrogen-induced cracking [29]. Despite the wealth of theoretical and empirical models and experimental data, there is no consensus on a general model to describe the synergistic effects of either elastic stress or plastic strain on electrochemical and corrosion processes.
In general, the influence of elastic stress on corrosion may vary significantly but is limited in magnitude for a given alloy-environment combination. The observed mechano-electrochemical effect is likely to be a combination of change in surface physical properties, microstructural heterogeneity and the deformation of oxide film induced by the external loading. By contrast, the influence of plastic strain is comparatively more significant and primarily related to the production of dislocations, leading to enhancement of the anodic dissolution reaction at the alloy surface [30] and often enhancement of the hydrogen evolution reaction [31].
In the present study, the stress and strain behaviour of typical corrosion pits in X65 steel under cyclic loading is investigated, taking into account the effect of plastic deformation on the pit-to-fatigue crack transition. This aim is achieved by applying the elastic-plastic material model in FE simulations. The results are compared with two analytical models known as the Neuber’s rule and Glinka's rule. These two analytical tools are commonly used as notch stress and strain models when material at the location of maximum stress is not anticipated to behave elastically [32–34]. To the best of our knowledge, these analytical procedures have not been used in the study of corrosion pits in the open literature. Moreover, the detailed local Finite Element Analysis (FEA) of corrosion pits helped predict the corrosion pit behaviour based on its local stress ratio.
Since the pit-to-fatigue crack transition life can have a considerable impact on the total fatigue life [35], the transition time is investigated in this paper. The work presented herein describes a novel work scope to determine the pit-to-fatigue crack transition lifetime, using FEA and the Smith-Watson-Topper (SWT) equation [36]. The SWT equation can be used to predict the initiation of small cracks of the order of 1mm from notches [15]. However, no previous study has used this approach to investigate the pit-to-fatigue crack transition life. The proposed method described in this paper can improve the life estimation.
5 2. Material and specimens
The material of interest in this study is seamless API-5L X65 grade pipeline steel. The material was provided by the industrial sponsor. The chemical composition was obtained by optical emission spectroscopy at The Welding Institute (TWI Ltd.) and the mechanical properties obtained from the literature [37], both of which are shown in Tables 1 and 2 respectively. Although the composition of the steel used in this work is not exactly the same as that given for X65 steel in Ref. [37], the difference does not affect the mechanical properties of the material.
Table 1: Chemical composition of API-5L X65 steel (mass %).
C Si Mn Mo Cr P Cu S Ni V
0.06 0.11 1.38 0.21 0.27 0.01 0.027 0.002 0.022 0.053
Table 2: Mechanical properties of API 5L-X65 steel [33].
Monotonic load Cyclic load
Elastic modulus, E(GPa) 211.33±0.6 Fatigue Strength Coefficient, f
(MPa) 801.8
Upper Yield Strength, YSU(MPa) 520±2 Fatigue Strength Exponent, b -0.068 Lower Yield Strength, YSL(MPa) 516±4.4 Fatigue Ductility Coefficient, f 0.372 Ultimate Tensile Strength, UTS
(MPa) 614±3.4 Fatigue Ductility Exponent, C -0.584
Percentage Elongation, %E1 15.72±0.9 Cyclic Yield Strength, YS(MPa) 420 Strength Coefficient, K(MPa) 910±8.05 Cyclic Strength Coefficient, K
(MPa) 923
Strain Hardening Exponent, n 0.127 Cyclic Strain Hardening Exponent,
n 0.118
True Fracture Strength, f(MPa) 1034
The stress-life curve (S-N) is generally adopted for high cycle fatigue regions. The relationship between stress amplitude and the number of cycles to failure (S-N) at a stress ratio of -1 was obtained by substituting the cyclic mechanical properties of API-5L X65 steel (f, fatigue strength coefficient and b, fatigue strength exponent) from Table 2 into equation 1 [15]. At a stress ratio of 0.1, this relationship was also estimated by using the Gerber equation (Eq. 2) and equation 1. The Gerber equation [15] is one of the widely used empirical relations in fatigue analysis and takes account of the mean stress effect, which is expressed in terms of the R ratio in S-N data. Experimental results shown in Figure 2 indicate good correlation with the values determined using the approach outlined above. Minor differences can be explained by the effect of sample size. b f f a (2N ) 2 (1)
6 1 2 UTS m e a (2)
There is a paucity of published data on the cyclic mechanical behaviour of X65 steel, therefore to assess the relationship between applied stress amplitude and the number of cycles to failure (S-N curve) in X65 steel, load controlled fatigue tests were carried out. Flat smooth specimens were designed in accordance with ASTM E466 (Figure 1a) and machined from the longitudinal length of the pipes provided by the industrial sponsor (Figure 1b). The seamless pipe had an outer diameter of 273mm and wall thickness of 29mm. Only parent material remote from the girth weld was used in the present study. The surface of all specimens was ground with papers to a 4000 grit finish and polished longitudinally with 3µm diamond to eliminate the effect of residual stress and surface roughness on fatigue behaviour.
(a) (b)
Figure 1: a) Test specimen geometry and dimensions (mm), b) Schematic of test sample direction extracted from aseamless pipe with the outer diameter of 273mm and the wall
thickness of 29mm.
Six smooth specimens were tested using sinusoidal tension-compression cyclic loading (stress ratio of -1) at a frequency of 10Hz and different stress amplitudes in the range 200MPa to 280MPa. A servo-hydraulic fatigue testing machine with a load capacity of 50KN was used. In order to avoid excessive machine times, tests were terminated at 2.5×10⁶ cycles in the absence of specimen failures (‘run-outs’), as indicated in Figure 2. For the purpose of mean stress consideration on the S-N curve, force-controlled fatigue tests were carried out on 3 samples under a sinusoidal wave tension-tension cyclic loading (stress ratio of 0.1) at the frequency of 15 Hz by using a 30kN servo-hydraulic fatigue testing machine. The applied stress amplitude levels ranged between 198MPa and 230MPa. For these series of tests, run-outs were designated at 107 cycles (see Figure 2). Using the same test condition, fatigue tests were undertaken also on four pre-pitted samples. A corrosion pit was created on the centre of each sample, prior to starting the
7
fatigue tests, by using VersaScan electrochemical instrument and standard methods. Table 3 shows the size of the pit on each sample. All the fatigue tests were carried out in the air at ambient temperature (21°c). The fatigue test methods were performed in accordance with ASTM standard E468-11 and alignments conducted as based on ASTM E606 prior to starting the test. Figure 2 shows that the results of experiments are close to the estimated S-N curve in both tested stress ratios (for a given life, the relative error in stress amplitude lies in the range 0-11%), therefore the estimated S-N curve can be a representative of tested X65 steel and is used in future sections.
Table 3: Pit geometries created on each fatigue tests sample. Sample Number Depth, a (mm) Pit width, 2c Aspect Ratio, a/2c
1 0.0763 0.6 0.13
2 0.0851 0.676 0.13
3 0.0344 0.271 0.13
4 0.0674 0.608 0.11
Figure 2: Stress-life (S-N) curve for X65 steel used in R= -1 and R= 0.1. Arrows indicate run-out tests. 0 50 100 150 200 250 300 350 400 450 500
1.E+05 1.E+06 1.E+07
Str ess a m pli tud e (M P a ) No of Cycles to failure R= -1, Estimated based on Eq. 1 R= -1, Experiments
R= 0.1, Estimated based on Eq. 1 and 2 R= 0.1, Experiments
8 3. Cyclic stress-strain analysis
3.1. Finite Element Analysis (FEA)
Due to the costs associated with extended test programmes and availability of increased computing power, FEA is fast becoming a key tool in structural integrity studies, in particular at the design stage prior to material testing. Recently, there has been interest in evaluating stress and strain in corrosion pits using FEA, however these studies have been limited to elastic material models and static loading. Considering the important effect of cyclic loading and plastic deformation around the pit on crack initiation as described in Section 1, in this study a 3D elastic-plastic FEA was conducted employing ABAQUS software to investigate the local stress and strain behaviour at the pit under fatigue loading.
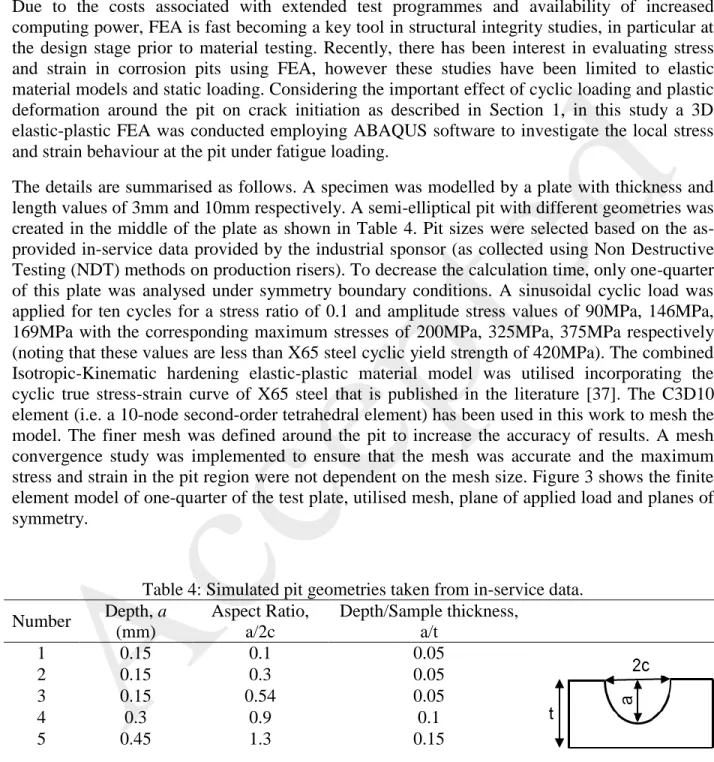
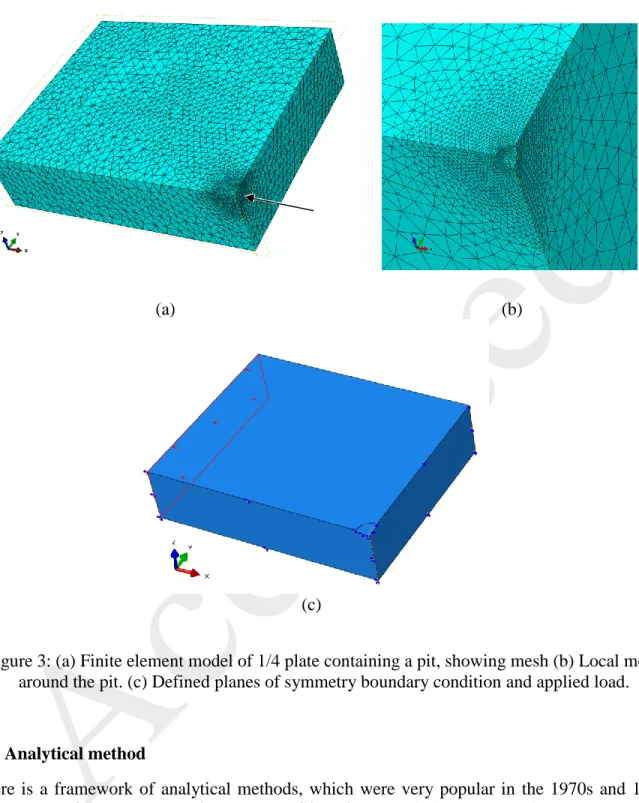
The details are summarised as follows. A specimen was modelled by a plate with thickness and length values of 3mm and 10mm respectively. A semi-elliptical pit with different geometries was created in the middle of the plate as shown in Table 4. Pit sizes were selected based on the as-provided in-service data as-provided by the industrial sponsor (as collected using Non Destructive Testing (NDT) methods on production risers). To decrease the calculation time, only one-quarter of this plate was analysed under symmetry boundary conditions. A sinusoidal cyclic load was applied for ten cycles for a stress ratio of 0.1 and amplitude stress values of 90MPa, 146MPa, 169MPa with the corresponding maximum stresses of 200MPa, 325MPa, 375MPa respectively (noting that these values are less than X65 steel cyclic yield strength of 420MPa). The combined Isotropic-Kinematic hardening elastic-plastic material model was utilised incorporating the cyclic true stress-strain curve of X65 steel that is published in the literature [37]. The C3D10 element (i.e. a 10-node second-order tetrahedral element) has been used in this work to mesh the model. The finer mesh was defined around the pit to increase the accuracy of results. A mesh convergence study was implemented to ensure that the mesh was accurate and the maximum stress and strain in the pit region were not dependent on the mesh size. Figure 3 shows the finite element model of one-quarter of the test plate, utilised mesh, plane of applied load and planes of symmetry.
Table 4: Simulated pit geometries taken from in-service data. Number Depth, a (mm) Aspect Ratio, a/2c Depth/Sample thickness, a/t 1 0.15 0.1 0.05 2 0.15 0.3 0.05 3 0.15 0.54 0.05 4 0.3 0.9 0.1 5 0.45 1.3 0.15
9
(a) (b)
(c)
Figure 3: (a) Finite element model of 1/4 plate containing a pit, showing mesh (b) Local mesh around the pit. (c) Defined planes of symmetry boundary condition and applied load.
3.2. Analytical method
There is a framework of analytical methods, which were very popular in the 1970s and 1980s when computing power was low. Even with today’s available computation resource, these analytical methods are still a useful complement to FEA as the former offers quicker analysis and are also useful for parametric studies. Neuber developed a model to include the contribution of plastic strain in evaluating the notch stress and strain [38]. Glinka has also improved the calculation methods of the notch root strain by taking account of the plastic yielding around the notch root [39]. In this paper, the local stress and strain ranges at corrosion pits were calculated by simultaneously solving the material’s cyclic stress-strain relationship (Eq. 3) with either the Neuber’s rule (Eq. 4) [15,38] or the Glinka’s rule (Eq. 5) [15,39]. The required cyclic and
10
monotonic mechanical properties in these equations, i.e. E,nandK, were taken from Table 2. The required stress concentration factor, Kt in Eq. 5, and fatigue notch factor, Kf in Eq. 4, were calculated using equations 6 and 7, where r was found by Eq. 8 [40]. The parameter in Eq. 7 is a material constant [40] that in this study equals to 0.226 mm. The results were compared with FEA results. It should be noted that advanced computational techniques such as elastic-plastic FEA can be a more powerful notch stress/ strain monitoring method [32].
) / 1 ( ) 2 ( 2 n K E (3) E S Kf. )2 ( . (4) E S K K n E t n 2 ) / 1 ( 2 ) . ( ) 2 ( 1 4 (5) 2 ) a c ( 1 2 25 . 1 1 t K (6) r 1 1 1 a K K t f (7) )2 a c ( 1 2 a r (8)
The SWT equation [36] has been successfully applied to predict the crack initiation life [41]. The advantage of this model is that it allows consideration of the effect of mean stress on fatigue life. In the present study, following determination of the local stress and strain values by finite element simulations, the Smith-Watson-Topper equation (Eq. 9) [15,36] and the cyclic mechanical behaviour of X65 steel were utilised to predict fatigue life to the formation of a small crack under cyclic loading, i.e. Ni. In other words, the maximum stress at the pit and local strain range were taken from the FEA output and then inputted in equation 9 along with the material mechanical properties from Table 2. A MATLAB code was written to solve equations 3 to 9. In the SWT equation, mean stress effect is accounted for by the maximum stress term as shown in Eq. (9). C b i f f b i f a N E N ( ) (2 ) (2 ) 2 2 max (9)
4. Results and Discussions
4.1. Comparison between FEA and analytical methods
To study the behaviour of a corrosion pit under cyclic loading, elastic-plastic FEA was carried out on a sample containing a pit under the cyclic load-controlled condition at the stress ratio of 0.1 and different stress amplitudes. Figure 4 presents calculated stress-strain hysteresis loops of
11
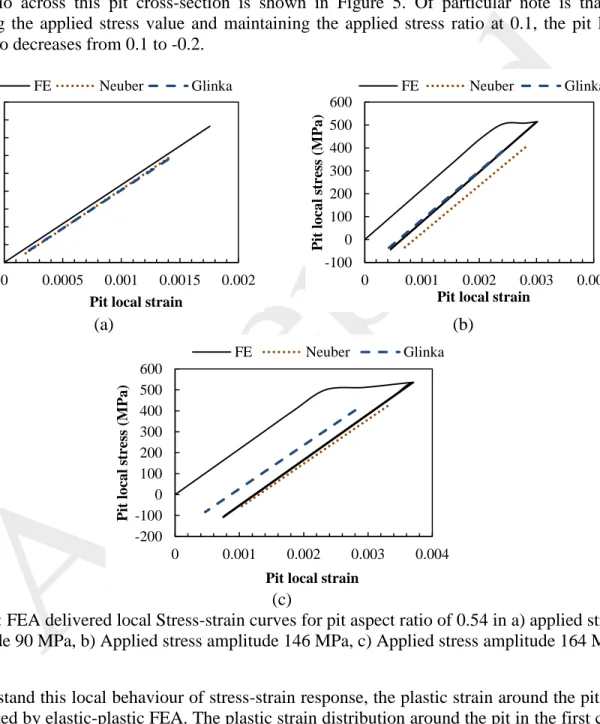
a node at the base of the pit in three different applied stress amplitudes for the pit with an aspect ratio of 0.54 (pit number 3 in Table 4). The stable condition was reached in these loops, i.e. stress-strain loops no longer change shape from one cycle to another. This illustrates that the stress-strain hysteresis is fully elastic when the applied stress amplitude is less than 146 MPa and at higher applied stress amplitude a plastic deformation is seen at the first cycle but the stress-strain response becomes linear in the following cycles. This cyclic plastic deformation process can lead to multiple crack initiation at the relevant locations in the pit [41]. The variation of local stress ratio across this pit cross-section is shown in Figure 5. Of particular note is that by increasing the applied stress value and maintaining the applied stress ratio at 0.1, the pit local stress ratio decreases from 0.1 to -0.2.
(a) (b)
(c)
Figure 4: FEA delivered local Stress-strain curves for pit aspect ratio of 0.54 in a) applied stress amplitude 90 MPa, b) Applied stress amplitude 146 MPa, c) Applied stress amplitude 164 MPa
To understand this local behaviour of stress-strain response, the plastic strain around the pit was investigated by elastic-plastic FEA. The plastic strain distribution around the pit in the first cycle is presented in Figure 6 for the same pit geometry. It is seen that for this pit morphology, plastic deformation is developed near the pit base when the applied stress amplitude is 146MPa or 164MPa. Comparison of Figure 5 and Figure 6 reveals that where plastic strain occurs, the local stress ratio is decreased to a negative value, which means a compressive local stress has
0 50 100 150 200 250 300 350 400 450 0 0.0005 0.001 0.0015 0.002 P it lo ca l st re ss ( M P a )
Pit local strain
FE Neuber Glinka -100 0 100 200 300 400 500 600 0 0.001 0.002 0.003 0.004 P it lo ca l st re ss ( M P a )
Pit local strain
FE Neuber Glinka -200 -100 0 100 200 300 400 500 600 0 0.001 0.002 0.003 0.004 P it lo ca l st re ss ( M P a )
Pit local strain
12
developed at the unloading reversal. An explanation for this is that when the stress reaches the maximum value, the plastic area experiences tensile stress but when the stress reaches the minimum, compressive stress develops in the plastic zone because it is surrounded by an elastic region that acts as a constraint. This compressive stress reduces the mean stress and the local stress ratio. This mechanism can be confirmed by comparing Figure 5 (showing the local stress ratio for different applied stress) and Figure 6, showing that for higher applied stress, plastic deformation occurs and that it decreases the local stress ratio where plastic strain is observed. The results suggest that plastic deformation around the pit leads to a local compressive stress and a decreased local stress ratio. Collectively, these results are in line with previous studies on fatigue behaviour of notches [41] and provide an important insight in understanding the behaviour of corrosion pits under fatigue loading. The authors further note that the areas with stress ratio less than zero, which are under compression, are likely to be cathodic relative to the adjacent regions under tension (anodic).
Figure 5: The local stress ratio variation along the pit cross-section for pit aspect ratio of 0.54. The maximum and minimum stress and strain at the pit were also calculated by Neuber’s rule and Glinka’s rule under the same cyclic loads and are compared with the hysteresis loop obtained from FEA in Figure 4. It is shown that as the applied stress increases, the difference between the stress or strain range obtained by FEA and analytical models increases. It also reveals that these two analytical models underestimate the stress range and strain range. Further analysis of data provided in Figure 4 (i.e. calculating the local stress ratio from three different methods) indicates that the local stress ratio from Neuber’s rule and Glinka’s rule calculated for all levels of applied stress are close to the local stress ratio obtained from FEA (Figure 7). Finally, Figure 7 appears to indicate that the Glinka approach shows a closer estimation to the FEA results at highest applied stress amplitude.
-0.30 -0.20 -0.10 0.00 0.10 0.20 0 0.05 0.1 P it lo ca l st re ss ra tio
Distance from pit root (mm) . . . σa= 146MPa σa= 164MPa σa= 90MPa
13
Figure 6: The plastic strain along the pit cross-section obtained by FEA in first cycle for pit aspect ratio of 0.54.
Figure 7: Pit local stress ratio obtained by FEA, Neuber and Glinka’s rule for pit aspect ratio of 0.54.
4.2. Effect of pit geometry
The effect of pit geometry on pit maximum stress in X65 steel under static load was studied in a previous study by the authors using FEA and the Neuber's rule [42]. In reviewing the literature, it became apparent that no previous study had been performed on FEA of corrosion pits under cyclic loading. To assess the effect of pit morphology on pit fatigue behaviour, the local stress ratio for different pit shapes was obtained using FEA. Figure 8 presents the relationship between pit aspect ratio and pit local stress ratio. There is a clear trend of decreasing pit local stress ratio
-0.0002 0 0.0002 0.0004 0.0006 0.0008 0.001 0.0012 0.0014 0.0016 0.0018 0 0.05 0.1 P la st ic st ra in in lo a d direc tio n
Distance from pit root (mm) . . . -0.25 -0.2 -0.15 -0.1 -0.05 0 0.05 0.1 0.15 80 100 120 140 160 180 L o ca l st re ss ra tio a t pit
Applied stress amplitude (MPa)
FE Neuber Glinka σa= 90MPa σ a= 146MPa σ a= 164MPa
14
with increasing pit aspect ratio and applied stress, a result that is rather significant. It is clear that when the applied stress amplitude is low (90MPa), the local stress ratio remains the same as the applied stress ratio for all pit geometries, meaning that the pit geometry does not affect the local stress ratio at the pit when the applied stress is low. These results are likely to be related to plastic deformation around the pit. For lower pit aspect ratios and applied stress, no plastic deformation occurs, therefore, the local pit stress ratio remains the same as the applied stress ratio. By contrast, in the case of increasing pit aspect ratio and/or applied stress, plastic deformation increases resulting in lower local stress ratio and lower local mean stress. Taken together, these results suggest that there is an association between plastic deformation around the pit and the local stress ratio. To find the effect of pit geometry on local amplitude stress occurring at the pit, the relationship between pit aspect ratio and local maximum stress is shown in Figure 9. It is seen that for all levels of applied stress, pit geometry has a significant effect on local stress experienced in this area. However, it is also apparent that the rate of increase in local maximum stress decreases as the pit aspect ratio increases.
Figure 8: relationship between local stress ratio and pit geometry with respect to applied stress.
-0.4 -0.3 -0.2 -0.1 0.0 0.1 0.2 0.1 0.6 1.1 P it lo ca l st re ss ra tio
Pit aspect ratio
σa=90MPa σa=146MPa σa=169MPa
15
Figure 9: Relationship between pit geometry and pit base local maximum stress.
4.3. Crack initiation life
The prediction approach used in this paper is to combine the elastic-plastic FE stress/strain analysis with material’s S-N data (or the Strain-Life data in case of higher applied load, e.g. in the low cycle fatigue regime). In this study, the strain-life data is expressed by the SWT equation. Main results are as follows.
The Smith-Watson-Topper (SWT) approach (Eq. 9) was used to predict the fatigue life in terms of the initiation of a small crack of the order of 1mm at the pit under cyclic loading, i.e. crack initiation life, by replacing Nf with Ni and using the local stress and strain of the location where the maximum stress occurs when stress-strain loops become stable. This location was found to be on the pit wall for all the geometries by FE modelling. The crack initiation life, determined using a combination of FEA and SWT, is shown in Figure 10 (showing the effects of pit aspect ratio and applied stress). It is shown that under the same applied stress, the pit with an aspect ratio of 1.3 is the most critical pit because of shorter crack initiation life.
The Gerber equation (Eq. 2) and the S-N data for R= -1 in Figure 2 was also used to predict crack initiation life by using the local stress amplitude and the local mean stress obtained from the FEA at the location where the maximum stress occurs at the pit when the stress-strain loops become stable. Figure 10 presents these data.
Comparing the two prediction approaches, Figure 10 shows that for the lower aspect ratio of 0.54 the two methods give similar predicted life, whereas increasing the aspect ratio (higher local stress and strains) will increase the difference between the two predictive approaches. At a lower applied stress amplitude of 90MPa, the S-N approach predicts a longer crack initiation life than that by the SWT method, although it was expected to be the same values at this stress level as there is no plastic strain in all the pits. At two higher applied stress values, the S-N approach predicted shorter fatigue life.
200.0 250.0 300.0 350.0 400.0 450.0 500.0 550.0 600.0 0.1 0.6 1.1 P it ba se lo ca l m a x im u m s tre ss , ( M P a )
Pit aspect ratio, a/2c σa=90MPa σa=146MPa σa=169MPa
16
The experimental results are reported in Table 5. Predicted load cycles to crack initiation were compared with the experimental results of the pre-pitted samples, shown in Figure 11. Because the fatigue samples were thin, i.e. 3mm, the crack propagation life was short. Therefore in Figure 11, the number of cycles to failure in experimental results was considered as the number of cycles to crack initiation. The local stress amplitude is at the pit base and is calculated by multiplying the applied stress amplitude with the stress concentration factor that was obtained from equation 6 for each pit geometry. As shown by Figure 11, the predicted lives of both prediction methods were in good agreement with the experimental results.
Table 5: The number of cycles to failure for each pre-pitted sample. Sample Number Nf
1 292,691
2 210,077
3 377,358
4 455,758
Figure 10: Crack initiation life from different pit aspect ratios (AR) vs. applied stress amplitude using the prediction method combining FEA and SWT or FEA and theoretical S-N curve in
Figure 2. 80 90 100 110 120 130 140 150 160 170 180
1.E+03 1.E+04 1.E+05 1.E+06 1.E+07
Appl ied st re ss a m pli tud e, ( M P a )
No. of Cycles to crack initiation (Ni)
AR= 1.3, FEA and SWT AR= 1.3, FEA and S-N AR= 0.9, FEA and SWT AR= 0.9, FEA and S-N AR= 0.54, FEA and SWT AR= 0.54, FEA and S-N
17
Figure 11: Comparison of predicted crack initiation lives with experimental tests.
5. Conclusions
A predictive method was proposed that combines finite element analysis (FEA) with material’s empirical fatigue laws to predict the time to crack initiation at corrosion pits. Based on the study, following conclusions can be drawn:
- The X65 steel S-N curve was estimated based on the cyclic mechanical properties of this material and was validated by experiments.
- Cyclic stress-strain analysis by finite element method can deliver the local stress and strain values at the stress concentration sites around corrosion pits.
- The local hysteresis loops revealed that by increasing the applied stress value and maintaining the applied stress ratio at 0.1, the pit local stress ratio decreases from 0.1 to -0.2.
- Owing to the cyclic plasticity effect, local stress ratio at corrosion pit is considerably different from the applied stress ratio, depending on the pit geometry and applied stress level; cyclic plasticity will decrease the local stress ratio resulting in increased cyclic strain range and reduction in fatigue life.
- The Glinka and Neuber’s approaches are alternatives to computationally expensive FEA and are shown to deliver the local stress and strain range to within 20% of the values predicted using FEA.
150 200 250 300 350 400 450 500
1.E+03 1.E+04 1.E+05 1.E+06 1.E+07
L o ca l st re ss a m pli tud e (M P a )
No. of Cycles to crack initiation (Ni)
Prediction 1 (FEA and SWT equation) Prediction 2 (FEA and S-N data) Experimental
Trend line for prediction 1 Trend line for prediction 2
18
- For all levels of applied stress studied in this work, pit geometry has a significant effect on the pit local stress. However, as the pit aspect ratio increases the rate of increase in the local maximum stress decreases.
- Fatigue crack initiation life induced from corrosion pits can be predicted by using the pit local stress and strains in conjunction with the material’s stress vs. life or strain vs. life relationship. The strain-life approach allows accounting for the effect of cyclic plasticity. - The predicted fatigue lives to crack initiation from the corrosion pits were in good
agreement with the experimental results.
- Since the difference between the applied stress ratio and pit local stress ratio is found to be associated with the amount of cyclic plastic deformation around the pit base, this study suggests the development of cathodic or anodic regions in the corrosion pits based on the local stress ratio, which may describe mechano-electrochemical effects on the corrosion pits.
Acknowledgement
This publication was made possible by the sponsorship and support of BP, TWI and Coventry University. The work was enabled through, and undertaken at, the National Structural Integrity Research Centre (NSIRC), a postgraduate engineering facility for industry-led research into structural integrity established and managed by TWI through a network of both national and international Universities.
References
1. Zhang Y, Fan M, Xiao Z, Zhang W. Fatigue analysis on offshore pipelines with embedded cracks. Ocean Engineering. Elsevier; 2016;117:45–56.
2. Zhang G, Cheng Y. Localized corrosion of carbon steel in a CO2-saturated oilfield formation water. Electrochimica Acta. Elsevier; 2011;56(3):1676–85.
3. Mohammed S, Hua Y, Barker R, Neville A. Investigating pitting in X65 carbon steel using potentiostatic polarisation. Applied Surface Science. Elsevier; 2017;423:25–32.
4. Kolios A, Srikanth S, Salonitis K. Numerical simulation of material strength deterioration due to pitting corrosion. Procedia CIRP. Elsevier; 2014;13:230–6.
5. Li S-X, Akid R. Corrosion fatigue life prediction of a steel shaft material in seawater. Engineering Failure Analysis. Elsevier; 2013;34:324–34.
6. Hertzberg RW, Vinci R, Jason LH. Deformation and fracture mechanics of engineering materials. Wiley; 2012;
7. McEvily Jr A. Atlas of stress-corrosion and corrosion fatigue curves. Materials Park, OH; ASM International; 1990;
19
8. Goswami T, Hoeppner D. Review of pit nucleation, growth and pitting corrosion fatigue mechanisms. Journal of the Mechanical Behavior of Materials. 1997;8(2):169–96.
9. Arriscorreta CA. Statistical Modeling for the Corrosion Fatigue of Aluminum Alloys 7075-T6 and 2024-T3. 2012.
10. Kondo Y. Prediction of fatigue crack initiation life based on pit growth. Corrosion. 1989;45(1):7–11.
11. Chen G, Wan K-C, Gao M, Wei R, Flournoy T. Transition from pitting to fatigue crack growth—modeling of corrosion fatigue crack nucleation in a 2024-T3 aluminum alloy. Materials Science and Engineering: A. Elsevier; 1996;219(1):126–32.
12. Sriraman M, Pidaparti R. Crack initiation life of materials under combined pitting corrosion and cyclic loading. Journal of materials engineering and performance. Springer;
2010;19(1):7–12.
13. Ranganathan N, Aldroe H, Lacroix F, Chalon F, Leroy R, Tougui A. Fatigue crack initiation at a notch. International Journal of Fatigue. Elsevier; 2011;33(3):492–9. 14. Burns J, Larsen J, Gangloff R. Driving forces for localized corrosion-to-fatigue crack
transition in Al-Zn-Mg-Cu. Fatigue \& Fracture of Engineering Materials \& Structures. Wiley Online Library; 2011;34(10):745–73.
15. Stephens RI, Fatemi A, Stephens RR, Fuchs HO. Metal fatigue in engineering. John Wiley & Sons; 2000.
16. Horner D, Connolly B, Zhou S, Crocker L, Turnbull A. Novel images of the evolution of stress corrosion cracks from corrosion pits. Corrosion Science. Elsevier;
2011;53(11):3466–85.
17. Cerit M. Numerical investigation on torsional stress concentration factor at the semi elliptical corrosion pit. Corrosion Science. Elsevier; 2013;67:225–32.
18. Turnbull A, Wright L, Crocker L. New insight into the pit-to-crack transition from finite element analysis of the stress and strain distribution around a corrosion pit. Corrosion Science. Elsevier; 2010;52(4):1492–8.
19. Mu ZT, Chen DH, Zhu ZT, Ye B. The Stress Concentration Factor of Different Corrosion Pits Shape. Adv Mater Res 2011; 152: 1115–1119.
20. Cerit M, Genel K, Eksi S. Numerical investigation on stress concentration of corrosion pit. Engineering Failure Analysis. Elsevier; 2009;16(7):2467–72.
20
21. Paik JK, Lee JM, Ko MJ. Ultimate shear strength of plate elements with pit corrosion wastage. Thin-Walled Structures. Elsevier; 2004;42(8):1161–76.
22. Turnbull A, McCartney L, Zhou S. Modelling of the evolution of stress corrosion cracks from corrosion pits. Scripta materialia. Elsevier; 2006;54(4):575–8.
23. Turnbull A, Horner D, Connolly B. Challenges in modelling the evolution of stress
corrosion cracks from pits. Engineering Fracture Mechanics. Elsevier; 2009;76(5):633–40. 24. Rajabipour A, Melchers RE. A numerical study of damage caused by combined pitting
corrosion and axial stress in steel pipes. Corrosion Science. Elsevier; 2013;76:292–301. 25. Figueiredo AMG, de Oliveira Ribeiro G, Dias JF, Modenesi PJ, Queiroz FLP, de Oliveira
Vasconcelos J, et al. An investigation of bending fatigue crack propagation in structural steel by the measurement of indirect parameters. Journal of the Brazilian Society of Mechanical Sciences and Engineering. Springer; 2015;37(1):305–12.
26. Sato N. A theory for breakdown of anodic oxide films on metals. Electrochimica Acta. Elsevier; 1971;16(10):1683–92.
27. Gutman EM. Mechanochemistry of solid surfaces. World Scientific Publishing Co Inc; 1994.
28. Pan T. Corrosion behavior of a duplex stainless steel under cyclic loading: a scanning Kelvin probe force microscopy (SKPFM) based microscopic study. Journal of Applied Electrochemistry. Springer; 2012;42(12):1049–56.
29. Lu B, Yu H, Luo J. Effects of plastic deformation and carbon dioxide on corrosion of pipeline steel in near-neutral pH groundwater. Journal of materials engineering and performance. Springer; 2013;22(5):1430–5.
30. Gutman E, Solovioff G, Eliezer D. The mechanochemical behavior of type 316L stainless steel. Corrosion science. Elsevier; 1996;38(7):1141–5.
31. Lu B, Luo J, Norton P, Ma H. Effects of dissolved hydrogen and elastic and plastic
deformation on active dissolution of pipeline steel in anaerobic groundwater of near-neutral pH. Acta Materialia. Elsevier; 2009;57(1):41–9.
32. Zeng Z, Fatemi A. Elasto-plastic stress and strain behaviour at notch roots under monotonic and cyclic loadings. The Journal of Strain Analysis for Engineering Design. SAGE
Publications; 2001;36(3):287–300.
33. Härkegård G, Mann T. Neuber prediction of elastic-plastic strain concentration in notched tensile specimens under large-scale yielding. The Journal of Strain Analysis for
21
34. Sharpe WN. ASME 1993 Nadai lecture—elastoplastic stress and strain concentrations. Journal of engineering materials and technology. American Society of Mechanical Engineers; 1995;117(1):1–7.
35. Zhou S, Turnbull A. Influence of pitting on the fatigue life of a turbine blade steel. Fatigue and Fracture of Engineering Materials and Structures. Wiley Online Library;
1999;22(12):1083–94.
36. Smith KN, Topper TH, Watson P. A stress-strain function for the fatigue of metals. J mater. 1970;5:767–78.
37. Fatoba O, Akid R. Low cycle fatigue behaviour of API 5L X65 pipeline steel at room temperature. Procedia Engineering. Elsevier; 2014;74:279–86.
38. Neuber H. Theory of stress concentration for shear-strained prismatical bodies with arbitrary nonlinear stress-strain law. Journal of Applied Mechanics. American Society of Mechanical Engineers; 1961;28(4):544–50.
39. Glinka G. Calculation of inelastic notch-tip strain-stress histories under cyclic loading. Engineering Fracture Mechanics. Elsevier; 1985;22(5):839–54.
40. Ahn S-H, Lawrence FV, Metzger MM. Corrosion fatigue of an HSLA steel. Fatigue & Fracture of Engineering Materials & Structures. Wiley Online Library; 1992;15(7):625–42. 41. Htoo AT, Miyashita Y, Otsuka Y, Mutoh Y, Sakurai S. Variation of local stress ratio and
its effect on notch fatigue behavior of 2024-T4 aluminum alloy. International Journal of Fatigue. Elsevier; 2016;88:19–28.
42. Farhad F, Zhang X, Smyth-Boyle D, Khan MK, others. Evaluation of Simulated Corrosion Pits in X65 Steel. Corrosion 2017. NACE International, 2017.