Evaluating I/O Aware Network Management for Scientific
Workflows on Networked Clouds
Anirban Mandal, Paul Ruth, Ilya Baldin,
Yufeng Xin, Claris Castillo
RENCI - UNC Chapel Hill
{anirban,pruth,ibaldin,yxin,claris}@renci.org
Mats Rynge, Ewa Deelman
ISI - USC{rynge,deelman}@isi.edu
ABSTRACT
This paper presents a performance evaluation of scientific workflows on networked cloud systems with particular em-phasis on evaluating the effect of provisioned network band-width on application I/O performance. The experiments were run on ExoGENI, a widely distributed networked in-frastructure as a service (NIaaS) testbed. ExoGENI orches-trates a federation of independent cloud sites located around the world along with backbone circuit providers. The eval-uation used a representative data-intensive scientific work-flow application called Montage. The application was de-ployed on a virtualized HTCondor environment provisioned dynamically from the ExoGENI networked cloud testbed, and managed by the Pegasus workflow manager.
The results of our experiments show the effect of modify-ing provisioned network bandwidth on disk I/O throughput and workflow execution time. The marginal benefit as per-ceived by the workflow reduces as the network bandwidth al-location increases to a point where disk I/O saturates. There is little or no benefit from increasing network bandwidth beyond this inflection point. The results also underline the importance of network and I/O performance isolation for predictable application performance, and are applicable for general data-intensive workloads. Insights from this work will also be useful for real-time monitoring, application steer-ing and infrastructure plannsteer-ing for data-intensive workloads on networked cloud platforms.
Categories and Subject Descriptors
C.2.4 [Computer Systems Organization]: Computer-Communication Networks—Distributed Systems
Keywords
Networked clouds, scientific workflows, performance evalua-tion, performance monitoring, I/O performance
1.
INTRODUCTION
Permission to make digital or hard copies of all or part of this work for personal or classroom use is granted without fee provided that copies are not made or distributed for profit or commercial advantage and that copies bear this notice and the full citation on the first page. Copyrights for components of this work owned by others than ACM must be honored. Abstracting with credit is permitted. To copy otherwise, or republish, to post on servers or to redistribute to lists, requires prior specific permission and/or a fee. Request permissions from [email protected].
NDM’13November 17, 2013, Denver, CO, USA Copyright 2013 ACM 978-1-4503-2522-6/13/11 ...$15.00 http://dx.doi.org/10.1145/2534695.2534698 .
Advanced networks are an essential element of data-driven science enabled by next-generation cyberinfrastructure en-vironments. Computational activities increasingly incorpo-rate widely dispersed resources, and the benefits of utilizing them are often limited by the ability to quickly and effi-ciently access large data-sets on remote resources. The re-cent advances in enabling on-demand network circuits, cou-pled with programmable edge technologies create an un-precedented opportunity to enable complex data-intensive scientific applications to run on dynamic networked cloud
infrastructure.
Data-driven computational workflows and workflow en-sembles are becoming a centerpiece of modern computa-tional science. NIaaS links distributed resources into con-nected arrangements, slices, targeted at solving a specific problem. However, scientists lack the tools that integrate the operation of workflow-driven science applications with dynamic slices of infrastructure. These tools must orches-trate the infrastructure in response to applications, manage application lifetime on top of the infrastructure by moni-toring various workflow steps, expand and shrink slices in response to application demands, and integrate data move-ment with the workflows to optimize performance.
Integrating data movement is particularly important as large datasets would be expected to reside both inside and outside the dynamically created compute infrastructure. The application and application inputs, outputs, and intermedi-ate data will need to be accessed in a timely manner by distributed computational tasks. It is critical to create sys-tems that can fluidly shift data and computation across the infrastructures (static and dynamic), taking advantage of available resources, while providing more predictable per-formance in an environment that can be customized to the needs of the application.
There are three components that are necessary to enable data-driven computational workflows to effectively adapt dynamically provisioned networked cloud infrastructure to the needs of the application.
• Mechanisms for modifying the amount and types of compute, network, and storage resources allocated to the workflow over time.
• Mechanisms for monitoring resource demand for, and utilization of, temporarily allocated resources distributed across administrative domains. This includes com-pute, network, and storage resources.
• Policies for deciding when and how to modify allocated infrastructure based on observed demand and utiliza-tion.
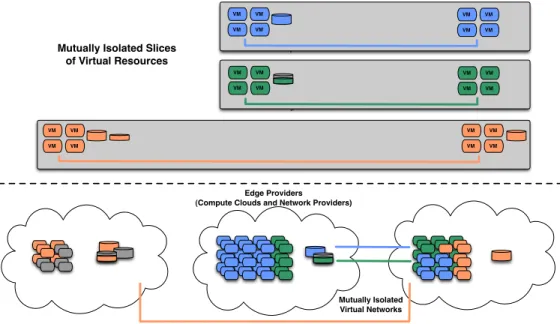
Mutually Isolated Virtual Networks VM VM VM VM VM VM VM VM VM VM VM VM VM VM VM VM VM VM VM VM VM VM VM VM Edge Providers (Compute Clouds and Network Providers)
Mutually Isolated Slices of Virtual Resources
Figure 1: Networked Clouds
In recent years, many cloud Infrastructure-as-a-Service (IaaS) systems have been designed and deployed to address these needs [1, 25, 7, 24]. Among these systems is Exo-GENI [2], which uses ORCA [4, 9, 28, 3, 12], a control framework for NSF GENI, to create mutually isolated slices of interconnected infrastructure from multiple independent cloud and network providers, as shown in Figure 1. Each of these cloud services has some level of mechanisms for dy-namic modification.
ExoGENI provides dynamic bandwidth provisioned layer-2 network circuits that are necessary for transferring large amounts of data for data-driven workflows. In addition, Ex-oGENI includes a distributed monitoring facility that uses persistent queries [22] to observe resource utilization and ap-plication performance. The monitoring facility is designed to enable closed-loop feedback control for optimizing and steering future resource provisioning according to the dy-namic demands of the workflow application.
The work presented in this paper evaluates the effects of provisioned network bandwidth on disk I/O for data-driven workflow applications as a step toward developing slice
mod-ification policies based on monitoring feedback. Most
work-flow management systems manage a DAG composed of com-putational tasks that each have a set of input and output files. Often a task’s output files are inputs to subsequent tasks. A significant responsibility of workflow management systems is transferring the data files between compute sites that execute the tasks. Dynamic NIaaS creates the opportu-nity to modify the amount and type of resources the work-flow uses to transfer these files. However, finding the opti-mal amount of resources to allocate is not easy. In the case of data-driven workflows, it is possible to allocate network bandwidth that exceeds the I/O bandwidth capability of a compute resource. In this case, any additional network allo-cation is wasted because it will not reduce the appliallo-cation’s run time. Ideally, it would be possible to allocate precisely the amount of network bandwidth required for the applica-tion. However, the correct amount of bandwidth depends
on the I/O characteristics of the compute host as well as the characteristics of the application.
The paper is organized as follows. In section 2, we discuss network provisioning considerations for data-driven work-flows, and present workflow use cases with a representative data-intensive workflow. In section 3, we present our evalua-tion of the network provisioning consideraevalua-tions on workflow and I/O performance. Section 4 provides more background on ExoGENI, the networked cloud platform used for the ex-periments, and the Pegasus workflow management system. Section 5 presents some related work and section 6 concludes the paper.
2.
DATA-DRIVEN WORKFLOWS
This section describes network provisioning considerations for data-intensive workflows, workflow use cases for dynam-ically provisioned infrastructure, and a representative work-flow application that can benefit from dynamic network pro-visioning.
2.1
Network Provisioning Considerations
One limitation on performance of data-intensive workflows is the ability to stage input and output files quickly. There are two primary bottlenecks for quickly staging files. The more obvious bottleneck is the network bandwidth between the source and destination of the files. Increasing the net-work bandwidth will usually decrease the file staging time. However, the high-bandwidth links provided by dynamic layer-2 circuits can expose a second bottleneck caused by limited disk I/O bandwidth. The disk I/O bottleneck may occur at either end of the transfer but is most often seen when the shared storage node is overloaded with many con-current transfers.
The goal of this work is to find the relationship between provisioned network bandwidth and disk I/O including the saturation points of each. Ideally, we would be able to match the network performance to the I/O performance. Specific
Condor Head Node (handles initial workflow staging)
Add compute nodes for parallel compute intensive step
Workflow
Dynamic Slice
T ime 1. Network intensive workflow staging End workflow
Free unneeded compute nodes after compute step Start workflow
3.
5.
Dynamically provision compute nodes and network for workflow
staging Dynamically destroy
compute nodes and provisioned netowork Dynamically create compute nodes 2.
4.
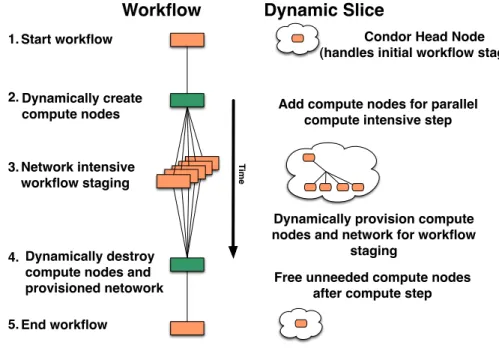
Figure 2: Workflow use case for networked clouds. The left side of the figure depicts the workflow while the
right side depicts the dynamicslice of resources customized to support the application.
goals include evaluating the following:
• Application run time: Effect of network
provision-ing on the run time of data-intensive workflow appli-cations.
• Network bandwidth vs. disk I/O: Effect of
provi-sioned network bandwidth on disk I/O performance.
• Performance isolation: Relationship between
net-work bandwidth, disk I/O, and co-location of virtual machines.
The result of each of these goals is highly dependent on the characteristics of the workflow application and will likely change over time as the workflow progresses through its phases.
2.2
Workflow Use Case
Figure 2 presents a timeline with the workflow in the left column and the state of the elastic slice of resources in the right column. The application represents a common sce-nario in which a workflow must complete several steps in a sequence in order to realize its goal. The workflow has different resource requirements for each step. Multiple steps (in this case step 3) include many tasks that can be executed in parallel. The tasks of step 3 are compute-intensive but require large input files to be staged into the node before execution and output files to be staged out after execution. Ideally, the workflow will dynamically adjust the amount and types of resources that it consumes at each step. For-tunately, most workflows are controlled by a workflow man-agement system. The workflow manman-agement system knows which steps and tasks of the workflow have completed, which are currently executing, and which will be executed next. In many cases, the workflow management system is knowledge-able about the resource requirements of each task.
If a workflow was running in an elastic slice of resources, it is possible to insert additional tasks into the workflow that modify the slice to prepare it for its future tasks. For exam-ple, a workflow could increase the number of compute nodes in order to handle upcoming parallel tasks and release those nodes upon completion of the ensemble. Further, dynamic network provisioning features of ExoGENI enable a work-flow to dynamically add on-demand layer 2 circuits that can be used to stage large input and output files to compute resources.
In the example workflow in Figure 2, the slice initially con-tains a single compute node that runs the HTCondor head node (i.e. it runs the HTCondor scheduler and collector). Step 2 in the workflow completes the HTCondor pool by cre-ating both the additional HTCondor workers that will ac-tually run the computation and the bandwidth provisioned network that will be used to stage the input and output data files. Figure 3 shows a more detailed view of the fully allocated infrastructure. The HTCondor pool uses the ded-icated data plane for its communication. The parallel work is executed in step 3. After completing step 3 and moving the output data to its destination, the workflow releases its compute and network resources.
In this situation the workflow will have the performance of dedicated layer-2 circuit without the cost of a permanent cir-cuit. Further, many workflows require access to several large datasets that are distributed across large geographic areas. The system used here could allow workflows to have tempo-rary high-bandwidth circuits between all necessary datasets and a large number of available compute resources.
In this work, the Pegasus workflow management system, described in section 4.2, was used to plan workflows that execute on HTCondor based systems. The experiments per-formed for this paper involved deploying a complete Condor site within a slice of ExoGENI resources. The HT-Condor site includes one HTHT-Condor scheduler (head node),
eth0
Management Switch br-int
eth0.100
HTCondor Head Node (scheduler, collector) eth0 eth1 tap0 tap1
Data Plane Switch (Bandwidth Provisioned VLANs) eth1 br-eth1.1 eth1.1 Host 1 Virtual Machine eth0 br-int eth0.100 HTCondor Worker (startd) eth0 eth1 tap0 tap1 eth1 br-eth1.1 eth1.1 Host 2 Virtual Machine eth0 br-int eth0.100 HTCondor Worker (startd) eth0 eth1 tap0 tap1 eth1 br-eth1.1 eth1.1 Host 3 Virtual Machine eth0 br-int eth0.100 HTCondor Worker (startd) eth0 eth1 tap0 tap1 eth1 br-eth1.1 eth1.1 Host 4 Virtual Machine eth0 br-int eth0.100 HTCondor Worker (startd) eth0 eth1 tap0 tap1 eth1 br-eth1.1 eth1.1 Host 5 Virtual Machine To OpenStack Head Node
Figure 3: Virtual machines running HTCondor daemons. There is one HTCondor head node that is used
to submit Pegasus workflows. There are many HTCondor worker nodes that execute the computational
workflow tasks.
and several HTCondor workers (HTCondor startd’s). The head node and workers are deployed within virtual machines with a dedicated layer-2 network. The amount of bandwidth allocated to the network is configured for the various exper-iments described in Section 3.
Montage: For the experiments in this paper, we used an
I/O intensive Pegasus based workflow named Montage as a representative data-driven workflow use case. The workflow is based on the widely used Montage [14] astronomy image application developed at NASA’s Infrared Processing and Analysis Center. The Montage workflow is given a region of
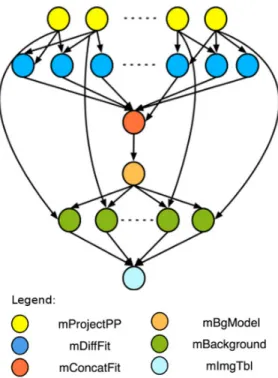
Figure 4: The majority of the Montage workflow tasks and dependencies
the sky for which a mosaic is desired, the size of the mosaic in terms of square degrees, and other parameters such as the mission and band to be used. The input images are first reprojected to the coordinate space of the output mosaic, the reprojected images are then background rectified and finally co-added to create the final output mosaic. Figure 4 shows the majority of the tasks and dependencies in the workflow. Most of these tasks take one or more input images, perform an operation to re-project or combine images, and write an output image. This makes Montage a very I/O intensive workflow.
3.
EVALUATION
Our goal was to evaluate the performance of scientific workflows when deployed on dynamically provisioned net-worked clouds, with particular emphasis on analyzing I/O bottlenecks under different network provisioning configura-tions. The experiments were run using two racks from the ExoGENI NIaaS testbed - a rack at Florida International University (FIU) in Miami, FL, and another rack at NICTA in Sydney, Australia. Details on the hardware and soft-ware configurations for the racks can be found on the Exo-GENI wiki [8]. The evaluations used a representative data-intensive scientific workflow application called Montage, as described in the previous section. Montage was deployed on a virtualized HTCondor environment provisioned dynami-cally from resources on the ExoGENI NIaaS testbed, and managed by the Pegasus workflow manager.
Slices were provisioned from the ExoGENI testbed by sending requests for virtual topologies consisting of a set of virtual machines (vm) connected via a broadcast link with a specified bandwidth. Since Pegasus and Montage use an execution framework based on HTCondor, the request to ExoGENI consisted of a HTCondor head node vm and a specified number of HTCondor worker vms connected by links with desired bandwidths. The virtual machine images had pre-requisite software installed like HTCondor and Pe-gasus. The ExoGENI postboot script feature was leveraged to start various HTCondor daemons on vm startup so that the HTCondor environment is ready to run the workflow as soon as the slice setup is complete. The workflow was run
with 4 and 8 Condor workers. Input data for the runs was scaled according to the number of HTCondor workers.
The Linuxiotoputility [20] was used to monitor the I/O performance for processes running on a vm during the work-flow execution. Theiotop utility was installed on the vir-tual machine images. The monitoring data was analyzed offline post-execution. Theiotoptool provides current I/O usage by processes or threads on the system - the observed read and write bandwidth for a process during the specified sampling period. The default sampling period of 1 second was used for the experiments. iotopalso provides the per-centage of time a particular process or thread spends while waiting on I/O during the same sampling period. We re-fer to this metric as percent_io_wait. percent_io_wait
provides a measure of I/O bottlenecks in the system with highpercent_io_waitindicating that the process is spend-ing most of it’s time performspend-ing I/O. Workflow execution statistics were collected using thepegasus-statistics util-ity, and the slice resource details were obtained from Exo-GENI slice manifests.
Data was collected at both HTCondor head node vm and HTCondor worker vms. For the purpose of our evaluation, thecondorio mode was used for files. In condorio mode, input data to the HTCondor workers is sent from the HT-Condor head node for each workflow step, and output data for each step from the HTCondor workers is sent back to the HTCondor head node over the network. The HTCondor head node and worker vms use their local disks for reading and writing files. Hence, in this setup, the I/O performance on the HTCondor head node is more important, and we present performance results for the HTCondor head node. Execution of Montage goes through several phases of high I/O activities interspersed by computational tasks.
0 100 300 500 900 2000 4000 6000 1000 2000 3000 4000 5000 6000 7000
Provisioned network bandwidth (Mb/s)
Total workflow execution time (sec)
Workflow execution time vs. Provisioned bandwidth HTCondor head node with 8 HTCondor workers
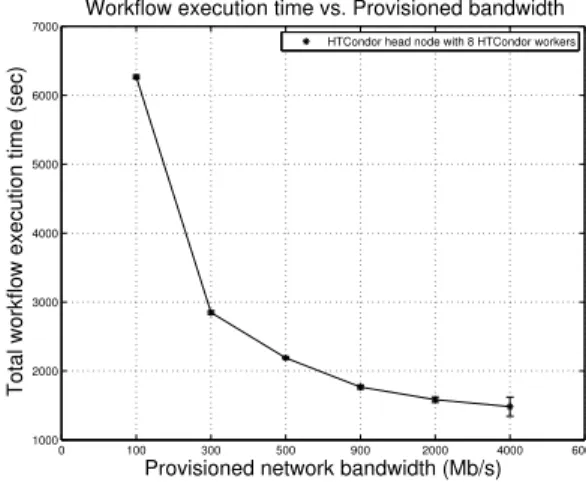
Figure 5: Workflow execution time vs. provisioned network bandwidth (FIU rack)
3.1
Results
Effect of provisioned bandwidth on execution time
Figure 5 shows results of executing Montage workflow on the FIU rack with 8 HTCondor workers. The total workflow execution time is plotted against the provisioned network bandwidth between the HTCondor worker vms and the
HT-Condor head node vm. Each point represents an average of 4 runs with error bars representing the variability across the runs. The results show that the workflow execution time decreases with increasing provisioned network bandwidth. There is a factor of 4 improvement in total execution time when provisioned bandwidth increases from 100 Mb/s to 2000 Mb/s. It is also observed that the marginal benefit reduces as the network bandwidth allocation increases to about 2000 Mb/s. For example, increasing the provisioned bandwidth to 4000 Mb/s (i.e. doubling the bandwidth) re-sults in only about 6% improvement in total execution time.
Effect of provisioned network bandwidth on I/O
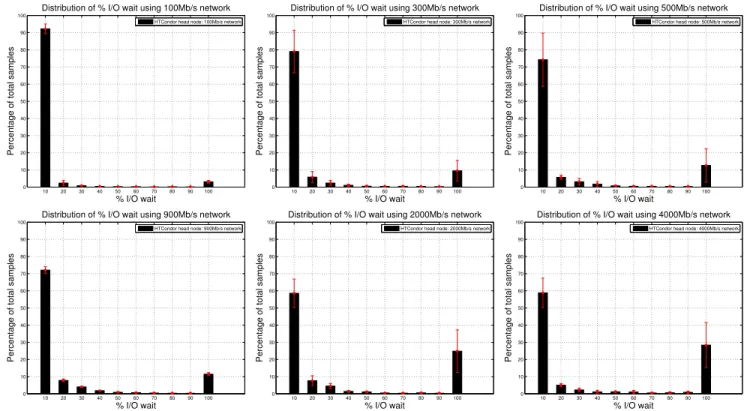
Figure 6 plots the histograms of averagepercent_io_wait
distributions for different bandwidths - 100 Mb/s, 300 Mb/s, 500 Mb/s, 900 Mb/s, 2000 Mb/s, and 4000 Mb/s at the FIU rack. Each sub-figure shows the histogram distribu-tion for a specific bandwidth. The x-axis of each sub-figure represents the quantiles ofpercent_io_wait,<10%,<20%, and so on. The y-axis represents the average percentage of samples that belong to a specific quantile. Each his-togram includes an error bar representing the variability of observed data across 4 runs. The iotop utility was used to collect thepercent_io_waitprofile for processes during each workflow run. The results show that at lower band-widths, the percentage of samples for highpercent_io_wait
is very small, and most processes during the runs had very lowpercent_io_wait, implying absence of I/O bottlenecks. As the provisioned bandwidth increases, the percentage of samples with high percent_io_wait increases. The effect is more pronounced at and beyond 2000 Mb/s, when about 30% of the samples exhibit percent_io_wait between 90-100%. This implies that at higher bandwidths, processes are increasingly spending more time waiting on I/O. Be-yond this inflection bandwidth, there is saturation in disk I/O, and network I/O is no longer the bottleneck.
Figure 7 plots the observed disk read/write bandwidth for different provisioned bandwidths - 100 Mb/s through 4000 Mb/s at the FIU rack. Each sub-figure shows the scatterplot for a specific bandwidth. The x-axis represents the execu-tion progress in seconds. The observed read/write band-width is plotted on the y-axis for each point of time in the execution period. During the workflow execution there are various phases of read and write activities. The observed I/O throughput is lower for lower provisioned bandwidths because there is not enough data sent on the network to exercise the entire disk I/O bandwidth available. The re-sults show that the I/O throughput increases by increas-ing the provisioned bandwidth, and this results in shorter durations of read and write phases. Beyond the inflection point, the I/O bandwidth doesn’t increase proportionally with increase in provisioned bandwidth because the disk I/O is gradually getting saturated, as evident from increased
percent_io_waitin the previous graphs.
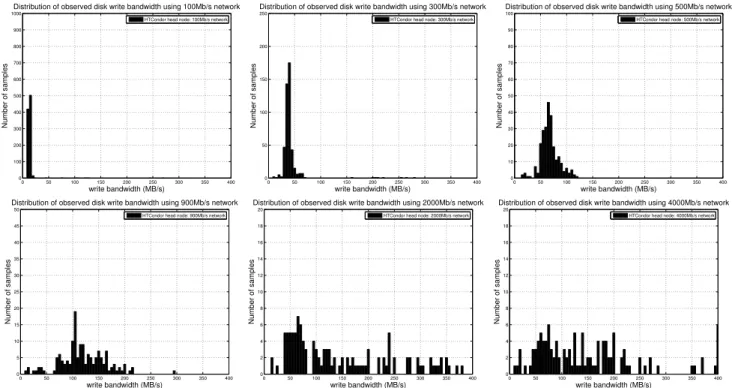
Figure 8 presents the histograms of write throughput dis-tribution. Histogram bars for observed write bandwidth less than 10 Mb/s have been excluded because these samples cor-respond to compute intensive phases. It is observed that the number of samples with higher write throughput increases with increase in provisioned bandwidth initially. At 2000 Mb/s and beyond, the processes experience higher band-widths when they are not waiting on disk I/O, but they also experience lower bandwidths when they are waiting on I/O.
10 20 30 40 50 60 70 80 90 100 0 10 20 30 40 50 60 70 80 90 100 % I/O wait
Percentage of total samples
Distribution of % I/O wait using 100Mb/s network HTCondor head node: 100Mb/s network
10 20 30 40 50 60 70 80 90 100 0 10 20 30 40 50 60 70 80 90 100 % I/O wait
Percentage of total samples
Distribution of % I/O wait using 300Mb/s network HTCondor head node: 300Mb/s network
10 20 30 40 50 60 70 80 90 100 0 10 20 30 40 50 60 70 80 90 100 % I/O wait
Percentage of total samples
Distribution of % I/O wait using 500Mb/s network HTCondor head node: 500Mb/s network
10 20 30 40 50 60 70 80 90 100 0 10 20 30 40 50 60 70 80 90 100 % I/O wait
Percentage of total samples
Distribution of % I/O wait using 900Mb/s network HTCondor head node: 900Mb/s network
10 20 30 40 50 60 70 80 90 100 0 10 20 30 40 50 60 70 80 90 100 % I/O wait
Percentage of total samples
Distribution of % I/O wait using 2000Mb/s network HTCondor head node: 2000Mb/s network
10 20 30 40 50 60 70 80 90 100 0 10 20 30 40 50 60 70 80 90 100 % I/O wait
Percentage of total samples
Distribution of % I/O wait using 4000Mb/s network HTCondor head node: 4000Mb/s network
Figure 6: Percent I/O wait distributions for different provisioned bandwidths
0 1000 2000 3000 4000 5000 6000 7000 0 5 10 15 20 25 30 35 40 45 50
Execution time (secs)
write/read bandwidth (MB/s)
Observed I/O bandwidth with 100Mb/s network HTCondor head node vm : Write HTCondor head node vm : Read
0 500 1000 1500 2000 2500 3000 0
50 100 150
Execution time (secs)
write/read bandwidth (MB/s)
Observed I/O bandwidth with 300Mb/s network
HTCondor head node vm : Write HTCondor head node vm : Read
0 500 1000 1500 2000 2500 0 50 100 150 200 250
Execution time (secs)
write/read bandwidth (MB/s)
Observed I/O bandwidth with 500Mb/s network HTCondor head node vm : Write HTCondor head node vm : Read
0 200 400 600 800 1000 1200 1400 1600 1800 2000 0 50 100 150 200 250 300
Execution time (secs)
write/read bandwidth (MB/s)
Observed I/O bandwidth with 900Mb/s network HTCondor head node vm : Write HTCondor head node vm : Read
0 200 400 600 800 1000 1200 1400 1600 0 50 100 150 200 250 300 350
Execution time (secs)
write/read bandwidth (MB/s)
Observed I/O bandwidth with 2000Mb/s network HTCondor head node vm : Write HTCondor head node vm : Read
0 500 1000 1500 0 50 100 150 200 250 300 350
Execution time (secs)
write/read bandwidth (MB/s)
Observed I/O bandwidth with 4000Mb/s network HTCondor head node vm : Write HTCondor head node vm : Read
Figure 7: Observed I/O bandwidth for different provisioned network bandwidths
This results in histograms scattered over the entire range of write bandwidth values.
The results of the above experiments show the effect of
modifying provisioned network bandwidth on I/O throughput and workflow execution time. The marginal benefit as per-ceived by the workflow reduces as the network bandwidth
al-0 50 100 150 200 250 300 350 400 0 100 200 300 400 500 600 700 800 900 1000 write bandwidth (MB/s) Number of samples
Distribution of observed disk write bandwidth using 100Mb/s network HTCondor head node: 100Mb/s network
0 50 100 150 200 250 300 350 400 0 50 100 150 200 250 write bandwidth (MB/s) Number of samples
Distribution of observed disk write bandwidth using 300Mb/s network HTCondor head node: 300Mb/s network
0 50 100 150 200 250 300 350 400 0 10 20 30 40 50 60 70 80 90 100 write bandwidth (MB/s) Number of samples
Distribution of observed disk write bandwidth using 500Mb/s network HTCondor head node: 500Mb/s network
0 50 100 150 200 250 300 350 400 0 5 10 15 20 25 30 35 40 45 50 write bandwidth (MB/s) Number of samples
Distribution of observed disk write bandwidth using 900Mb/s network HTCondor head node: 900Mb/s network
0 50 100 150 200 250 300 350 400 0 2 4 6 8 10 12 14 16 18 20 write bandwidth (MB/s) Number of samples
Distribution of observed disk write bandwidth using 2000Mb/s network
HTCondor head node: 2000Mb/s network
0 50 100 150 200 250 300 350 400 0 2 4 6 8 10 12 14 16 18 20 write bandwidth (MB/s) Number of samples
Distribution of observed disk write bandwidth using 4000Mb/s network
HTCondor head node: 4000Mb/s network
Figure 8: Distribution of observed write bandwidth for different network bandwidths
location increases to a point where disk I/O saturates. There is little or no benefit from increasing network bandwidth
be-yond this inflection point. A sustained percent_io_wait
value greater than 90% indicates I/O saturation and slice modification policies should not increase provisioned band-width beyond the inflection point.
0 100 200 300 400 500 700 900 1000 2000 2500 3000 3500 4000 4500 5000 5500 6000 6500 7000
Provisioned network bandwidth (Mb/s)
Total workflow execution time (sec)
Workflow execution time vs. Provisioned bandwidth
Default OpenStack assignment: mean Default OpenStack assignment: error
HTCondor head node on separate OpenStack worker: mean HTCondor head node on separate OpenStack worker: error
Figure 9: Workflow execution time vs. provisioned network bandwidth (NICTA rack)
The previous experiments were conducted on the FIU Ex-oGENI rack where there might have been other users using the rack and running experiments on their vms at the same time as the experiments. It was desired to run our experi-ments in a controlled environment where there would be no performance interference from vms from other users. For
this purpose, experiments were run on an ExoGENI rack at NICTA. Exclusive access to the rack was obtained for running the experiments. The NICTA rack has fewer total OpenStack workers. It also has fewer cores (12 instead of 16) and memory (48G instead of 64G) on each OpenStack worker node. The network switch was also 1Gbps instead of 10Gbps at FIU.
Effect of performance isolation
The Montage workflow was run on the NICTA rack with 4 HTCondor workers. Two configurations of the HTCon-dor head node and HTConHTCon-dor worker vms were used. In the first configuration, the default OpenStack assignment of vms to the OpenStack workers was used. In this case, the HTCondor head node vm can be mapped to the same OpenStack worker node as another HTCondor worker vm. This is referred to as the default case. In the second con-figuration, the HTCondor head node vm was mapped to an OpenStack worker different from any of the HTCondor worker vms. This is referred to as theisolatedcase.
Figure 9 shows the results of executing Montage work-flow for thedefault and isolatedcases. The total workflow execution time is plotted against the provisioned network bandwidth between the HTCondor worker vms and the HT-Condor head node vm. Each point represents an average of 4 runs with error bars representing the variability across the runs. The black line represents the default case and the red line represents theisolatedcase. It is observed that for both the cases the workflow execution time decreases with increasing provisioned network bandwidth. As previ-ously observed, the marginal benefit decreases with higher bandwidth allocation. Since the network switch in this rack was limited to 1Gbps, experiments could not be run with
10 20 30 40 50 60 70 80 90 100 0 10 20 30 40 50 60 70 80 90 100 % I/O wait
Percentage of total samples
Distribution of % I/O wait using 100Mb/s network HTCondor head node with default OpenStack assignment
10 20 30 40 50 60 70 80 90 100 0 10 20 30 40 50 60 70 80 90 100 % I/O wait
Percentage of total samples
Distribution of % I/O wait using 300Mb/s network HTCondor head node with default OpenStack assignment
10 20 30 40 50 60 70 80 90 100 0 10 20 30 40 50 60 70 80 90 100 % I/O wait
Percentage of total samples
Distribution of % I/O wait using 500Mb/s network HTCondor head node with default OpenStack assignment
10 20 30 40 50 60 70 80 90 100 0 10 20 30 40 50 60 70 80 90 100 % I/O wait
Percentage of total samples
Distribution of % I/O wait using 900Mb/s network HTCondor head node with default OpenStack assignment
Figure 10: % I/O wait distributions for different bandwidths: Default OpenStack assignment
10 20 30 40 50 60 70 80 90 100 0 10 20 30 40 50 60 70 80 90 100 % I/O wait
Percentage of total samples
Distribution of % I/O wait using 100Mb/s network HTCondor head node on different OpenStack worker
10 20 30 40 50 60 70 80 90 100 0 10 20 30 40 50 60 70 80 90 100 % I/O wait
Percentage of total samples
Distribution of % I/O wait using 300Mb/s network HTCondor head node on different OpenStack worker
10 20 30 40 50 60 70 80 90 100 0 10 20 30 40 50 60 70 80 90 100 % I/O wait
Percentage of total samples
Distribution of % I/O wait using 500Mb/s network HTCondor head node on different OpenStack worker
10 20 30 40 50 60 70 80 90 100 0 10 20 30 40 50 60 70 80 90 100 % I/O wait
Percentage of total samples
Distribution of % I/O wait using 900Mb/s network HTCondor head node on different OpenStack worker
Figure 11: % I/O wait distributions for different bandwidths: HTCondor head node on separate OpenStack worker
higher values of provisioned bandwidths. This graph also shows that if there are no interfering vms in the same Open-Stack worker, the total execution time is less than when there might be interfering vms. The average execution time for the isolatedcase is between 8.75% to 12.35% less than
thedefaultcase for provisioned bandwidths greater than 300
Mb/s. Thedefaultcase also has much higher variability in execution times as shown by the error bars. This underscores the importance of I/O performance isolation in virtualized environments.
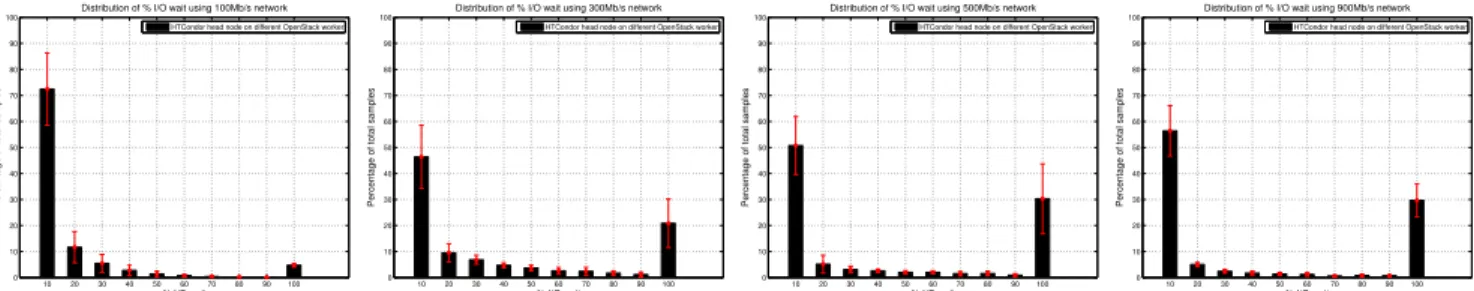
Figures 10 and 11 plot the histograms ofpercent_io_wait
distributions for different bandwidths - 100 Mb/s, 300 Mb/s, 500 Mb/s, and 900 Mb/s for thedefault andisolatedcases respectively. Each sub-figure shows the histogram distribu-tion for a specific bandwidth. The x-axis of each sub-figure represents the quantiles ofpercent_io_wait,<10%,<20%, and so on. The y-axis represents the average percentage of samples that belong to a specific quantile. Each histogram includes error bars representing the variability of observed data across 4 runs. We observe that for higher bandwidths (300Mb/s and beyond), the percentage of samples with high
percent_io_waitis more in thedefaultcase than in the
iso-latedcase. This implies that the interference of I/O
activ-ity from co-located vms, even from the same application, can impact I/O performance at higher allocated network bandwidths. Theisolatedcase has more consistent and pre-dictable performance because of absence of interference from other co-located vms. This shows that data-intensive appli-cations like Montage can be affected negatively without I/O performance isolation in virtualized environments. These results underscore the importance of network and I/O
per-formance isolation for predictable application perper-formance,
and are applicable for general data-intensive workloads.
4.
BACKGROUND
4.1
ExoGENI
ExoGENI is a new GENI testbed that links GENI to two advances in virtual infrastructure services outside of GENI: cloud computing and dynamic circuit fabrics. ExoGENI or-chestrates a federation of independent cloud sites located across the US and circuit providers, like NLR and Internet2, through their native IaaS API interfaces, and links them to other GENI tools and resources.
ExoGENI is, in effect, a widely distributed networked infrastructure-as-a-service (NIaaS) platform geared towards experimentation and computational tasks. ExoGENI em-ploys sophisticated topology embedding algorithms that take advantage of semantic resource descriptions using NDL-OWL – a variant of Network Description Language.
Individual ExoGENI deployments consist of cloud site
racks on host campuses, linked with national research
net-works through programmable exchange points. Virtual com-pute, storage, and network resources are stitched together to form mutually isolated slices. Compute and storage re-sources are obtained from private clouds at the infrastruc-ture’s edge. Network resources are obtained from both edge providers and national fabrics using traditional VLAN-based switching and OpenFlow. Using ORCA (Open Resource Control Architecture) control framework software, ExoGENI offers a powerful unified hosting platform for deeply net-worked, multi-domain, multi-site cloud applications.
What sets ExoGENI apart from most cloud systems is its ability to allocate bandwidth-provisioned dedicated layer-2 private networks between compute resources (virtual and physical machines) residing on independent cloud sites. In the context of data-driven scientific workflows, these dedi-cated layer-2 networks enable fast transfer of data files
be-tween computational tasks.
4.2
Pegasus Workflow Management System
The Pegasus Workflow Management System [6] is used by scientists to execute large-scale computational workflows on a variety of cyberinfrastructure, ranging from local desk-tops to campus clusters, grids, and commercial and academic clouds. Pegasus WMS enables scientists to compose abstract workflows without worrying about the details of the underly-ing execution environment or the particulars of the low-level specifications required by the middleware. This mapping is done by supplying the abstract workflow, a list of available software (transformation catalog), a list of input files (replica catalog), and a description of available execution environ-ments (site catalog) to the Pegasus planner. The output of the planning step is an executable workflow, which includes workflow transforms such as optimization and added data management tasks.
5.
RELATED WORK
There has been considerable work [15, 16, 5] on investi-gating the effectiveness and applicability of IaaS cloud plat-forms for executing scientific workflows. Existing workflow engines like Pegasus and Kepler have features [31, 32] that can leverage Amazon EC2 and other cloud platforms for run-ning workflow steps. Researchers have also done cost and performance evaluation of scientific workflows on clouds [21, 17]. There is also existing work on performance analysis and evaluation of cloud infrastructures for scientific com-puting [26, 11, 13, 30, 18]. In our previous work [23], we have evaluated provisioning network bandwidth for Hadoop workloads in multi-domain networked cloud environments. However, none of the exiting research has evaluated both network and IaaS aspects for workflows in dynamically pro-visioned networked cloud environments. Our work is unique in that respect.
Ghoshal et. al [10] studied I/O performance of HPC appli-cations on virtualized cloud environments. There has been studies on I/O performance isolation issues in cloud envi-ronments [27, 29], and work on policies for fair-share of I/O in multi-tenant clouds [19]. Our work identifies similar I/O performance isolation issues, but in addition, investigates the effects of bandwidth provisioning on I/O performance isolation.
6.
CONCLUSIONS
In this paper, we presented performance evaluation of a representative data-intensive scientific application workflow on dynamically provisioned resources from the ExoGENI NI-aaS testbed. In particular, we measured and analyzed the effect of provisioned network bandwidth on overall workflow execution time and I/O performance when using a virtual-ized HTCondor execution environment dynamically set up for workflow execution. The results of our experiments show that the marginal benefit as perceived by the workflow re-duces as the network bandwidth allocation increases to a point where disk I/O saturates. We identified an inflec-tion point for provisioned bandwidth, beyond which there is little or no benefit from increasing provisioned network bandwidth. Our results also underscore the importance of network and I/O performance isolation for predictable appli-cation performance. We show the effect of interfering virtual
machines on overall workflow execution time and I/O wait times experienced by the application.
One of our future goals is to use real-time monitoring data on I/O and network performance during workflow execution to enable steering of applications and run-time modification of provisioned infrastructure. This would enable closed-loop feedback control. For example, we could dynamically change the provisioned bandwidth on the links between the vms depending on the bottlenecks observed. We would dynam-ically increase the bandwidth until the inflection point and release excess bandwidth when the data load is low. Moni-toring these metrics would also be useful to migrate vms to different OpenStack workers when performance interference exceeds acceptable thresholds. This work is also applicable for workflow and ensemble planning so that data movements can be planned and optimized based on performance feed-back.
7.
ACKNOWLEDGMENTS
Work for this paper was supported by the NSF CC-NIE ADAMANT project (NSF ACI 1245926), DoE DROPS project (ASCR DE-SC0005286), DoE SciDAC SUPER (DE-FG02-11ER26050/DE-SC0006925) project, NSF SDCI Missing Link project (NSF ACI 1032573), and the NSF GENI project (GENI Project Office Award #1872).
8.
REFERENCES
[1] Amazon Elastic Compute Cloud (Amazon EC2).
http://www.amazon.com/ec2.
[2] I. Baldine, Y. Xin, A. Mandal, P. Ruth, A. Yumerefendi, and J. Chase. Exogeni: A
multi-domain infrastructure-as-a-service testbed. In
8th International ICST Conference on Testbeds and Research Infrastructures for the Development of
Networks and Communities (TRIDENTCOM 2012),
2012.
[3] J. Chase, L.Grit, D.Irwin, V.Marupadi, P.Shivam, and A.Yumerefendi. Beyond virtual data centers: Toward an open resource control architecture. InSelected Papers from the International Conference on the
Virtual Computing Initiative (ACM Digital Library),
May 2007.
[4] J. S. Chase, D. E. Irwin, L. E. Grit, J. D. Moore, and S. E. Sprenkle. Dynamic Virtual Clusters in a Grid Site Manager. InProceedings of the Twelfth International Symposium on High Performance
Distributed Computing (HPDC), June 2003.
[5] E. Deelman, G. Juve, M. Malawski, and J. Nabrzyski. Hosted science: Managing computational workflows in the cloud.Parallel Processing Letters, 23(2), 2013. [6] E. Deelman, G. Singh, M.-H. Su, J. Blythe, Y. Gil,
C. Kesselman, G. Mehta, K. Vahi, G. B. Berriman, J. Good, et al. Pegasus: A framework for mapping complex scientific workflows onto distributed systems.
Scientific Programming, 13(3):219–237, 2005.
[7] Eucalyptus Systems.http://www.eucalyptus.com/. [8] ExoGENI Wiki.http://wiki.exogeni.net.
[9] Y. Fu, J. Chase, B. Chun, S. Schwab, and A. Vahdat. SHARP: An Architecture for Secure Resource Peering.
InProceedings of the 19th ACM Symposium on
[10] D. Ghoshal, R. S. Canon, and L. Ramakrishnan. I/o performance of virtualized cloud environments. In
Proceedings of the second international workshop on
Data intensive computing in the clouds, DataCloud-SC
’11, pages 71–80, New York, NY, USA, 2011. ACM. [11] A. Iosup, S. Ostermann, N. Yigitbasi, R. Prodan,
T. Fahringer, and D. Epema. Performance analysis of cloud computing services for many-tasks scientific computing.IEEE Trans. Parallel Distrib. Syst., 22(6):931–945, June 2011.
[12] D. Irwin, J. S. Chase, L. Grit, A. Yumerefendi, D. Becker, and K. G. Yocum. Sharing Networked Resources with Brokered Leases. InProceedings of the
USENIX Technical Conference, June 2006.
[13] K. Jackson, L. Ramakrishnan, K. Muriki, S. Canon, S. Cholia, J. Shalf, H. J. Wasserman, and N. Wright. Performance analysis of high performance computing applications on the amazon web services cloud. In
Cloud Computing Technology and Science (CloudCom), 2010 IEEE Second International
Conference on, pages 159–168, 2010.
[14] J. C. Jacob, D. S. Katz, G. B. Berriman, J. C. Good, A. C. Laity, E. Deelman, C. Kesselman, G. Singh, M. Su, T. A. Prince, and R. Williams. Montage a grid portal and software toolkit for science grade
astronomical image mosaicking.Int. J. Comput. Sci. Eng., 4(2):73–87, July 2009.
[15] G. Juve and E. Deelman. Scientific workflows and clouds.Crossroads, 16(3):14–18, Mar. 2010.
[16] G. Juve and E. Deelman. Scientific workflows in the cloud. In M. Cafaro and G. Aloisio, editors,Grids,
Clouds and Virtualization, Computer Communications
and Networks, pages 71–91. Springer London, 2011. [17] G. Juve, E. Deelman, G. B. Berriman, B. P. Berman,
and P. Maechling. An evaluation of the cost and performance of scientific workflows on amazon ec2.J.
Grid Comput., 10(1):5–21, 2012.
[18] Z. Li, L. O’Brien, H. Zhang, and R. Cai. A factor framework for experimental design for performance evaluation of commercial cloud services. InCloudCom, pages 169–176. IEEE, 2012.
[19] X. Lin, Y. Mao, F. Li, and R. Ricci. Towards fair sharing of block storage in a multi-tenant cloud. In
Proceedings of the 4th USENIX conference on Hot
Topics in Cloud Ccomputing, HotCloud’12, pages
15–15, Berkeley, CA, USA, 2012. USENIX Association.
[20] Linux iotop.http://guichaz.free.fr/iotop/. [21] M. Malawski, G. Juve, E. Deelman, and J. Nabrzyski.
Cost- and deadline-constrained provisioning for scientific workflow ensembles in iaas clouds. In
Proceedings of the International Conference on High Performance Computing, Networking, Storage and
Analysis, SC ’12, pages 22:1–22:11, Los Alamitos, CA,
USA, 2012. IEEE Computer Society Press. [22] A. Mandal, I. Baldine, Y. Xin, P. Ruth, and
C. Heerman. Enabling persistent queries for cross-aggregate performance monitoring. Technical Report TR-13-01, Renaissance Computing Institute, 2013,
http://www.renci.org/wp-content/uploads/2013/04/TR-13-01.pdf.
[23] A. Mandal, Y. Xin, I. Baldine, P. Ruth, C. Heerman,
J. Chase, V. Orlikowski, and A. Yumerefendi. Provisioning and evaluating multi-domain networked clouds for hadoop-based applications. InCloud Computing Technology and Science (CloudCom), 2011
IEEE Third International Conference on, pages
690–697, 2011.
[24] D. Milojicic, I. M. Llorente, and R. S. Montero. Opennebula: A cloud management tool.IEEE
Internet Computing, 15(2):11–14, 2011.
[25] OpenStack Cloud Software.http://openstack.org. [26] S. Ostermann, A. Iosup, N. Yigitbasi, R. Prodan,
T. Fahringer, and D. H. J. Epema. A performance analysis of ec2 cloud computing services for scientific computing. In D. R. Avresky, M. Diaz, A. Bode, B. Ciciani, and E. Dekel, editors,CloudComp, volume 34 ofLecture Notes of the Institute for Computer Sciences, Social Informatics and
Telecommunications Engineering, pages 115–131.
Springer, 2009.
[27] X. Pu, L. Liu, Y. Mei, S. Sivathanu, Y. Koh, and C. Pu. Understanding performance interference of i/o workload in virtualized cloud environments. In
Proceedings of the 2010 IEEE 3rd International
Conference on Cloud Computing, CLOUD ’10, pages
51–58, Washington, DC, USA, 2010. IEEE Computer Society.
[28] L. Ramakrishnan, L. Grit, A. Iamnitchi, D. Irwin, A. Yumerefendi, and J. Chase. Toward a Doctrine of Containment: Grid Hosting with Adaptive Resource Control. InSupercomputing (SC06), November 2006. [29] J. Shafer. I/o virtualization bottlenecks in cloud
computing today. InProceedings of the 2nd conference
on I/O virtualization, WIOV’10, pages 5–5, Berkeley,
CA, USA, 2010. USENIX Association.
[30] R. Tudoran, A. Costan, G. Antoniu, and L. Boug´e. A performance evaluation of azure and nimbus clouds for scientific applications. InProceedings of the 2nd International Workshop on Cloud Computing
Platforms, CloudCP ’12, pages 4:1–4:6, New York,
NY, USA, 2012. ACM.
[31] J.-S. V¨ockler, G. Juve, E. Deelman, M. Rynge, and B. Berriman. Experiences using cloud computing for a scientific workflow application. InProceedings of the 2nd international workshop on Scientific cloud
computing, ScienceCloud ’11, pages 15–24, New York,
NY, USA, 2011. ACM.
[32] J. Wang and I. Altintas. Early cloud experiences with the kepler scientific workflow system.Procedia