MACHINE LEARNING AND
AUTONOMOUS SYSTEM FOR HUMAN
GAIT ANALYSIS BASED ON WALK SPEED
Abdulhakim Elkurdi
School of Computing, Science and Engineering
University of Salford, Manchester, UK
Submitted in Partial Fulfilment of the Requirement of the
Degree of Doctor of Philosophy, Jan 2020
i
TABLE OF CONTENTS
TABLE OF CONTENTS ... i LIST OF FIGURES ... v LIST OF TABLES ... ix LIST OF ABBREVIATIONS ... xi ACKNOWLEDGEMENT ... xiii ABSTRACT ... xiv1. INTRODUCTION AND MOTIVATION ... 1
1.1 Introduction ... 1
1.2 Research Motivation ... 2
1.3 Research Scope ... 5
1.4 Research Question ... 6
1.5 Research Aim and Objectives ... 6
1.6 Proposed Methods ... 7
1.7 Research Contribution ... 8
1.8 Thesis Structure ... 8
2. THE EFFECTS OF WALKING SPEED ON GAIT PARAMETERS... 10
2.1 Introduction ... 10
2.2 Gait Parameters Changes due to Walking Speeds ... 10
2.2.1 Timed Get Up and Go (TUG) ... 11
2.2.2 Timed 25-foot walk (T25FW) ... 12
2.2.3 Multiple Sclerosis Walking Scale (Rating Scales) ... 13
2.3 Residential Care for Elderly People ... 14
2.4 Sensor Technologies ... 16
2.4.1 Non-vision-based Tracking System ... 16
2.4.2 Vision Based Tracking System ... 16
ii
2.4.4 Gait Analysis using Microsoft Kinect Sensor ... 19
2.5 Summary ... 20
3. LITERATURE REVIEW ... 22
3.1 Introduction ... 22
3.2 Skeletal Data Collection ... 23
3.3 Smoothing and Filtering Data Techniques ... 24
3.3.1 Moving Average Filter ... 24
3.3.2 Exponential Moving Average Filters ... 25
3.3.3 Median Filter ... 25
3.3.4 Savitzky–Golay Filter ... 25
3.3.5 Local Regression Filter ... 26
3.3.6 Kalman Filter ... 27
3.4 Gait Cycle Determination... 28
3.5 Gait Features Extraction ... 29
3.5.1 Spatiotemporal Gait Analysis ... 30
3.5.2 Kinematic Gait Parameters ... 31
3.6 Gait Features Reduction ... 32
3.6.1 Principal Component Analysis ... 32
3.7 Data Classification Techniques ... 33
3.7.1 Decision Tree ... 34
3.7.2 Support Vector Machine Approach ... 35
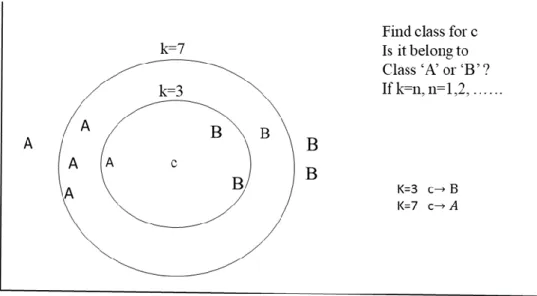
3.7.3 k-Nearest Neighbour Approach ... 36
3.7.4 Discriminant Analysis Classification ... 38
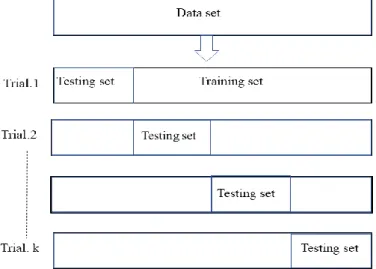
3.8 Cross validation technique ... 39
3.8.1 Holdout Method ... 39
3.8.2 Leave-P-Out Cross Validation ... 40
iii
3.9 System performance evaluation ... 41
3.9.1 Receiver Operating Characteristics... 42
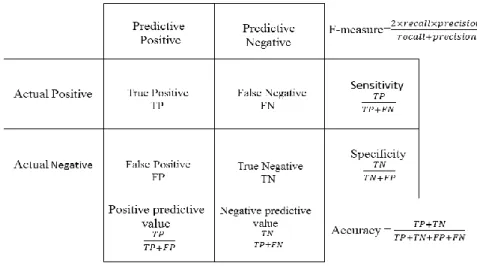
3.9.2 Confusion Matrix ... 43
3.10 Summary ... 45
4. RESEARCH METHODS AND PROPOSED TECHNIQUES ... 47
4.1 Introduction ... 47
4.2 Instruments and Data Acquisition ... 47
4.2.1 Kinect Camera View ... 48
4.3 Framework and Proposed Approaches ... 50
4.3.1 Skeletal Data Smoothing and Filtering ... 51
4.3.2 Gait Cycle Determination ... 55
4.3.3 Features Extraction ... 55
4.3.4 Gait Features Reduction ... 64
4.3.5 Gait Data Classification ... 67
4.3.6 K-Fold Cross Validation ... 74
4.3.7 System Evaluation ... 75
4.4 Summary ... 78
5. EXPERIMENTAL RESULTS OF IMPLEMENTED SYSTEM AND DISCUSSION .. 80
5.1 Introduction ... 80
5.2 The Proposed System AM/CE ... 80
5.3 Experiment 1- Skeleton Data Smoothing Techniques ... 81
5.3.1 Original data... 81
5.3.2 Filtered data ... 82
5.4 Experiment 2- Kinect camera validation ... 89
5.4.1 Forward walk to the Kinect camera view ... 89
5.4.2 Parallel walk to the Kinect camera view ... 90
iv
5.6 Experiment 4- Gait features extraction ... 92
5.6.1 Spatiotemporal gait analysis ... 93
5.6.2 Proposed method (Amplitude Modulation) ... 95
5.7 Experiment 5- AM&FM Gait Features Extraction ... 98
5.8 Experiment 6- Gait Features Classification ... 99
5.8.1 AM/CE System Implementation ... 100
5.9 AM/CE System Performance ... 106
5.10 Summary ... 107
6. CONCLUSIONS AND FUTURE WORK ... 110
6.1 Research Aim and Scope... 110
6.2 Research Objectives Definition ... 111
6.3 Contributions of the Research ... 113
6.4 Research Limitations ... 113 6.5 Future work ... 114 6.6 Summary ... 115 REFERENCES ... 116 APPENDICES ... 133 Appendix-A ... 133 Appendix -B ... 136 Appendix C ... 138 Appendix D ... 143 PUBLICATIONS ... 165
v
LIST OF FIGURES
Figure 1.1: UK Population of the Elderly from 1974 - 2014 (Source: UK National Archives).
... 2
Figure 1.2: The UK Expenditure on Health Care for People over 65 (Source: UK Public Spending) ... 3
Figure 1.3: Quality of Life VS Cost of Care (Source: MacIntosh et al., 2014). ... 4
Figure 2.1: Timed-Up & Go Test ... 12
Figure 2.2: Timed 25-Foot Walking ... 13
Figure 2.3: The Main Components of Microsoft Kinect ... 17
Figure 2.4: Human Body Joints: (a) Skeleton of Human Body (b) Hierarchal Human Body Joints ... 18
Figure 3.1: One Complete Gait Cycle that is Determined between 2 Strike Heels for the Same Foot, and Generally a Composite of 2 Phases; the Stance Phase and Swing Phase 60/ 40% of a Gait Cycle Period, Respectively. ... 29
Figure 3.2: The Vertical Displacement of the Spine-Base during a Walk Process. [Source: Kinesiology Scientific Basis of Human Motion, 12th Edition by Hamilton, Luttgens & Weimar (1991)]... 29
Figure 3.3: Decision tree construction ... 34
Figure 3.4: Possible Hyperplane in SVM Algorithm ... 35
Figure 3.5: The Principle Work of k-NN Approach ... 37
Figure 3.6: Holdout Method for Single-Training/Testing Sets ... 39
Figure 3.7: Leave One Out Cross Validation... 40
Figure 3.8: k-Fold Cross Validation ... 41
Figure 3.9: Three ROC Curves that Correspond (Right Side) to Overlapping Distributions (Left Side) (Source: Schwartz, 2012) ... 43
Figure 3.10: Confusion Matrix for Two Classes with Some Measures ... 44
Figure 4.1: Kinect v2 camera view (a) horizontal view (b) vertical view ... 48
Figure 4.2: Horizontal Angle View of Kinect Camera v2 ... 49
Figure 4.3: Vertical Angle View of Kinect Camera v2 ... 50
Figure 4.4: General Block Diagram of a Human Gait Analysis with Six Stages ... 50
Figure 4.5: The Relationship between Distance, Velocity and Acceleration ... 58
Figure 4.6: Displacement-Time Graph ... 58
vi
Figure 4.8: Amplitude Modulation Signal in Time Domain... 59
Figure 4.9: AM-Signal Spectrum Contains Three Components ... 60
Figure 4.10: Frequency Modulation Signal in Time Domain ... 62
Figure 4.11: Spectrum Range in FM-NB Modulated Signal ... 64
Figure 4.12: The (2 1 3) Convolutional Encoder with Code Rate 1/2 ... 69
Figure 4.13: The State Diagram of the ½ Rate Convolutional Encoder ... 70
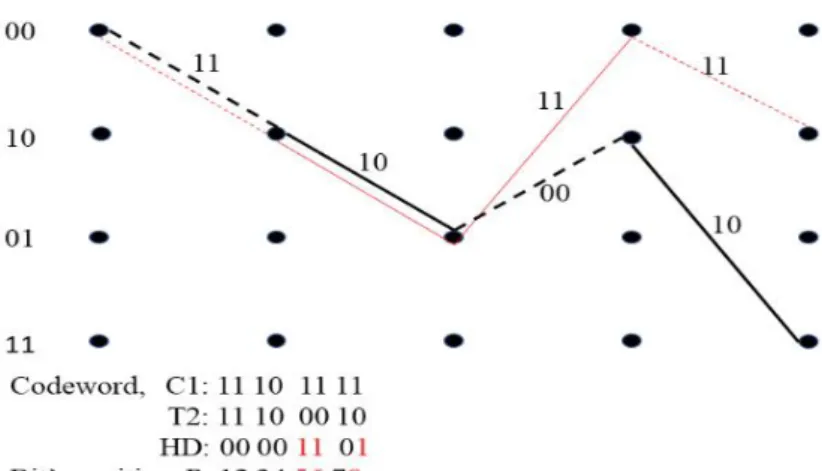
Figure 4.14: Trellis Diagram Example to Encode Input Bits [1001] ... 71
Figure 4.15: Path Metric using Threshold T1 ... 72
Figure 4.16: Path Metric using Threshold T2 ... 73
Figure 4.17: Path Metric using Threshold T3 ... 73
Figure 4.18: K-Fold Cross-Validation Method ... 74
Figure 5.1: Right Ankle Movement Signal, which is Affected by Noise (Spikes), the Signal Shows Strike Heel and Toe-Off on the Curve that Corresponds with the Concave Down and Concave Up, Respectively ... 82
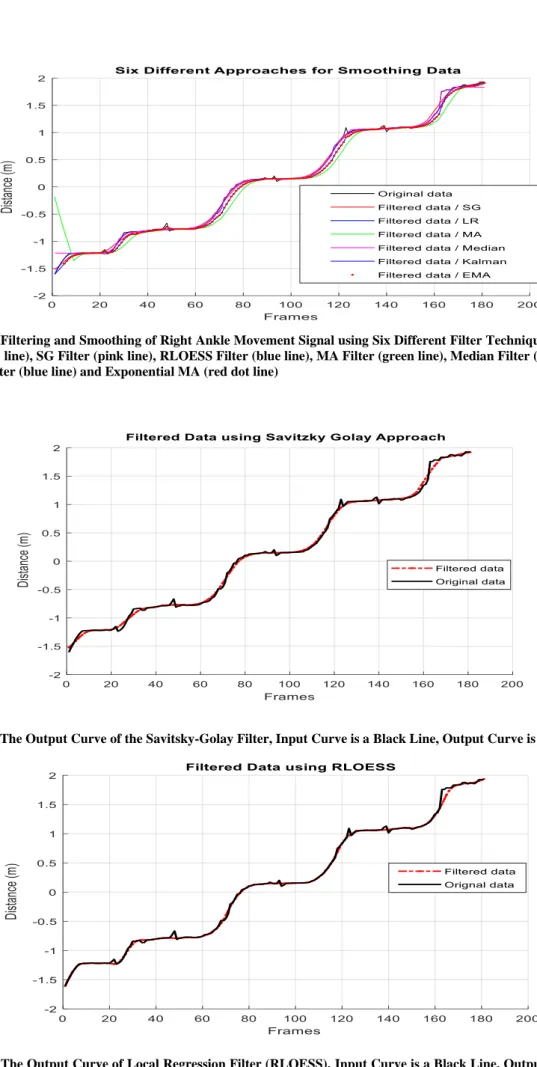
Figure 5.2: Filtering and Smoothing of Right Ankle Movement Signal using Six Different Filter Techniques; Original Data (black line), SG Filter (pink line), RLOESS Filter (blue line), MA Filter (green line), Median Filter (purple line), Kalman Filter (blue line) and Exponential MA (red dot line) ... 83
Figure 5.3: The Output Curve of the Savitsky-Golay Filter, Input Curve is a Black Line, Output Curve is a Red Line... 83
Figure 5.4: The Output Curve of Local Regression Filter (RLOESS), Input Curve is a Black Line, Output Curve is a Red Line. ... 83
Figure 5.5: The Output Curve of Moving Average Filter (MA) for Right Ankle Movement, Input Curve is a Black Line, Output Curve is a Red Line. ... 84
Figure 5.6: The Output Curve of Median Filter for Right Ankle Movement, Input Curve is a Black Line, Output Curve is a Red Line. ... 84
Figure 5.7: The Output Curve of Kalman Filter for Right Ankle Movement, Input Curve is a Black Line, Output Curve is a Red Line. ... 84
Figure 5.8: The Output Curve of Exponential MA Filter for Right Ankle Movement, Input Curve is a Black Line, Output Curve is a Red Line. ... 85
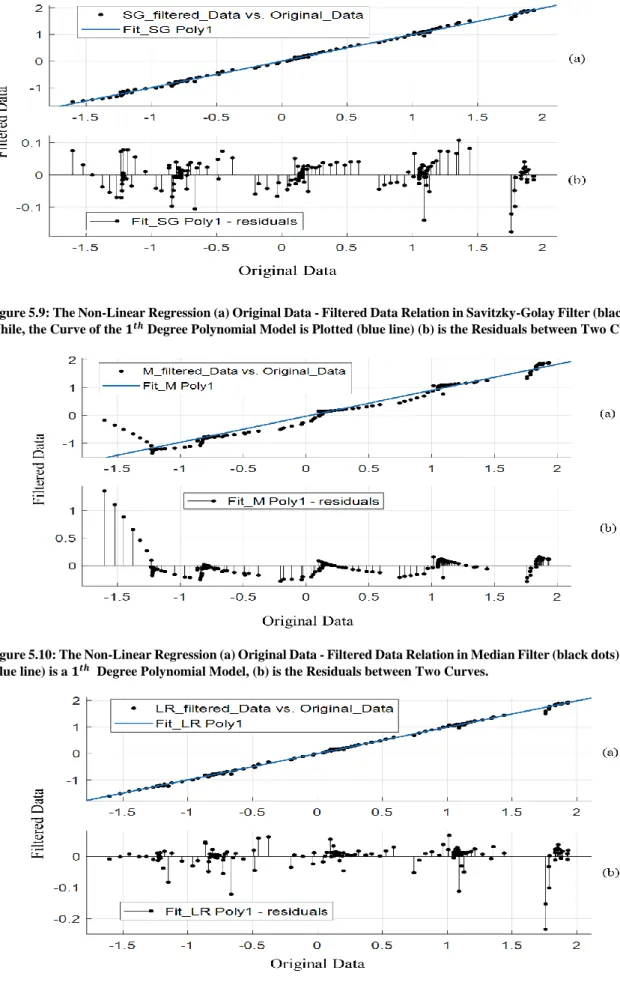
Figure 5.9: The Non-Linear Regression (a) Original Data - Filtered Data Relation in Savitzky-Golay Filter (black dots). While, the Curve of the 1𝑡ℎ Degree Polynomial Model is Plotted (blue line) (b) is the Residuals between Two Curves. ... 86
vii
Figure 5.10: The Non-Linear Regression (a) Original Data - Filtered Data Relation in Median Filter (black dots). While, (blue line) is a 1𝑡ℎ Degree Polynomial Model, (b) is the Residuals between Two Curves... 86 Figure 5.11: The Non-Linear Regression (a) Original Data- Filtered Data Relation in RLOESS Filter (black dots). While, (blue line) is a 1𝑡ℎ Degree Polynomial Model, (b) is the Residuals between Two Curves... 86 Figure 5.12: The Non-Linear Regression (a) Original Data - Filtered Data Relation in Savitzky-Golay Filter (black dots). While, the Curve of the 9𝑡ℎ Degree Polynomial Model is Plotted (blue line) (b) is the Residuals between Two Curves. ... 87 Figure 5.13: The Non-Linear Regression (a) Original Data - Filtered Data Relation in Median Filter (black dots). While, (blue line) is a 9𝑡ℎ Degree Polynomial Model, (b) is the Residuals between Two Curves... 87 Figure 5.14: The Non-Linear Regression (a) Original Data - Filtered Data Relation in RLOESS Filter (black dots). While, (blue line) is a 9𝑡ℎ Degree Polynomial Model, (b) is the Residuals between Two Curves... 87 Figure 5.15: Timed Walk Test in Real Time using Kinect Camera for 3 meters; Skeleton Data collection During Walk Test. ... 92 Figure 5.16: Three Walk Speeds Categorisation (a) Group One ( S ≤ 0.55), (b) Group Two (0.55 < S> 1), and (c) Group Three (S ≥ 1 𝑚𝑒𝑡𝑒𝑟/𝑠𝑒𝑐). ... 93 Figure 5.17: Gait Length Signal Generation from the Distance between (a) Right Ankle (dashed line) and Left Ankle (solid line) During Walk, (b) Generated Gait Signal in Absolute Value and (c) Without Absolute Value. ... 94 Figure 5.18: The Determination of a Complete Gait Cycle for Extracting Step Length (SL), Stride Length (STL), Double Support Time (DS), Swing Time (SW), Stance Time (ST) and Gait Cycle Time (SW+ST). ... 94 Figure 5.19: Gait Length Signal Conversion into AM Domain... 95 Figure 5.20: Sampling Frequency Adjustment for Reference Signal as: fs = (a) 90 Hz, (b) 100 Hz and (c) 110 Hz. ... 96 Figure 5.21: The AM-Modified Gait Signal in the Time Domain Changes its Features According to the Walk Speed. ... 96 Figure 5.22: AM-Modified Gait Signal in the Frequency Domain Changes its Features According to the Walk Speed. ... 97 Figure 5.23: A 5-Fold Cross Validation for Dataset Containing 120 Samples. ... 102
viii
Figure 5.24: A 10-Fold Cross Validation for Dataset Containing 120 Samples. ... 102 Figure 5.25: Error Rate Calculation of CE in 3-Classes of Gait Speed Classification when 5-Fold CV; (a) to (e) Represent 5-Folds from1 to 5. ... 103 Figure 5.26: Error Rate Calculation of CE in 3-Classes of Gait Speed Classification when 10-Fold CV; (a) to (j) Represent 10-Folds from1 to 10. ... 104
ix
LIST OF TABLES
Table 3-1: The Main Measures that are Commonly Used in Model Evaluation using the Confusion Matrix. ... 44 Table 4-1: The Confusion Matrix for Three Classes ... 76 Table 5-1: The Simple Correlation Coefficient for Filtered Data to Original Data ... 85 Table 5-2: Polynomial (9) Curve Fitting to Three Types of Filtered Data; Savitzky-Golay, Local Regression and Median Filters ... 88 Table 5-3: The Length and Width of Gait Step Data are Provided from Kinect and ART in Forward Walk to Kinect View, when Partitions are Labelled by 0.45 m and 0.17 m. ... 90 Table 5-4: The Length and Width of Gait Step Data are Provided from Kinect and ART in Forward Walk to Kinect View, when the Partitions are Labelled by 0.55 m and 0.20 m. ... 90 Table 5-5: The Length and Width of the Gait Step Data are Provided from Kinect and ART in Parallel Walk to Kinect View, when Partitions are Labelled by 0.45 m and 0.17 m. ... 90 Table 5-6: The Length and Width of Step Data are Provided from Kinect and ART in Parallel Walk to Kinect View, when Partitions are Labelled by 0.55 m and 0.20 m. ... 91 Table 5-7: Timed Walk Test for Five Trials using Two Methods; Stop Watch and Kinect Camera ... 92 Table 5-8: The Evolution of Data Gait Classification using Spatiotemporal Analysis for Gait Feature Extraction ... 95 Table 5-9: The Evolution of Data Gait Classification using the AM Technique for Gait Feature Extraction ... 97 Table 5-10: The Evolution of Data Classification using AM Tech for Gait Feature Extraction ... 98 Table 5-11: The Evolution of Data Classification using FM Tech for Gait Feature Extraction ... 99 Table 5-12: Dataset Reduction Based on Eigenvalues and Captured Variance of Total Data ... 101 Table 5-13: The Seven Gait Features from the AM-Modified Gait Signal are Reduced into Two Vectors using PCA ... 101 Table 5-14: Confusion Matrix for Three Classes in Case of 5-Fold CV ... 104 Table 5-15: Confusion Matrix for Three Classes in Case of 10-Fold CV ... 104 Table 5-16: CE Classifier Performance in Case of 5-Fold Cross Validation (k equals 5) .... 105
x
Table 5-17: CE Classifier Performance in 10-Fold Cross Validation (k equals 10) ... 105 Table 5-18: Supervised Classifiers Performance in both Cases of 5-Fold & 10-Fold Cross Validation ... 105 Table 5-19: AM/CE System Performance in Classification of Gait Pattern Changes ... 107
xi
LIST OF ABBREVIATIONS
ADL Activities of Daily Living
AM Amplitude Modulation
AS Amplitude Spectrum
CCD Charged Coupled Device
CE Convolutional Encoder
CMOS Complementary Metal Oxide Semiconductor
CV Cross Validation
DEL Departmental Expenditure Limit
DT Decision Tree
EDGE Evaluation Database to Guide Effectiveness
EDSS Expanded Disability Status Scale
EEG Electroencephalography
EMG Electromyography
ENoLL European Network of Living Labs
EOG Electrooculography
FM-NB Frequency Modulation-Narrow Band
FN False Negative
FP False Positive
HD Hamming Distance
GARS Gait Abnormality Rating Scale
xii GSM Global System Mobile
ICT Information and Communication Technology
k-NN k-Nearest Neighbour
MEMS Microelectromechanical Systems
MS Multiple Sclerosis
MS Kinect Microsoft Kinect
OpenNI Open Natural Interaction
OMs Outcome Measures
PCA Principle Component Analysis
RAI-MH Resident Assessment Instrument-Mental
RGB Red, Green, Blue
RMSE Root Mean Square Error
ROC Receiver Operating Characteristics
SDK Software Development kit
SMSW Short Maximum Speed Walk
SVM Support Vector Machine
T-25FW Timed 25 Foot Walk test
TP True Positive
TN True Negative
TUG Timed Up and Go test
xiii
ACKNOWLEDGEMENT
I would like to thank my supervisor Professor Samia Neft-Meziani for the continuous support, her motivation, and knowledge during my PhD study. Professor Nefti-Meziani’s office was always open for valuable advice and mentor for my PhD study.
Besides my supervisor, my sincere thanks also go to Dr. Tauseef Gulrez, Dr. Ipek Caliskanelli for their help and support. Dr Tauseef has provided me helpful advices, when he was my co-supervisor in the first year of my study. Dr. Caliskanelli has supported me for papers publication in second and third years. Especial thank to my co-supervisor in third year of my study Dr. Majeed Soufian for his guiding me in technical issues, mentoring me in research and giving me a deeper advice that I need for carrying out my PhD research.
I am very grateful to my wife, my sons who supported me in every possible way to see the competition of this work. Also, I would like to thank my brothers and sisters for their support and encouragement, and all others who have helped me throughout the research.
xiv
ABSTRACT
The quality of life and cost of care for elderly people varies dramatically between those living independently and those receiving acute or long-term care, which takes place at home, in residential care or in hospital. The common aim of national health service providers is to keep elderly people safe at their own homes for as long as possible to promote independent living, increase their quality of life and reduce hospital costs. Hence, the application of autonomous sensing systems to enhance everyday life of such population will be valuable and has been considered here.
Recently, Microsoft Kinect v2 has been used for gait analysis systems, to perform data classification of gait pattern changes based on walking speeds. This system enables the tracking without the need of any markers. Moreover, the Kinect camera is considered a low-cost device, and is quick to install, even in an unprepared environment. However, the primary challenge of such a device is that it provides a low data rate which leads to a decrease in the quality of extracted features, compared to other Motion Capture Systems (MoCap). Furthermore, in the data classification stage, the performance of classification is greatly affected by the boundary between different classes which is called decision boundary. This raises other questions such as: how to weight the features from the class labels, and which kind of similarity metric can be used.
To improve the quality of features, the Amplitude Modulation (AM) and Convolutional Encoder (CE) can play a major role in detection and in ranking the gait pattern changes based on walking speed. For this purpose, the collected data is mapped into a higher frequency spectrum using the AM domain. Consequently, the “AM-modified gait signal” is produced to improve the quality of extracted gait features, by increasing the level of the frequency sampling rate.
In this research, the main novelty is the combination of Amplitude Modulation (AM) and Convolutional Encoder (CE) techniques in one system (AM/CE) in order to understand and identify the walking speed effects on gait parameters. The former is proposed to extract new gait features without the need to determine the gait cycle phases, while the latter is developed to classify gait data based on walking speeds. Therefore, the performance of the CE technique is improved efficiently in gait data classification by weighting the bit positions in
xv
Hamming Distance (HD) length, which leads to an increase in the accuracy of measurement of the similarity metric.
1
1.
INTRODUCTION AND MOTIVATION
___________________________________________________________________________
This chapter presents the motivation, the main aim, objectives and the contributions of the research. It also briefly reviews the most relevant aspects of the study.
___________________________________________________________________________
1.1
Introduction
Human gait is a clinical terminology which refers to locomotion performance during the walking process. Since there is a significant correlation between gait disorder and some cognitive diseases (Choi, Park, Lee, Yoo, Kim, Jang & Oh, 2019), gait analysis becomes a highly recommended approach for use in the discrimination between normal and abnormal gaits (Jarchi, Lee, Tamjidi, Mirzaei & Sanei, 2018). This analysis has been exploited widely in different applications, for instance, in rehabilitation treatments (Steultjens, Dekker, Van Baar, Oostendorp & Bijlsma, 2000), sports analysis (Wahab & Bakar, 2011), biomedical engineering (Gabel, Gilad-Bachrach, Renshaw & Schuster, 2012), and other medical purposes (Ries, Echternach, Nof & Gagnon Blodgett, 2009).
Recently, a 3D skeleton for the lower body limbs was retrieved using the Microsoft Kinect sensors. The widespread use of Kinect sensors is due to its capability of providing the joints’ skeleton data without the need for markers to be placed on the body (Andersson & Araujo, 2015). Moreover, it is inexpensive and easy to install even in unequipped facilities. This make it an efficient approach for gait analysis by tracking elderly people in their homes, which might improve the quality of life for such residents (Soufian, Nefti- Meziani and Drake, 2020), (Malekmohamadi et al 2018). However, one of the key challenges that exists in these approaches is the necessity of gait cycle identification, i.e. detection of a gait cycle phases is required as a first task in gait analysis. Furthermore, the use of the Kinect camera in data collection might affect the measurements accuracy as it is considered a low data rate device.
In this research, many approaches have been examined (Elkurdi, Soufian & NeftiMeziani, 2018) for gait analysis of human walking behaviour to assess the level of the abnormal changes that could exist in gait pattern based on gait speed changes. Among these, the proposed AM/CE approach reduces the need to detect gait cycle phases, since during gait features extraction, it deals with the whole data collected on the AM domain.
2
The enhancement of extracted gait feature quality is important because the efficiency of extracted features can affect the accuracy of data classification. For this purpose, the combination of AM and CE techniques in one system is performed. First, the use of AM aims to convert a gait length signal into AM domain (Elkurdi, Caliskanelli and Nefti-Meziani, 2018), which enables the signals to be modified and analysed on the higher frequency’s spectrum. This leads to increased accuracy of measurements especially during gait feature extraction. In the data classification stage, the CE technique is proposed for determining three decision classes by calculating the similarity matrices based on Hamming Distance (HD), where a low quantity of HD means a high similarity in class prediction.
1.2
Research Motivation
The rapid growth of the ageing population is caused by a reduction of fertility (Gavrilov and Heuveline, 2003). Notably, the population is ageing (over 60 years old) in most of the world’s regions and this is anticipated to increase in the next decades. According to the World Data Bank (2011-2014), the ratio of old-age dependency (65 years old or over) to working-age (less than 65 years old) is growing, especially within developed countries. Figure 1.1 illustrates the proportion of elderly people in the UK, starting from mid-1974 until 2014 for three age categories. It is noticeable that the number of people over the age of 85 increased by almost four percent in 2014.
3
For all ages, there is a tangible rise in the population over the last four decades. For instance, in mid-1974, thirteen percent of the population was above 75, whereas by the end of 2014 this had increased to almost sixteen percent. The increase in the ageing population of the UK indicates that the human living period has become longer than ever before, with this achievement resulting in pride. However, with longevity, significant challenges have emerged due to sickness and health issues being prolonged (Brown, 2015). Therefore, of foremost importance is the provision of support for people during these health-related years. The consequences of longevity are reflected in the UK’s expenditure on healthcare.
According to a recent report by the UK government, the largest number of hospital care users are the elderly, with 62% of total bed days in 2014/2015 (Humphries e al., 2016). Figure 1.2 shows an increase in healthcare costs for people over 65 from 2006 to 2016. At the same time, a demand for housing is also likely to increase due to the anticipated rise of the elderly population. However, existing housing standards may not always meet this change in needs, which could lead to a critical situation. This will put more pressure on hospital unless there are changes that can be adapted to the new housing needs. Such housing can assist individuals to remain living at home, which has the greatest potential to lead to cost savings. Consequently, their quality of life and end of life functioning will be improved. The support can potentially be applied in two different ways: by improving the quality of life or by providing high quality medical support
4
Figure 1.3 (MacIntosh et al., 2014) below, shows a correlation between the quality of life versus the cost of care. On the one hand, quality of life can be improved when elderly people are healthy, under disease prevention and living independently in their own homes. Whilst, quality of life is decreased if they are receiving acute care in hospitals. The cost of care is the highest when acute care is being received, whereas it is low for those who are healthy under disease prevention and living independently in their own homes. The life quality and cost of care varies dramatically between living independently and receiving acute care, which takes place in either a home or residential care. The target is to keep people safe in their own homes for as long as possible to promote independent living, increase their quality of life and reduce hospital costs.
Figure 1.3: Quality of Life VS Cost of Care (Source: MacIntosh et al., 2014).
The expenditure of healthcare and an improvement in the quality of life for older people, along with the longevity challenges, are driving developments in the assistive living field, where technologies, smart applications and machine learning are involved. From this perspective, Ambient Assisted Living (AAL) is defined as “the use of information and communication technologies (ICT) in a person’s daily living and working environment to enable them to stay active longer, remain socially connected and live independently into old age” (www.aal-europe.eu) (Monekosso et al., 2015).
Furthermore, low-cost, technology-based solutions, including ambient living and remote healthcare management systems, are under development to tackle some of the aspects
5
of ageing. Such solutions aim to improve the quality of life and safety, while reducing treatment costs, as well as aiding healthcare systems to enable people to live safely in their own home for as long as possible. The most effective and indicative way to assess the quality of life and wellbeing is to track a subject’s activities, for example through the monitoring of several walk patterns in their own environment. This insight into their daily activities (Malekmohamadi et al., 2018), could help to detect frailty (Bravo et al., 2018), neurological disorders (McGough et al., 2013) and even Mild Cognitive Impairment (Soufian et al., 2020). The subject’s activity and walking speed are of paramount importance in such examinations. A person’s characteristics such as gait feature changes may also be monitored using a variety of sensors. Many studies have been conducted for gait tracking to extract gait features. One study by Liu, et al., (2009) focused on the lower trunk inclination being estimated gait phase detection. The authors used acceleration data collected during the mid-stance of gait. Another study used an accelerometer for gait tracking (Takeda, et al., 2009). The authors extracted the component of gravitational acceleration from acceleration data recorded during walking to calculate joint position. Chapter 2 provides further information on additional influential research in the fields of gait analysis for residential and clinical use.
This thesis has been motivated by some global issues including the ageing population (Al-Yaman, 2004), diseases that are related to the elderly, a shortage of professional nurses, and the high financial expenditures on health care for patients and elderly care. These phenomena will be more complicated in the future (Zeitler et al., 2012, Soufian et al., 2020). However, autonomous robotic sensing systems have been adopted by researchers and clinicians to improve the quality of life for patients and the elderly, with some approaches being considered as a low cost, reliable and robust solution. Hence, this thesis proposes a low-cost, tech-based solution to automate gait features extraction and classification, that can be deployed in residential environments.
1.3
Research Scope
The use of walking speeds as a measure in gait analysis system, for elderly people in their homes is the main concern of this research. For improvement, the accuracy and reliability of the measurements recorded using a gait analysis system are supported by different automated techniques, learning algorithms and vision systems, which can provide rich information of the gait movement. This system can be used to improve the quality of life for elderly people, thus enabling them to live in their home safely and independently for as long as possible. In Timed
6
Walk Test (TWT), the measure of gait speed is highly recommended for evaluating the gait pattern changes. To address existing concerns, the proposed system involves multiple stages for collecting, smoothing, extracting and reducing the gait data, to be used in data classification based on walking speed.
This study focuses on enabling elderly people, who live in a residential setting, to be monitored and tracked without the use of any attached devices to their bodies or video data to respect their privacy. The MS Kinect sensor as an efficient tool can satisfy these requirements and hence improve the quality of life by reducing the cost of healthcare and helping such environments to meet some needs of elderly people. Unfortunately, the Kinect camera provides a low data rate which leads to inaccuracy in measurements. However, the use of Amplitude Modulation and Convolutional Encoder techniques can play a major role in gait analysis, by improving the quality of extracted gait features, which leads to the enhancement of data classification accuracy.
1.4
Research Question
To achieve the aim and objectives of the study, this research is primarily concerned with the development of a gait analysis technique using Kinect camera for the extraction of the most representative gait parameters that can efficiently represent changes in walk pattern. Furthermore, these extracted features will be used to improve the accuracy of data classification based on walking speeds. The research question is:
“Can the automated gait analysis technique be used to improve the effectiveness of distinguishing gait pattern changes and ranking them based on walk speed, in particular when a low-cost, low data rate sensing device is usedto collect the data?”.
1.5
Research Aim and Objectives
The aim of this research is to develop an autonomous gait analysis system to detect and rank the changes in gait pattern based on walk speed, by avoiding gait cycle phases determination in case of using low data rate device. Moreover, the literature showed a widespread belief of a relation between the changes in gait parameters and walking at speeds that range from slow to fast (Fukuchi, Fukuchi & Duarte, 2019). Hence, this research attempts to enhance the performance of a gait analysis system, using a Kinect camera by improving the
7
accuracy of gait data classification based on walk speed. To address this aim, the following research objectives will be covered:
• To develop a low-cost and affordable system to track and collect the 3D skeleton data for the participant’s legs during walk process.
• To select the efficient smoothing data approach among a set of filtering techniques for reducing the level of noise from the collected data using Kinect camera.
• To validate the effectiveness of Kinect camera compared to high data rate camera systems.
• To develop an autonomous system that can perform a timed walk test for investigating that, the changes in walk speed might be detected efficiently by increasing the quality of extracted gait data.
• To map the baseband frequency of gait length signal into passband frequency using Amplitude Modulation (AM) technique for extracting new gait features without requirement for gait cycle determination.
• To use Principle Component Analysis (PCA) technique to calculate the most representative vectors of gait features to reduce the dimensionality of data matrix.
• To improve the accuracy of gait data classification in different cases of walk speeds using Convolutional Encoder (CE) technique.
1.6
Proposed Methods
In this research, a combination of both the Amplitude Modulation AM and Convolutional Encoder CE techniques is proposed, to automatically distinguish among the changes of gait pattern based on walking speed using the skeletal data of lower limb movement. However, a smoothing and filtering process is required due to the noise level in collected data when using a Kinect camera. An appropriate filter is chosen based on the fast response and time delay. Gait cycle determination is commonly used as a first task in human gait analysis (Kharb et al., 2010). Though, the AM approach is used for the extraction of gait features without the need to determine a gait cycle. Kinematic and spatiotemporal gait features are employed to extract the major of gait features. In addition, the performance of Amplitude Modulation (AM) technique in gait feature extraction is evaluated compared to traditional methods. In the dimensionality reduction of gait features, a Principal Component Analysis
8
(PCA) is used to reduce the matrix dimension of extracted features, where feature vectors are selected based on eigenvalues that offer a more representative pattern. During the classification stage, several supervised classifiers are used to classify the gait pattern changes. Moreover, use of the Convolutional Encoder (CE) technique is proposed, to classify the extracted gait features according to their changes in the gait pattern, then its accuracy is compared to a set of supervised classifiers. Finally, different evaluation metrics are applied to evaluate the accuracy of the whole proposed system.
1.7
Research Contribution
The major contribution of this research is to explore autonomous gait tracking techniques that can be effectively used for distinguishing gait pattern changes based on walk speed. The specific expected contributions will include:
• Identification of the best smoothing technique among six filters, for the reduction of the noise from skeletal positional data that is collected by a Kinect camera, by using correlation coefficients and fitting curve approaches for input and output data of filters.
• Investigate the effectiveness of extracting gait features using Amplitude Modulation technique comparing to Frequency Modulation technique in case of a low-data rate of sensing device.
• Introduce a new technique called Amplitude Modulation for extracting new gait features without need to determine gait cycle.
• Building a full system of autonomous gait analysis called (AM/CE) for detecting and ranking the gait pattern changes based on gait speed.
1.8
Thesis Structure
This thesis contains six chapters. Chapter 1 has presented the main topics that launched the study by introduction and motivation. Followed by the research problem and scope, addressing the main aim and objectives. Finally, proposed methods that will contribute in solving some problems and study structures.
9
Chapter 2 reviews the walking speed effects on gait parameters. Contents; a general description of elderly care in a residential environment for increasing the quality of life, where gait analysis is being adopted using sensing technologies and smart approaches.
• Chapter 3: Literature Review
The purpose of this chapter is to review the most relevant subjects for this research by exploring previous studies. This review also involves the use of a Kinect camera in gait analysis. The main topics include; 3D positional skeleton data collection, several techniques that were used in smoothing and filtering the skeleton data, a summary of gait cycle detection, a comprehensive guide to the extraction of gait features (i.e. kinematic and spatiotemporal gait features), reduction of gait features matrix, and gait pattern classification based on gait speed changes.
• Chapter 4: Implemented Methods and Proposed approaches
Chapter 4 demonstrates the methods and approaches that will be used for obtaining the results, with the proposed methods be derived mathematically in steps and explained through examples.
• Chapter 5: Results and Discussion
This chapter describes the aim of the experiment and the collation of results, which are illustrated in figures and tables. An analysis of the results is explained at the end of each experiment separately.
• Chapter 6: Conclusion and Recommendations
Chapter 6 concludes with a summary of the findings, then offers research recommendations and issues with potential future work, that could be followed up in future research projects.
10
2.
THE EFFECTS OF WALKING SPEED ON GAIT
PARAMETERS
__________________________________________________________________________________
This chapter explains the effects of walking speed on gait parameters during feature extraction. In addition, gait analysis use in certain environments are reviewed, including residential living and a clinical walk test for the elderly using a Kinect camera.
__________________________________________________________________________________
2.1
Introduction
Gait speed is a common measurement across several gait assessment tests, which is used to describe and rank walking ability. For instance, a Timed Walk Test (TWT) is a clinical approach used to assess gait performance, where the walk speed is an essential measure. Although such tests are considered as subjective assessments, the use of these approaches with supporting technological tools could assist in making decisions. Especially for the elderly who prefer to live independently. Moreover, Ambient Assisted Living (AAL) is designed to improve the quality of life in such environments. Particularly when a residential setting does not have a medical license. Consequently, the cost of healthcare can be reduced, and the quality of life could be improved. In addition, an objective assessment can be provided by introducing technologies which may aid clinicians to make decisions, rather than relying on the use of a subjective assessment. Therefore, this study proposes to automate a gait analysis system that can be used efficiently during the detection and classification of gait pattern changes using a Microsoft Kinect V2, which may contribute to the improvement of the quality of life for the elderly, who prefer to live in their own home.
2.2
Gait Parameters Changes due to Walking Speeds
Human gait analysis is an attractive field of study for many researchers and clinicians at present, especially with the use of a vision tracking system. This analysis involves measurement, compression, description, classification and assessment of the changes in gait pattern (Ghoussayni, Stevens, Durham, & Ewins, 2004). It is commonly used to detect gait phases, extract the kinematic and spatiotemporal gait parameters, and classify the gait data.
Notably, walking speed is a fundamental evaluative tool in gait assessment (Robertson, Parsons, Sidtis, Hanlon Inman, Robertson, Hall & Price, 2006). In fact, the biomechanical
11
variables are correlated to the changes in gait speed such as kinematics gait features, kinetics gait features, spatiotemporal gait features, muscle activity and ground reaction forces (GRF) amongst others. In this context, numerous studies have been explored, which explain the effects of walking speed on gait patterns in different fields of gait analysis. For example, (Jordan, Challis & Newell, 2007) clarified the fluctuation of gait cycle parameters (interval & length of step & stride gait) due to walking speeds. While, (Ardestani, Ferrigno, Moazen & Wimmer, 2016) investigated changes in cadence and stride length because of gait speed changes from slow to fast by using joint movement from the lower extremity. Furthermore, spatiotemporal gait features showed speed-dependency for distinguishing between healthy and unhealthy people, who live with bilateral vestibulopathy (BVP) (McCrum, Lucieer, Van De Berg, Willems, Fornos, Guinand & Meijer, 2018). It was explained that the most significant differences were at slower walking speeds with temporal and sagittal plane spatial gaits, while frontal plane spatial gait variability was demonstrated at faster walking speeds.
Clinically, a walk speed is used as a measurement for gait assessment in many approaches of Timed Walk Tests. For example, Behrens, Pfüller, Mansow-Model, Otte, Paul & Brandt (2014) assessed 22 patients with MS disease, nine of whom were males. A Kinect sensor was placed 2m in front of the patients to measure gait speed. The author was then able to determine an acceptable correlation between the gait speeds measured using a Kinect and the clinical measurements. The tracking of the lower body joint movements was conducted using skeletal data. Furthermore, Galna, Barry, Jackson, Mhiripiri, Olivier & Rochester (2014) tested 9 people with Parkinson’s disease, three of whom were male. The authors measured the up/down displacement of the knees within the movement timing and spatial displacement using skeletal data.
2.2.1
Timed Get Up and Go (TUG)
TUG is a timed test commonly used to measure an elderly person’s ability to turn around 180° (Podsiadlo & Richardson, 1991), where functional mobility, walking balance and
the ability to stand to sit and sit to stand are also considered. In this assessment, a person is instructed to stand up, walk forward 3 meters, turn around 180°, walk back and sit on the chair (Dubois, Bihl & Bresciani, 2017) see Figure 2.1 below for more details.
12
Figure 2.1: Timed-Up & Go Test
If the participant can complete this task in 11 to 20 seconds, this can be considered normal (Shumway & Woollacott, 2007). However, Shumway-Cook, Brauer & Woollacott (2012) suggest that more than 30 seconds to complete the TUG test could mean that the participant may be at a fall risk. While, Straudi, Martinuzzi, Pavarelli, Charabati, Benedetti, Foti & Basaglia (2014) used TUG for 10 subjects with MS disease to assess their mobility. Moreover, further research was carried out by Vernon, Paterson, Bower, McGinley, Miller, Pua & Clark (2015) who compared data that was measured by a Kinect to clinical test measurements. The Up and Go test (TUG) was used as a clinical timed test. Thirty participants were recruited aged between 15 to 68 years, 21 of whom were male. In this case, the Kinect showed excellent association with the TUG’s clinical test.
2.2.2
Timed 25-foot walk (T25FW)
The T25-FW test is managed for walking speed assessment (Hubbard, Wetter, Sutton, Pilutti & Motl, 2016). In this test, participants are instructed to walk as fast as possible, but safely. This is done over a 25-feet carpeted surface (Fischer, Rudick, Cutter, Reingold & National MS Society Clinical Outcomes Assessment Task Force, 1999). The time taken is recorded for participants over two trials. The average completion time over two completed trials is the score for the T25-FW, and this average can be converted into walking speed (Kieseier & Pozzilli, 2012). Management of the T25-FW test covers trials 1&2 and the recording of the report form. In trial one, the subject should be instructed to walk from the starting line, and to finish the task of safely walking 25 feet as fast as possible. The departure time is recorded from the starting line till arrival at the finish line, which are considered as begin time and stop time respectively, as shown in Figure 2.2 below. In trial two, the subject must repeat the same instructions as trial one when he/she reaches the second line. To complete the record form, completion time of the two tasks together (trials 1 and 2) can only be recorded as a successfully completed task.
13
Figure 2.2: Timed 25-Foot Walking
Several methods have been introduced to determine a clinically significant change in this measurement. For instance, a range of values has been developed for the T25-FW to assess changes in walk-time. Examples include changes of gait features that occur during an exacerbation of multiple sclerosis. Ries, Echternach, Nof & Gagnon Blodgett (2009) suggest that an increase in test score may indicate a significant gait feature change. Moreover, the T25-FW has been considered as a reliable test, especially in longitudinal studies with different physicians assessing patients (Freedman, Patry, Grand'Maison, Myles, Paty & Selchen, 2004). In the same context, Clark, Vernon, Mentiplay, Miller, McGinley, Pua & Bower (2015) compared Kinect data to clinical test measurement. A 10m walking test was used as a clinical assessment. Thirty participants were recruited, nine of whom were females, to measure step length and gait speed by using one Kinect sensor to provide the skeletal data.
2.2.3
Multiple Sclerosis Walking Scale (Rating Scales)
Gait velocity is described as an important primary tool in Multiple Sclerosis (MS) clinical assessment by the National Multiple Sclerosis Society’s Clinical Outcomes Measurement Task Force (Fischer et al., 1999) & Robertson, Parsons, Sidtis, Hanlon Inman, Robertson, Hall & Price (2006). One standard scale for MS is the Expanded Disability Status Scale (EDSS). The use of this scale is to classify disability levels (for further details see Figure A.1 in appendix A), which have a numerical range from 0 to 10 for patients with MS (Kurtzke, 1983). While, the Hauser Ambulation Index (AI) is another scale for patients with MS to assess ambulation-related disability (Hauser, Dawson, Lehrich, Beal, Kevy, Propper & Weiner, 1983). However, the AI scale provides outcomes in walking speed assessment for patients at a more reliable level than the EDSS (Schwid, Goodman, Mattson, Mihai, Donohoe, Petrie & McDermott, 1997).
14
Another clinical scale is the 12-item MS walking scale (MSWS-12) which is a self-report for individuals who have Multiple Sclerosis (Allen, Diane, Bennett, Brandfass, Pittsburg, Stratford, Widener & Flint, 2011). The MSWS-12 is highly recommended for patients with Multiple Sclerosis to assess their walk ability with five levels: 1 means no disability, while 5 means extreme disability (see Table A.1 in appendix A).
The Multiple Sclerosis Evaluation Database to Guide Effectiveness (EDGE) task force outlines 63 outcome measurements (OMs) (Potter et al., 2014), (see Table A.2 in appendix A). These OMs cover the list of recommended tests for patients with MS including T25-FW, TUG, and MSWS-12. These tests and scales use the Timed Walk Test and the ‘ability of walk’ as a primary tool for achieving the assessment. For this purpose, the use of a marker-less based vision system in walk assessment is adopted for this research. Particularly for use in a home, or even a clinical setting, as this may enable the automation of gait feature extraction, which is required for improvement in measurement accuracy.
2.3
Residential Care for Elderly People
Assisted living facilities and nursing homes provide services such as personal care and medical amenities. However, residential homes (or assisted living facilities) are not licensed to give nursing care. Typically, an assisted living facility is a place where elderly people live, and where they receive help in the activities of daily living (Helal & Abdulrazak, 2006).
Assisted living facilities do not include licensed nurses nor do they have any connection with nurses. These settings are considered as non-medical services. Even if nurses are available amongst the staff of an assisted living facility, the nurse cannot carry out the duties of nursing, such as administering oxygen, insulin, or other clinical jobs. Assisted living facilities are organized by the state Department of Social Services (Zimmerman, Scott, Park, Hall, Wetherby, Gruber-Baldini & Morgan, 2003), (Zimmerman & Sloane, 2007). Whilst, nursing homes are organized by the Department of Health. However, the population of these settings continues to grow and includes residents with dementia diseases, which can have a demonstrable impact on assisted living facilities. A study conducted by the National Academy on an Aging Society (2000), reports that almost 4 million USA residents aged 65 years or over, have Alzheimer’s disease. Furthermore, it states that this number is predicted to triple by 2050. Additionally, another study reported that the amount of people who live in a residential setting with mental diseases such as dementia had reached at least half of the total population (United States General Accounting Office, 1997).
15
In other words, it is possible to surmise that some assisted living communities have become places for people who live with dementia or Alzheimer’s disease. According to a study that conducted a visit to 22 random assisted living places, research showed that two out of the three residents living there had Alzheimer’s disease (Rosenblatt, Samus, Steele, Baker, Harper, Brandt & Lyketsos, 2004). In the same context, another study recorded that out of every three residents, one had a cognitive impairment, ranked between moderate to severe (Hawes, Phillips, Rose, Holan & Sherman, 2003). Recently, some studies have also reported that diseases such as MS and Parkinson’s, which are associated with ageing, may decrease an older person’s independence of their daily living needs. Moreover, the ageing population is increasingly becoming a larger part of the population. Subsequently, home care approaches will not be sustainable. However, sensing technologies have been introduced to develop “Assistive Environments” that aid the elderly and enhance their quality of life, with safe and independent environments.
Consequently, there is a need to address the problem from both a societal and economic standpoint. As support can be driven into either increasing the quality of life or providing high quality medical support. For instance, Fried, Cwikel, Ring & Galinsky (1990) designed the “Extra-Laboratory Gait Assessment Method” or ELGAM, which was designed to assess gait in the home or in an outpatient setting, with the gait speed measured by stop-watch. However, these clinical tests are considered as semi-subjective assessments, as they are carried out by specialists who assess a patient’s gait through observation of their walking.
One such support system is Ambient Assisted Living (AAL), which has been adopted to play a major role in the assistance of elderly people within a low-cost environment with continuous social communication. Ambient Assisted Living is an area where sensors can be involved to create an intelligent environment for ageing or cognitively impaired patients, thus enabling them to stay independent, safe and active for longer in their preferred environment (Monekosso, Florez-Revuelta & Remagnino, 2015). A walking analysis is explored in such environments specifically to detect falling (Lombardi, Ferri, Rescio, Grassi & Malcovati, 2009). This can contribute to an increase in the quality of life and a cost reduction for public health systems (Kleinberger, Becker, Ras, Holzinger & Müller, 2007). Research in the AAL community has covered a large range of studies. Notably, most research has been conducted in the area of human activity recognition and behaviour comprehension, with the objective of detecting activities within an environment. Furthermore, the recognition and detection of events is an important topic in AAL solutions. One example is fall detection, where wearable
16
sensors have been widely used for detecting falls, but one limitation is that they must always be worn. More recently, researchers have included optical sensors in assisted living environments. However, the challenges of the optical sensor include clutter, obstruction and other noises. Moreover, statistics show that the largest number of falls has been recorded in the bathroom, a location where privacy concerns are highest. To tackle this issue, Infra-Red IR sensors are used for privacy-aware techniques.
2.4
Sensor Technologies
Gait speed assessment has been experienced widely using different kinds of sensors. Recently, vision-based tracking with marker-less systems has been involved in research that aims to track human movement data in real-time. Whilst, different sensor technologies have been used in the tracking of human movement. Examples include inertial, marker and RGB/IR sensors.
2.4.1
Non-vision-based Tracking System
In non-visual based systems, sensors are attached to parts of the body to collect data on position and velocity (Zhou & Hu, 2008). These sensors can be classified as inertial, acoustic, magnetic sensing, mechanical and RF sensing. The advantages and limitations of these sensors are dependent on the sensor type. Limitations include frequent battery operations and replacements, along with modality-specific, measurement-specific and circumstance-specific issues (Zhou & Hu, 2004). For example, as part of inertial sensors, accelerometer sensors (also known as inside-out systems) are employed on an object to sense an external source (e.g. the earth's gravitational field as reference) to provide information in 3D. However, the limitation of this system is its dependence on an external source. In addition, an accelerometer suffers from ‘drift problems’ during measurement. For example, when the accelerometer estimates location or velocity, a drift might take place due to sensor noise or offsets. Consequently, additional correction is required throughout the tracking process (Bouten, Koekkoek, Verduin, Kodde & Janssen, 1997). Furthermore, resolution and signal bandwidth are normally limited by the interface circuitry (Bouten et al., 1997).
2.4.2
Vision Based Tracking System
The vision system-based tracking system can be categorised into two parts: vision-based tracking, with and without markers. In the former part, optical sensors (cameras) are used
17
to track and monitor human movements, which are captured by placing markers (identifiers) on the parts of the human body involved. Examples include a Vicon camera. As skeletal human movement is highly articulated, rotations and twists require full 3D movement tracking (Bray, 2001). This system has been used successfully in biomedical fields (Delahunt, Monaghan & Caulfield, 2007), where it enables the participant to move continuously in and out of the camera view. Consequently, this leads to consistent and reliable tracking of the human body. However, one major limitation of vision sensors with markers is that they cannot be used outside laboratory environments. This leads to difficulty in preparation and installation; therefore, such systems are unsuitable for unstructured clinical and residential settings. In addition, this kind of system suffers from obstruction and ghost problems due to interference (Sullivan, Eriksson, Carlsson & Liebowitz, 2002).
In the second category, which is vision-based tracking with marker-less systems, computer vision algorithms are employed with an inexpensive camera to estimate the position data of human gait (Andersson & Araujo, 2015). Use of these sensing technologies adds another dimension to traditional RGB cameras, which is an RGB-Depth device, such as the Microsoft Kinect, thus providing a robust solution to infer 3D scene information regarding human gait analysis through continuous-projection onto a screen. In later sections, more details will be provided on the principal work of marker-less vision-based tracking systems.
2.4.3
Microsoft Kinect Sensor Based Depth Data
Basically, Microsoft Kinect is a set of devices that work together to make it a powerful product (Lachat, Macher, Mittet, Landes & Grussenmeyer, 2015). The Kinect contains a colour camera, depth sensor (IR camera & IR projector) and four microphones, as can be seen in Figure 2.3 below. The Kinect can be used for motion sensing and tracking, as well as capturing and interpreting full-body movements. Consequently, researchers quickly realized that the Kinect could be used for purposes other than games (Zhang, 2012).
18
Due to the Kinect’s depth sensor and low cost, it can be used in different fields. One example is the detection and tracking of skeleton joints. The depth camera sensors make it possible to obtain the depth data of an object’s parts in a scene. The information is provided by the D camera, where each pixel has information on the estimated distance from the RGB-D camera to a certain point on the object. The pixels’ location can be formed in frames (30 frames per second). The position information from the RGB-D sensor allows the tracking of several human body joints (25 joints with Kinect V2) in 3D as shown in Figure 2.4 below. The skeleton joint positions can be acquired by the MS Kinect using the MS Kinect SDK, which is a middleware framework. In recent years, depth cameras have commonly been used as sensors to capture depth images in real time (frame rates). In this section, some of the studies that have involved the capturing of depth information using a Microsoft Kinect in their applications will be reviewed.
(a)
(b)
19
One example of application is provided by Aitpayev & Gaber (2012) who used MS Kinect for collision objects (human body parts) in augmented reality. The author developed the new Kinect SDK to improve the accuracy of skeleton motion recognition. In the same year, Tong, Xu & Yan (2012), proposed skeleton animation motion data based on the Kinect. The joint position data was captured first, followed by a joint rotation calculation to enhance the 3D model. The author designed a low-cost system for 3D motion, but jittering was observed in the implementation process. Furthermore, Zeng, Liu, Meng, Bai & Jia (2012) presented a technique of motion capture and reconstruction using depth information from the Kinect. This method was based on a model of the human body reconstructed using 3D motion. The authors recorded high accuracy of human motion and posture with low latency in the system process. Although noise and errors are usually generated during the process of data acquisition, this issue is solvable. For instance, Ma, Xu & Liu (2011) collected 3D positions of human joints in real time using the MS Kinect, and then rotation matrices were computed for those joints. The authors obtained a target skeleton for animation of 3D characters. Significantly, the noise and errors in joint position were removed.
Notably, using multiple Kinects instead of a single camera increases performance and reliability. For example, Tong, Xu & Yan (2012) designed an algorithm for scanning a 3D human body using low cost devices such as the Kinect. The authors were able to deal with the interference phenomenon and obstructions using multiple Kinects. However, the reconstruction model quality was still poor, due to the low accuracy of the depth data captured. Specifically, skeleton tracking techniques were studied using different technologies that were either marker based or without marker data vision. For instance, the following studies adopted sensing technology for skeleton tracking using both methods (markers/marker-less). One study was carried out by Fern'ndez-Baena & Lligadas (2012) who conducted a comparison of the MS Kinect with another visual motion capture device (Vicon) for the validation of human body joint movements (upper/lower) for rehabilitation treatments. In this case, it was demonstrated that the accuracy of the Kinect was less than that of the Vicon. However, the Kinect is still beneficial as it is marker less, portable and has a low-cost.
2.4.4
Gait Analysis using Microsoft Kinect Sensor
The use of a Kinect camera as a gait analysis instrument has emerged in the last few years as an attractive tool in marker-less vision-based tracking systems. Moreover, recent
20
studies have suggested that the Microsoft Kinect can be exploited to estimate spatiotemporal gait parameters (Clark, Bower, Mentiplay, Paterson & Pua, 2013), and gait kinematics features (Gabel, Gilad-Bachrach, Renshaw & Schuster, 2012).
Gait analysis has been explored widely by researchers and clinicians, with the focus on gait feature extraction, which can explain gait pattern changes. One study by Clark et al., (2013) used skeletal data to assess the gait step time, gait speed, gait step length, gait stride time, gait stride length and velocity of foot swing for twenty-one participants. More accuracy for stride length, step length and gait speed were observed than for the other parameters. Another study by Mentiplay, Perraton, Bower, Pua, McGaw, Heywood & Clark (2015) used 3D skeleton data for thirty participants. They placed the Kinect in front of the subjects, to test gait velocity, speed variability, length/width of step gait, swing leg duration, and displacement of the pelvis. The flexion for ankle/hip, and flexion/adduction for the ankle were also measured. Furthermore, Xu, McGorry, Chou, Lin & Chang (2015) recruited twenty participants, half were male, to assess gait cycle parameters such as stride time, step time, swing time, stance time and double limb support time. The joint angles of the hip and knee during a gait cycle were also measured. Notably, the measurements of step time, stride time, and step width were more accurate when compared to the measurements of the Kinematic parameters. In addition, Auvinet, Multon & Meunier (2015) computed the largest distance between the knees to estimate heel strike events. Eleven participants were recruited using depth data provided by the Kinect, which was placed 2m in front of the subjects.
Many studies have attempted to exploit the MS Kinect in gait analysis, particularly in clinical tests. For example, Pfister, West, Bronner & Noah (2014) positioned a Kinect sensor on the left of the participants at 45° to the treadmill. This was carried out on twenty participants, to measure the peak angular displacement for hip and flexion / extension of knee and stride time, using skeletal data. The measurements of the Kinect for the knee were more accurate than for the hip. Although this study recorded outcomes that were insufficiently in agreement with the clinical tests, recent research has recorded acceptable results in comparison with clinical timed walking tests.
2.5
Summary
The ageing population is increasing more than ever before, and it is expected to rise in the future, therefore the demand for elderly housing care will be higher. One significant
21
challenge is whether existing housing facilities will still meet the changing needs of the residents. Moreover, studies have reported that many of the residents who live in residential care suffer from dementia diseases. However, support can be reached by increasing the cost of healthcare or by improving the quality of life. In other words, there is a trade-off between acute care cost and the quality of life. The latter can be adopted and improved by enabling the elderly to live in their own homes independently and safely for as long as possible, this could dramatically decrease the cost of healthcare.
AAL is defined as a solution for improved quality of life, it involves technologies, smart systems and automated approaches being incorporated into assisted living environments. In this context, the use of a gait analysis system is highly recommended as a tool for walk assessment, especially based on the evidence that supports a correlation between walking speeds and changes in gait parameters. This means that a gait analysis system can contribute to the improvement of the elderly’s quality of life. In addition, an MS Kinect camera can be an efficient tool in assisted living environments, as it provides various benefits such as being marker-less, low-cost, quick to install even in an unequipped environment and can be used as a privacy aware system.
22
3.
LITERATURE REVIEW
___________________________________________________________________________ This chapter reviews one of the most state-of-the-art devices available for exploration into gait analysis – a Kinect camera, which focuses on skeletal data for gait spatiotemporal analysis. In addition, it identifies and describes the approaches and algorithms used for the extraction and classification of gait features.
___________________________________________________________________________
3.1
Introduction
A vision-based tracking system without markers plays a crucial role in gait analysis. This low-cost system provides vital and rich information. Moreover, the tracking of system-based 3D skeletal data can be achieved without the attachment of any kind of devices to the body, and it is quick to install even in a non-equipped place. Hence, its overall contribution is a reduction in the cost and complicity of the measurements and analysis. The processing of skeletal data for gait analysis is applied in several stages to build a complete system that can collect, smooth, extract and classify gait features. The purpose of this system is to distinguish among the gait pattern changes due to walking speeds.
Gait feature extraction plays a major role in the next stages of the system, as the quality of the extracted features can affect performance at the data classification stage. Several techniques are conducted for gait feature extraction, with the challenge being how to address the extracted features that can enhance classification accuracy. For this purpose, the extraction approaches can be defined as efficient, robust and reliable if they can improve the performance of the classification stage. In addition, the dimension of the gait features matrix can be reduced to improve gait feature quality. Using the data reduction technique, the vector features that have a high percentage of variance will be selected. For example, a Principal Component Analysis (PCA) is commonly used in feature reduction solutions, based on eigenvalues and eigenvectors, to determine the high representative feature vectors. During the classification stage, several techniques are employed in gait pattern classification. To test the unseen data, a Cross-Validation (CV) approach is commonly used with supervised classifiers, where a k-fold CV is highly recommended as it guarantees that each point of data can be used as a training and testing set without overlapping.
23
This chapter is organised into several sections to describe the main stages of the gait analysis system. First, skeletal data collection is presented in section 3.2. Then, section 3.3 provides a brief overview of the pre-processing techniques for smoothing and filtering noisy data from skeletal data. After that, section 3.4 gives an overview of human gait cycle determination including the main sub-phases that form one complete gait cycle. While, gait feature extraction and reduction are shown in sections 3.5 and 3.6 respectively. Then, data classification of the gait pattern changes is detailed in section 3.7, and section 3.8 details the most suitable evaluation metrics for classifier performance, while cross validation techniques are provided in section 3.9. Finally, this chapter is summarised in section 3.10.
3.2
Skeletal Data Collection
MS Kinect provides several data types that can be employed in a gait analysis system by tracking human movement in a 3D space. The RGB-D information and 3D skeleton data are broad categorizations of the Kinect’s sensor data (Han, Reily, Hoff, & Zhang, 2017). In this section, 3D skeleton data will mainly be reviewed, because the proposed system is built to investigate changes in walk speed that can affect gait parameters using this data. Specifically, for spatiotemporal and kinematics gait parameters.
Significantly, 3D skeleton data can be collected using a Kinect camera, to extract gait features for classification of gait pattern changes based on walking speeds. For example, one study recruited twenty healthy participants to walk on the treadmill, while both systems (Kinect sensor and motion capture system) tracked the kinematics data of body joints. The aim was to extract knee and hip joint angles, where the frame error rate of the heel strike estimation was 0.18 and 0.3 for the right and left leg, respectively. Whilst, the average toe off frame errors estimation was 2.25 and 2.61 across three different walking speeds of 0.85, 1.07, and 1.30 m/s (Xu, McGorry, Chou, Lin & Chang, 2015). In a similar context, 21 healthy subjects were instructed to walk at maximum speed as much as possible and safe, then the spatiotemporal gait parameters were extracted from collected data using both a Kinect and gold standard device. The results showed that there was a high correlation of (ICC ≥ 0.888) in the case of one Kinect, however the correlation rate improved when multi-Kinects were used (Geerse, Coolen & Roerdink, 2015).
Furthermore, an accuracy evaluation of 3D Kinect data in spatiotemporal gait analysis was investigated by (Dolatabadi, Taati & Mihailidis, 2016), where the GAITRite system was included as a comparable tool and gold standard, under three walking conditions, including the
24
usual, dual task and fast walk. The results of the agreement showed at 95% Bland-Altman limits for the Kinect as a valid tool in spatiotemporal gait analysis during three conditions. An excellent correlation (ICC2,1 = 0.98), and strong reliability were exhibited among the walking types (ICC3,1 > 0.73).
3.3
Smoothing and Filtering Data Techniques
The skeletal positional data, that is tracked and collected by a Kinect camera during a human walk, is known as a dynamic problem. The captured information is always described as noisy data due to

![Figure 3.2: The Vertical Displacement of the Spine-Base during a Walk Process. [Source: Kinesiology Scientific Basis of Human Motion, 12th Edition by Hamilton, Luttgens & Weimar (1991)]](https://thumb-us.123doks.com/thumbv2/123dok_us/816094.2603160/45.892.194.701.716.951/vertical-displacement-process-kinesiology-scientific-edition-hamilton-luttgens.webp)