Air Force Institute of Technology
AFIT Scholar
Theses and Dissertations Student Graduate Works
3-21-2019
Non-Intrusive Occupancy Detection Methods and
Models
James C. Tyhurst
Follow this and additional works at:https://scholar.afit.edu/etd
Part of theEnvironmental Indicators and Impact Assessment Commons
This Thesis is brought to you for free and open access by the Student Graduate Works at AFIT Scholar. It has been accepted for inclusion in Theses and Dissertations by an authorized administrator of AFIT Scholar. For more information, please [email protected].
Recommended Citation
Tyhurst, James C., "Non-Intrusive Occupancy Detection Methods and Models" (2019).Theses and Dissertations. 2355. https://scholar.afit.edu/etd/2355
NON-INTRUSIVE OCCUPANCY DETECTION METHODS AND MODELS
THESIS
James C. Tyhurst, Captain, USAF AFIT-ENY-MS-19-M-200
DEPARTMENT OF THE AIR FORCE AIR UNIVERSITY
AIR FORCE INSTITUTE OF TECHNOLOGY
Wright-Patterson Air Force Base, Ohio
DISTRIBUTION STATEMENT A.
The views expressed in this thesis are those of the author and do not reflect the official policy or position of the United States Air Force, Department of Defense, or the United States Government. This material is declared a work of the U.S. Government and is not subject to copyright protection in the United States.
AFIT-ENY-MS-19-M-200
NON-INTRUSIVE OCCUPANCY DETECTION METHODS AND MODELS
THESIS
Presented to the Faculty
Department of Systems & Engineering Management Graduate School of Engineering and Management
Air Force Institute of Technology Air University
Air Education and Training Command In Partial Fulfillment of the Requirements for the Degree of Master of Science in Engineering Management
James C. Tyhurst, BS Captain, USAF
March 2019
DISTRIBUTION STATEMENT A.
AFIT-ENY-MS-19-M-200
Non-Intrusive Occupancy Detection Methods and Models
James C. Tyhurst, BS Captain, USAF
Committee Membership:
Lt Col Andrew J. Hoisington Chair
Major Steven J. Schuldt Member
Dr. John J. Elshaw, PhD Member
AFIT-ENY-MS-19-M-200
Abstract
Occupants in the built environment impact facility energy consumption and indoor air quality. Predicting the presence of occupants within the built environment can therefore be used to manage these factors while providing additional benefits in terms of emergency management and future space utilization. Detecting occupancy requires a combination of sensors and models to accurate assess data collected within facilities to predict occupancy. This thesis investigated occupancy detection through a non-invasive data collection sensors and model. Specifically, this thesis sought to answer two research questions examining the ability of a radial basis function to accurately predict occupancy when generated from data collected from two facilities. Generated models were
evaluated on the data from which they were derived, self-estimation, as well as applied to other areas within the same facility, cross-estimation. The motivation, sensors and models, were discussed to establish a framework. The principle implications of this research is to reduce energy consumption by knowing when the built environment is occupied through the use of non-invasive data collection sensors supplying inputs into a model. The resulting accuracy rates of the derived models ranged from 48% - 68% when using three collected parameters: temperature, relative humidity and carbon dioxide.
Acknowledgments
I would like to express my unending love and gratitude to my wife who has been my rock through difficult times. She has been a source of inspiration and strength as we endure the challenges associated with expanding our family. I would also like to express my sincere appreciation to my faculty advisor, Lt Col Andrew Hoisington, for his patience, guidance and support throughout the course of this thesis effort. The insight and experience was certainly appreciated.
Table of Contents Page Abstract ... iv Table of Contents ... vi List of Figures ... ix List of Tables ...x I. Introduction ...1 1.1 Background ...1 1.2 Problem Statement ...1 1.3 Research Questions ...1 1.4 Methodology ...2 1.5 Assumptions/Limitations ...3
II. Literature Review ...5
2.1 Chapter Overview ...5
2.2 Motivation for interest in occupancy ...5
2.3 Current occupancy sensing technology ...8
2.3.1 Invasive and Non-invasive ... 9
2.3.2 Invasive - Visual ... 10
2.3.3 Invasive – Audio ... 10
2.3.4 Non-invasive methods ... 11
2.3.5 Carbon dioxide (CO2) ... 11
2.3.6 Ambient sensors ... 12
2.3.7 Position tracking ... 13
2.4.1 Radial basis function (RBF) ... 16
2.5 Confounding factors ...18
2.5.1 Ventilation ... 18
2.5.2 Diversity of indoor environments ... 18
2.5.3 Data collection rates ... 19
2.6 Summary ...19
III. Methodology ...20
3.1 Chapter Overview ...20
3.2 USAFA Data Collection and Processing ...21
3.3 AFIT Data Collection and Processing ...24
3.3.1 Sensor placement ... 26
3.4 Model testing ...28
3.4.1 Radial basis function (RBF) ... 29
3.5 Summary ...32
IV. Analysis and Results ...33
4.1 Chapter Overview ...33
4.2 Radial basis function results ...33
4.2.1 USAFA RBF Results ... 33
4.2.2 AFIT RBF Results ... 36
4.2.3 Comparison of RBF Results ... 40
4.3 Discussion ...42
4.4 Summary ...43
V. Conclusions and Recommendations ...44
5.2 Recommendation of Research ...44
Appendix A: Self-Estimation R Code...46
Appendix B: Cross-Estimation R Code ...49
List of Figures
Page
Figure 1. Example of the layout of a room at USAFA ... 22
Figure 2. Sensor setup on 8.5” x 11” sheet of paper ... 26
Figure 3. Sensor placement in room AFIT-1 ... 26
Figure 4. Sensor placement in room AFIT-3 ... 27
Figure 5. Sensor placement in room AFIT-4 ... 27
Figure 6. Sensor placement in room AFIT-5 ... 28
List of Tables
Page Table 1. Sensor data collected including data points collected in Vandenberg Hall at the
USAFA. ... 23
Table 2. Summary of data collected from USAFA... 23
Table 3. Total Sensor data collected within AFIT from 11 October – 18 ... 24
Table 4. Summary of data collected from AFIT offices ... 25
Table 5. Correlation matrix generated with recorded USAFA data. Constructed using a Pearson chi-squared statistical test. Largest correlation for occupancy found with CO2. ... 29
Table 6. Correlation matrix generated with recorded AFIT data. Constructed using a Pearson chi-squared statistical test. Largest correlation for occupancy found with CO2. ... 29
Table 7. Individual room self-estimation evaluation utilizing different sized training sets with all collected data. ... 34
Table 8. Model derived using room USAFA-1 training set and applied to other rooms to assess cross-estimation ability. ... 34
Table 9. Model derived using room USAFA-2 training set and applied to other rooms to assess cross-estimation ability. ... 35
Table 10. Model derived using room USAFA-3 training set and applied to other rooms to assess cross-estimation ability. ... 35
Table 11. Model derived using room USAFA-4 training set and applied to other rooms to assess cross-estimation ability. ... 36
Table 12. Individual room self-estimation evaluation utilizing different sized training sets with all collected data. ... 36 Table 13. Individual room self-estimation utilizing different sized training sets using
only the period data of Monday-Friday 0800 – 1600. ... 37 Table 14. Model derived using room AFIT-1 training set and applied to other rooms to
access cross-estimation ability using only the period data of Monday-Friday 0800 – 1600. ... 38 Table 15. Model derived using room AFIT-2 training set and applied to other rooms to
access cross-estimation ability using only the period data of Monday-Friday 0800 – 1600. ... 38 Table 16. Model derived using room AFIT-3 training set and applied to other rooms to
access cross-estimation ability using only the period data of Monday-Friday 0800 – 1600. ... 39 Table 17. Model derived using room AFIT-4 training set and applied to other rooms to
access cross-estimation ability using only the period data of Monday-Friday 0800 – 1600. ... 39 Table 18. Model derived using room AFIT-5 training set and applied to other rooms to
access cross-estimation ability using only the period data of Monday-Friday 0800 – 1600. ... 40
Non-Intrusive Occupancy Detection Methods and Models
I. Introduction
1.1 Background
Occupancy can be described as the presence of humans within the built environment (Gruber, Trüschel, & Dalenbäck, 2014). The presence and behavior of occupants have a profound impact on the energy consumption within facilities (Page, Robinson, Morel, & Scartezzini, 2008). Real-time estimates of occupancy can therefore be used to impact decisions through automated environmental controls, mainly to reduce energy consumption to include lighting and heating, ventilation, and air-conditioning (HVAC). Previous studies have investigated methods of accurately determining occupancy using various combinations of sensors and models; however, a single approach has not been definitely identified as being superior to others (J. Yang,
Santamouris, & Lee, 2016). With this in mind, this study investigated adapting existing approaches to collected data and evaluating the accuracy of derived models to detect occupancy.
1.2 Problem Statement
The purpose of this thesis was to investigate a non-intrusive detection method for determining occupancy within the built environment.
1.3 Research Questions
The focus of this thesis is the evaluation of existing models for determining occupancy using data obtained from the United States Air Force Academy (USAFA) and the Air Force Institute of Technology (AFIT). The goal behind the minimization of the
parameters used for calculations is to reduce the demand for sensors, processor power and storage. Thus, this thesis will addresses the following research questions:
1. Determine the accuracy achievable using minimal environmental parameters to build a radial basis function.
2. Determine the accuracy of a generated model from one room to other rooms within the same facility.
The answers to these questions would provide insight on the current technology and methods for recommendations for the optimization of the facilities on military installations to include HVAC control systems.
1.4 Methodology
Experimental data was collected at the United States Air Force Academy over three periods of time spanning from late 2016 to early 2017. This data included indoor air temperature, relative humidity, and carbon dioxide (CO2)concentration. Surveys were utilized to record presence of occupants in 30-minute blocks. Raw data was
subjected to pre-processing in order to synchronize time, consolidated duplicate data and add descriptors. A second dataset was collected within select AFIT faculty offices to provide indoor environmental information for model development and comparison. The collected data included air temperature, relative humidity, CO2, and motion. The motion data was recorded as events, unoccupied or occupied, for use as the ground truth
identifying when a space was occupied and used for machine learning and testing of models. Motion data was only recorded when there was a state change as opposed to
five-minute interval collection rate which was set for temperature, relative humidity and CO2.
Two existing models were used to analyze the data to determine how they perform with a dataset different from the one from which they were developed. The models utilized varying sets of parameter data, including additional data points that were not captured during the USAFA or AFIT collections. Due to these differences, the models were tailored to accept the inputs available to examine their accuracy within the limited scope. Model accuracy can be further dissected to examine the singular ability of parameters to produce accurate occupancy.
The evaluated model consisted of a radial basis function neural network. The radial basis function used machine learning with a training set to derive a model that could then be used to generate a prediction for comparison to the ground truth. The model generated was evaluated through self-estimation that looked at the ability to predict occupancy on the room it was trained on and also through cross-estimation on other rooms within the same facility.
1.5 Assumptions/Limitations
The occupancy parameter was captured using two methods; surveys filled out by occupants provided the data for USAF and motion detection sensors provided it for AFIT. The surveys were divided into 30-minute time periods with the participant indicating whether or not they were present during that period. This limited the
effectiveness of the model as it was looking at fine detail changes in the other collected parameters of temperature, relative humidity and carbon dioxide. The AFIT occupancy
parameter was captured using motion sensors, which possess their own limitations, such mistakes due to minimal occupant movement or obstructed view of occupants. These limitations were mitigated by ensuring the motion sensor placement provided an unobstructed view of the office but if motion detection sensors were infallible than it would be ideally suited as the single source for occupancy detection. Rooms within USAFA contained two occupants while the rooms at AFIT only had a single occupant.
II. Literature Review
2.1 Chapter Overview
The purpose of this chapter is to identify and discuss relevant research in the realm of occupancy detection sensors, models and other influencing factors that impact occupancy detection. Studies have utilized different combinations of sensor data and various models in order to address occupancy detection and estimation for a wide range of purposes. The chapter will detail motivations, data collection sensors and a selection of models that will be adapted for use on two sets of built environmental data.
2.2 Motivation for interest in occupancy
An increasing number of research studies have been undertaken in the field of detection and estimation of indoor occupancy. The collected parameters and
computational models attempt to produce an accurate snapshot occupants present in the built environment (Chen, Jiang, & Xie, 2018). The purpose of estimating occupancy includes: (1) energy savings through modulation of heating, ventilation and air conditioning (HVAC) systems (Agarwal et al., 2010; Candanedo & Feldheim, 2016; Richardson, Thomson, & Infield, 2008), (2) better regulation of indoor lighting (Guo, Tiller, Henze, & Waters, 2010), (3) security management of occupants and emergency response in the case of emergency situations (Chenda Liao & Barooah, 2010; Depatla, Muralidharan, & Mostofi, 2015; Hutchins, Ihler, & Smyth, 2007; Li, Calis, & Becerik-Gerber, 2012; W. Wang, Chen, & Hong, 2018), (4) providing comfortable and healthy indoor air (Labeodan, Zeiler, Boxem, & Zhao, 2015), (5) lastly the ability to capture the
location and quantity of occupants for mapping purposes for future utilization plans (Chen et al., 2018).
Studies have been performed in order to find accurate methods to determine occupancy in facilities with the goal of energy savings (Dong & Andrews, 2009; Erickson, Carreira-Perpinan, & Cerpa, 2011; Erickson, Carreira-Perpiñán, & Cerpa, 2014). These studies have pointed to energy savings tied to demand-driven
environmental controls that seek to adjust the conditioned space to meet the occupants’ comfort only while occupied. Approximately 40% of facility energy usage globally is consumed to maintain a comfortable and healthy indoor environment within buildings (D’Oca, Hong, & Langevin, 2018; Dounis & Caraiscos, 2009). With growing concern for sustainability, increasing efficiency of building HVAC systems has received increased attention with specific emphasis on how human activity influences energy consumption in the built environment (D’Oca et al., 2018; Mahdavi & Tahmasebi, 2015). Studies are attempting to better understand the human dynamic within the indoor
environment as they seek to capture and translate occupant data into automated building system responses. When properly captured, occupant data can account for energy reductions in excess of one-third of the total HVAC specific energy usage with the highest proposed HVAC related savings being 56% (Sun, Wang, & Ma, 2011; Tachwali, Refai, & Fagan, 2007). However, reported energy savings are conflicted with studies often identifying best case scenarios with a more conservative estimates pointing towards less than 15% (Agarwal et al., 2010; Z. Yang & Becerik-Gerber, 2014).
Energy savings can also be achieved through reductions in indoor lighting usage (Guo et al., 2010). With accurate detection and estimation, artificial lighting usage can
be cut with potential energy savings ranging from 35% to 75% with implemented controls (Leephakpreeda, 2005). These savings are specifically associated with the energy consumption of lighting, which in total is approximately 25% less than the consumption associated with HVAC systems (Pérez-Lombard, Ortiz, & Pout, 2008). Lighting control systems, including motion sensing devices, have been used in
commercial facilities based on promotion within North American and European building codes (Guo et al., 2010). Lighting control systems are realized primarily with
decentralized systems where the sensor and controls are collocated within the room and not connected to an overall management system. Motion sensor control lighting is an affordable and simple way to reduce energy use for indoor lighting. Although motion sensors, in the form of passive infrared (PIR), are most prevalent, there are a number of sensors available to be utilized (Guo et al., 2010).
Another outcome of occupancy data is the usefulness during a crisis with the intent to aid first responders into focused lines of effort to facilitate rescue
(Filippoupolitis, Oliff, & Loukas, 2016). While this is unlikely to provide benefits on a regular basis in a way similar to energy reduction, it still provides a valuable tool without additional investment over the infrastructure needed for occupancy determination
(Tomastik, Lin, & Banaszuk, 2008). Beyond emergency situations, detecting occupancy through automated systems can be a useful security tool in areas where traditional methods of video monitoring is impractical or otherwise ineffective based on facility layout or sensitivity of activities performed within facility. Sensitive activities consist of privacy concerns such as in private offices and restroom but also extend to propriety information.
Lastly, interest in indoor air quality has also sparked interest into occupancy data in order to provide a healthy indoor environment that also caters to occupants’ thermal comfort (Pasut, Arens, Zhang, & Zhai, 2014). Occupants require indoor environments that are comfortable and healthy because on average 90% of their lives will be spent indoors (J. Zhao, Lasternas, Lam, Yun, & Loftness, 2014). The time indoors is divide with the dominant spaces being where they reside and their employment. This point ties back into energy consumption with on average 40% of energy use worldwide used to meet occupant comfort in both residential and commercial settings (D’Oca et al., 2018). Carbon dioxide, an indoor air pollutant, levels are associated with occupancy as humans are the primary source through normal metabolic processes with additional sources resulting from combustion of fuels such as for cooking and heating. Managing indoor air quality requires the introduction of outside air which can come at a cost of energy
consumption to maintain occupant thermal comfort.
2.3 Current occupancy sensing technology
There is a myriad of sensors available that can be used to monitor the indoor environment, but this literature review will focus on sensors that have been used in the creation of models designed to detect and estimate occupancy. Selecting appropriate sensors for the environment being monitored is the first step in creating a model that can provide reliable occupancy estimation. This section will review individual sensors with the understanding that many systems utilized a collection of sensors to provide the necessary data for occupancy detection and estimation. Sensors collect data that can
enable the detection and estimation of occupancy and can be roughly divided into two categories: invasive and non-invasive.
2.3.1 Invasive and Non-invasive
Invasive and non-invasive categories differentiate between data collection methods to address occupant privacy on a scale from least concern to significant concern. While controls can be placed to limit privacy concerns, the ability to abuse or the potential for data breaches of the collected information remain present. These concerns generally arise when data collection methods involve the recording of visual or audio. Examples of invasive methods are audio recording devices, such as microphones and cameras with facial recognition capabilities. Fleuret et al. (2008) was able to successfully demonstrate the use of multiple cameras to provide the number of indoor occupants in their study. While the data collected by these sensors may be able to provide the most precise and reliable occupancy estimates, they may not be appropriate for all environments, such as those that deal with sensitive information or where occupant privacy is a primary concern (Zhenghua et al., 2018). Cameras also have the issue of line-of-sight requirements that are limited in partitioned workspaces as well as requirements for image storage space (Benezeth, Laurent, Emile, & Rosenberger, 2011; Erickson et al., 2009). The concerns raised in regard to the invasive nature of these methods eliminate their utilization for incorporation in this study; therefore, the focus herein will be on non-invasive methods.
2.3.2 Invasive - Visual
Sensors are considered invasive when they collect data that can be tied to individuals. Invasive data collection sensors include visual, audio, and other tracking systems. Audio recordings can be differentiated between human sources, video recordings can utilize facial recognition software get accurate counts, and tracking systems can pick up on occupant carried items. These examples are not all inclusive of the ways to interpret data to determine occupancy but include the most prominent methods. All of these examples, however, can be utilized to distinguish the individual and potential expose sensitive information. The collection methods have shown themselves to be highly accurate as Fleuret et al. (2008) successfully demonstrated the use of multiple cameras to provide the number of indoor occupants in their study. While the data collected by these sensors may be able to provide the most precise and reliable occupancy estimates, they may not be appropriate for all environments (Zhenghua et al., 2018). The precision resulting from cameras has led to their utilization in a number of studies.
2.3.3 Invasive – Audio
Although no studies were found utilizing audio recording, it could be similarly utilized but would require highly complex computational systems to provide estimation (Fleuret, Berclaz, Lengagne, & Fua, 2008). This refers to specific quantity estimates with simple detection possible when recognizable sounds or voices are observed. Due to the complexity, visual methods are generally preferred for occupancy estimation as deciphering voices in a crowded
room is problematic. Also, there can be issues when there are no voices to record for the sensors such as when occupants are not speaking.
2.3.4 Non-invasive methods
Non-invasive methods rely on environmental sensors that collect data on items to include carbon dioxide levels, temperature, relative humidity, light, motion and sound. Sound is referring to any noise and differs from audio, as long as it does not seek to ascertain the number of occupants though vocal recognition. In this case, it is similar to a motion sensor in collecting a single event measure in decibels. This is of course not an exhaustive list of environmental variables that can be collected as temperature, for instance, can be further refined by looking at specific office equipment that contributes sensible heat to the indoor environment when used by occupants. While these parameters are non-invasive, they still can be accurate predictors of occupancy as they are directly influenced by the
presence of occupants (Chen et al., 2018). The difficulty can arise in determining which parameters to collect. Carbon dioxide levels are the best indicator of occupancy when compared to other environmental sensors. (Candanedo, Feldheim, & Deramaix, 2017; Dong et al., 2010). However, limitations are present with carbon dioxide-dependent models; however, shortfalls can be alleviated by including additional sensors.
2.3.5 Carbon dioxide (CO2)
Carbon dioxide (CO2) is an effective tool in occupancy determination and estimation (Candanedo et al., 2017; Dong et al., 2010). Use of only this collected parameter has shown predictive capabilities; however, it is limited to detecting the
presence or conversely the absence of occupants and was not able to reliably estimate the quantity (Ansanay-Alex, 2013). Humans are the primary source of CO2 in the built environment which ties changes in concentrations directly to human presence however generation rates can vary with age, gender and activity levels all factoring in on metabolic process that expels CO2 into a space. Carbon dioxide monitoring is limited by the effects of ventilation on the concentrations being altered through the function of HVAC systems or natural ventilation of opened doors and windows (Calì, Matthes, Huchtemann, Streblow, & Müller, 2015). These factors were included in models using this parameter such as in Cali et al. (2015). The ability of CO2 concentration measurements to be used in
detection and estimation of occupancy has been successful demonstrated in several other studies (Chen et al., 2018; Szczurek et al., 2016; Weekly, Bekiaris-Liberis, Jin, & Bayen, 2015; Zuraimi et al., 2017). Issues are present with CO2 concentration-based estimation and detection as there is a delay associated with CO2 levels due to slow spread based on the mixing characteristic of the indoor space (Chen et al., 2018). This shortfall can be mitigated by combining other sensory data. Passive ventilation also places limitations on CO2 sensor-based systems in their ability to detect real time occupancy conditions.
2.3.6 Ambient sensors
Ambient sensors can be described as environmental sensors that monitor items to include temperature, relative humidity, light and pressure (Yang,
Becerik-Gerber, Li, & Orosz, 2014). Ambient sensors have been found to be less reliable as an occupancy predictor when singularly utilized; however, success has
been achieve when combined with other parameters (Z. Yang, Li, Becerik-Gerber, & Orosz, 2012). Combined with CO2 data, this information can help refine the occupancy detection output, particularly in the case of temperature, relative humidity and light (Candanedo & Feldheim, 2016; Kraipeerapun &
Amornsamankul, 2017). Temperature and relative humidity can be impacted by human activity as humans generate heat and moisture. Additionally, heat from sunlight and electronic items to include lights, cooking, and computers. Light levels can be tied to human interaction with indoor electric devices such as display monitors and artificial lighting (Page et al., 2008). Limitations still exist with these detection methods as direct sunlight can effect temperature and humidity measurements and can influence the light intensity levels detected by sensors.
2.3.7 Position tracking
Electronic tracking has been utilized to determine occupancy based on the number of electronic device connections within a facility (Depatla et al., 2015; Zou, Jiang, Yang, Xie, & Spanos, 2017). This detection method can be readily adapted if wireless service is already present as it would only require a method to interpret the collected data. Signal strength is used to determine distance from a set point with a framework of wireless devices used to monitor the area of interest. This method relies on occupants to possess devices have the ability to connect and are connected to the wireless network. Accuracy levels of this detection method are directly tied to number of connections and can high
network. Issues can arise when occupants use multiple devices on the network causing a false count (Christensen, Melfi, Nordman, Rosenblum, & Viera, 2014). Bluetooth can similarly be used with single strength used to determine location in a given area with one study demonstrating best when used for shorter ranges and further improved when signals can be detected at multiple points in a network (Fernandes, Santos, & Milidiú, 2010; Hallberg & Nilsson, 2003). Other tracking devices include radio frequency identification (RFID) and global position systems (GPS). RFIDs can be incorporated with identification badges to register
individuals within a set area (Li et al., 2012). GPS was demonstrated by using personal smart phones to track occupants both indoors and outdoors with individuals tracked while transitioning between areas (Zhao, Zeiler, Boxem, & Labeodan, 2015). Knowledge of occupants arriving to a facility was proposed to drive HVAC operations similarly as entry into specific rooms within a facility.
Motion and beam break detection can be accomplished using passive infrared (PIR) and radar technology. Several studies utilized PIR along with other combinations of sensors, such as CO2, temperature, and sound, with accuracies in excess of 75% (Agarwal et al., 2010; Dodier, Henze, Tiller, & Guo, 2006;
Ekwevugbe, Brown, Pakka, & Fan, 2013; Meyn et al., 2009). Beam breaks have been utilized on choke points, such as doors, to aid in counts, however, it is difficult to determine the direction of travel and classify events as either being an occupant or an object (Dedesko, Stephens, Gilbert, & Siegel, 2015). Radar has been utilized in occupant counts with limited success with the issues arising with
soft targets, lack of line of sight, distance normalization, and movement uncertainty (He & Arora, 2014).
Power consumption is another value that can be collected to provide data for occupancy modeling since many indoor occupants utilize some form of electronic device or utility, such as hot water (Dong & Lam, 2014). Power consumption data has not been shown to work well unless combined with other parameters and can require extensive work to monitor outlets, water heaters and other electrical appliances (Kleiminger, Beckel, Staake, & Santini, 2013; Page et al., 2008).
2.4 Existing models and theories for occupancy determination
The study of methods for detecting and estimating occupancy is active with numerous examples of examine and build upon published in the last three years. Three review studies spanning from 2016 to 2018 examined the different parameters, methods and models, formulated to determine occupancy with over 20 examples identified in literature reviews (Candanedo & Feldheim, 2016; Chen et al., 2018; J. Yang et al., 2016). The models were investigated to attempt to determine the best combination of parameter data along with model formulation to result in the most predictive tool for occupancy detection and estimation. Existing models contain various collections of parameter data and multiple approaches to modeling the collected data into accurate and actionable outputs. Many models use a similar set of collected parameters with carbon dioxide, temperature, and relatively humidity, being present in most research. Many of these
parameters, whether intended or not, facilitate occupancy privacy by not using invasive video monitoring or audio recording systems.
2.4.1 Radial basis function (RBF)
Radial basis functions are based on artificial neural networks, which are vaguely based off biological neural networks that form animal brains (Broomhead & Loewe, 1988). These networks form a framework that enables machine
learning to occur with complex inputs and outputs used to train, validate and test datasets to find functions that best approximate future outputs given a set of inputs. This type of model is described as a feed forward network with three layers: sensors inputs, hidden layer functions, and an output response (Palm, Schwenker, & Kestler, 2001). During the training and validating phases of learning, the function determines the weights associated with each input in
determining the response or output. Accuracy of this method can be evaluated by comparing estimated occupancy with ground truth data. Additionally, the model can be evaluated by looking at the root mean square error (RMSE) generated by comparing the actual and predicted output values.
Radial basis functions are used to take unrelated inputs and produce outputs. This is suitable for occupancy as there is wide range of data with unique parameters that can be brought together using this RBF. RBF produces weights for the parameters in the hidden layers through machine learning from training samples combining multiple factors to produce a final output. RBF is uniquely suited to occupancy detection based on the presence of a wide range of variables
and variations including numbers of occupants, HVAC systems, and natural ventilation. (Chen & Soh, 2017). An example of an RBF was found in one study that sought to provide occupancy data to support demand driven HVAC
operations using a multi-sensor method (Yang et al., 2012). The multi-sensor approach utilized the collection of CO2, temperature, relative humidity, light, sound and motion. These parameters were combined to produce a high-resolution model that had an accuracy of approximately 85% while remaining non-invasive through the selection of sensors. In addition to occupancy detection, this model was able to estimate the exact quantity of occupants with 85% accuracy, which further reinforced the capability of the model derived in this study. These accuracy rates were tied to environments where the training and validation were conducted on the same space and the model was observed to be less capable when applied to a different space within the same facility with an accuracy of 66%. Explanations for this departure are offered with issues found with data points being corrupted based on wireless internet issues and problems with the
calibration of the environmental sensors for temperature, relative humidity and CO2. This issue of the model performing poorly when applied to an environment outside of the training and validation presents itself in more studies than this one which highlights the difficulty of applying a one-size fits all method to multiple indoor spaces.
2.5 Confounding factors
There are a number of factors that influence the ability of systems to accurately capture occupancy data, including ventilation, room size, HVAC configuration, and the number of people. Additionally, sampling rates can play a factor for data storage and timely system responses to inputs.
2.5.1 Ventilation
Ventilation, either natural or artificial, can alter indoor air temperature, relative humidity and dilute air pollutant concentrations such as CO2 (Calì et al., 2015; Weekly et al., 2015). Ventilation can be quantified by measure air exchange rates and incorporating them into any model (Zuraimi et al., 2017). Accurately measuring air exchanges rates enabled a CO2 model to achieve accuracy of 70% for occupancy prediction when applied to rooms with more than 35 occupants (Zuraimi et al., 2017). Although CO2 is one of the best indicators of occupancy, accuracy can be affected by lag issues which diminish the ability to detect in real time because of the slow rate of buildup and decay of concentrations within an indoor space.
2.5.2 Diversity of indoor environments
Indoor environments can range from residential to commercial to
industrial. These environments present unique challenges to occupancy detection. A majority of studies examine office spaces with fewer investigating hospitals and even residential (Dedesko et al., 2015; Lomas & Giridharan, 2012; Pérez-Lombard et al., 2008; C. Wang, Yan, & Jiang, 2011). Rooms generally are small with single occupants but there are cases of studies that utilized open areas divided with partitions (Chen & Soh, 2017). Focusing on single-occupant rooms
simplifies occupancy models as the primary response is either occupied or not. When dealing with multiple occupants, methods collecting ambient
environmental data is less reliable
2.5.3 Data collection rates
While no definitive resolution rates have been set, studies have indicated that higher rates of data collection lead to better prediction outcomes (Chen & Soh, 2017; Richardson et al., 2008). For example, Chen and Soh (2017)
examined four intervals (2 hours, 1 hour, 30 minutes and 15 minutes) with results indicating a steady increase in the accuracy with increased frequency of
collection. Two studies utilized a resolution rate of 10 minutes, although no rational was presented (Derbez et al., 2014; Richardson et al., 2008).
2.6 Summary
This chapter described the motivation for occupancy detection and estimation, current occupancy sensor technology, existing models and theories and other influencing factors. The motivation behind the study of occupancy is well covered with common themes seen in much of the existing literature. The list of available sensors and models for detecting occupancy is longer than could be adequately addressed in this chapter with new studies regularly introducing new sensor combinations and methods. This look focused on combinations of sensors that could be used to derive models such as those listed in this chapter with clear distinctions made between invasive and non-invasive sensors. Finally, the influencing factors for determining occupancy were covered with their effects described.
III. Methodology
3.1 Chapter Overview
The purpose of this chapter is to explain the methodology used to estimate
occupancy through the use of sensors with two sets of indoor data collected and analyzed using models based on radial basis functions. Each model was independently trained with
testing being applied to the same dataset from which it was trained and also on other rooms within the same facility.
3.2 USAFA Data Collection and Processing
One set of built environment data collection occurred in four rooms in a single dormitory at the United States Air Force Academy (USAFA) in Colorado Springs, Colorado. All participants were consenting volunteers and the study was approved by USAFA Institutional Review Board (FAC20160046H). All four rooms were located on the sixth floor in Vandenberg Hall. All of the rooms had two occupants with identical design and furniture layout. One door in each room provided access to a central corridor that contained a communal bathroom and common areas. Large windows marked the opposite wall from the door with either a building interior view facing into a central courtyard or an exterior view away from the building. The ceiling height was
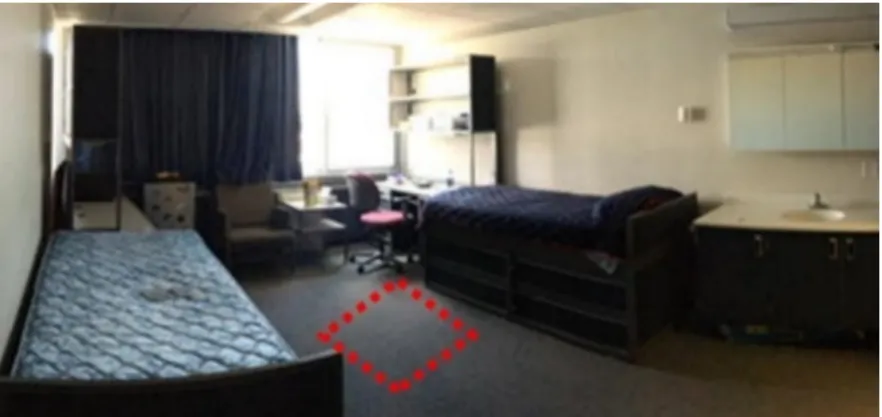
approximately 3 m with a floor area of approximately 14 m2, for a total approximate room volume of 42 m3. An example of the rooms sampled can be seen in Figure 1. Rooms were categorized into squadrons that contain approximately 100 cadets per squadron and live in the same area of the building. Occupants did not change rooms during the sampling period.
Figure 1. Example of the layout of a room at USAFA
Each room was equipped with a centrally controlled radiator that provided heating through an off-site heat plant. No air conditioning was present in the rooms. Temperature could be regulated by use of the two exterior windows and one interior door. The door and window were the only occupant-controlled natural ventilation in the rooms.
Additional natural ventilation occurred through penetrations in the building envelope and interior walls. Occupants were free to open the door and windows; however, at night the door was always closed as a matter of policy.
Indoor sampling was conducting using commercially available sensors. Sensors were placed in identical locations in each room, approximately six feet from the window and five feet above the floor. Carbon dioxide, temperature, and relative humidity were recorded with a Green Eye TM12 Desktop CO2 & RH/T Monitor (CO2 Measurement Specialists, Ormond Beach, FL, USA). Manufacturer provided sampling error was the following: carbon dioxide (±40 ppm or ±3% of reading), relative humidity (±5%) and temperature (±0.9°F). The HOBO datalogger U12-012 (Onset, Bourne, MA, USA) recorded temperature (±0.63 °F), relative humidity (±2.5%) and light intensity. For seven rooms that did not have a Green Eye, a Telaire TEL-7001 CO2 sensor (GE Sensing,
Billerica, MA, USA), measured carbon dioxide levels (±50 ppm or 5% of reading %) with data recorded on the HOBO data logger.
The conditions of the built environment were monitored during 21 Aug 2016 – 2 Sept 2016 for USAFA-1, 21 Aug 2016 – 3 Sept 2016 for USAFA-2, 28 Aug 2016 – 3 Sept 2016 for USAFA-3, and 18 Aug 2016 – 27 Aug 2016 for USAFA-4. Data was collected continuously during these dates with readings recorded at five-minute intervals. Room data was collected independently with compilation occurring at the end of the collection period. The total number of data points suitable for model generation within the rooms is shown in Table 1. A summary of the collected data is shown in Table 2.
Table 1. Sensor data collected including data points collected in Vandenberg Hall at the USAFA.
Room USAFA-1 USAFA-2 USAFA-3 USAFA-4
Data points 14976 14980 8064 11520
Table 2. Summary of data collected from USAFA
Temperature (F) RH (%) CO2 (ppm)
Min 61.8 19.8 380
Median 75.2 37.2 570
Mean 75.07 38.33 659
Max 83 70.8 3017
Sensor data was uploaded utilizing the software provided by the sensor manufacturers. The data points from the individual sensors were saved in Microsoft Excel ver. 1812 (Microsoft, Redmond, WA), format and compiled into a single
worksheet for analysis. In addition to the raw data, additional metadata was added on the orientation of windows. Duplicate data was removed for temperature and relative
Onset was kept because of a higher accuracy with temperature error of ±0.63 °F and relative humidity error of ±2.5% compared to error values of ±0.9°F and ±5% for the Green Eye sensor.
3.3 AFIT Data Collection and Processing
A second dataset was collected from five single-occupant offices in the building 646 at the Air Force Institute of Technology (AFIT) over the course of one week from 11 October 2018 to 18 October 2018 (Table 3). The offices had a single access point that opened into a suite with multiple other single-occupant offices and connected to a main corridor. A single window spanning the width of the room was located along the opposite wall from the door which could be opened for natural ventilation. Each office was conditioned with both heating and cooling provided however temperatures are centrally regulated with no occupant control.
Table 3. Total Sensor data collected within AFIT from 11 October – 18 Room AFIT-1 AFIT-2 AFIT-3 AFIT-4 AFIT-5
Data points 8056 8056 8056 8056 8056
Three data collection sensors were used to record the environmental parameters which included temperature, relative humidity, light, and CO2. An additional data point was collect for each interval to capture the occupancy ground truth which was
accomplished with a motion sensor. Data collection was performed using two of the same sensors in the USAFA study—the HOBO data logger U12-012 and the Green Eye Sensor. An additional sensor for AFIT was the HOBO Extended Memory
samples were taken continuously in five-minute intervals producing a total of 10,070 data points for each the equipped offices. The motion sensor recorded either 0 or 1 depending on the presence of motion and only recorded when there was a change to this event, which is different that the continuous nature of the environmental sensors. The data collection sensors were undisturbed during the entirety of the data collection period. Actual times were recorded at both the beginning and end of the collection phase to ensure that internal timestamps could be synced with actual time in order to marry the data between the sensors and to rectify timestamp discrepancies. The data was compiled in the same manner as the USAFA data utilizing Microsoft Excel. No device errors or missed data points were found in the compiled data. Ranges of collected values within the four USAFA dormitory rooms can be seen in Table 4.
Table 4. Summary of data collected from AFIT offices Temperature (F) RH (%) CO2 (ppm)
Min 59.93 33.94 381
Median 65.75 49.63 514
Mean 66.1 48.92 569
3.3.1 Sensor placement
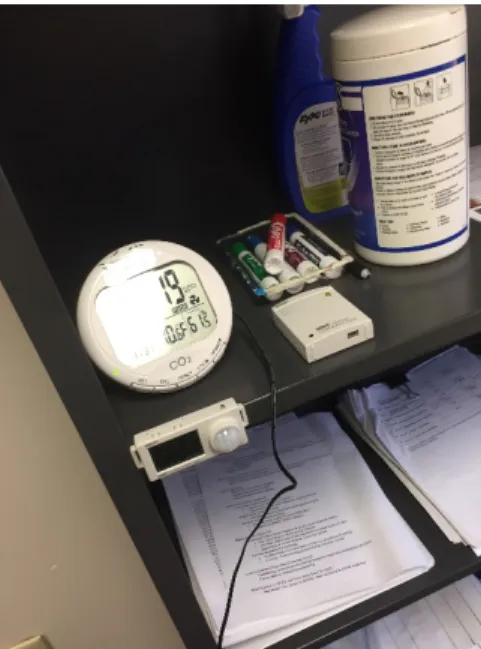
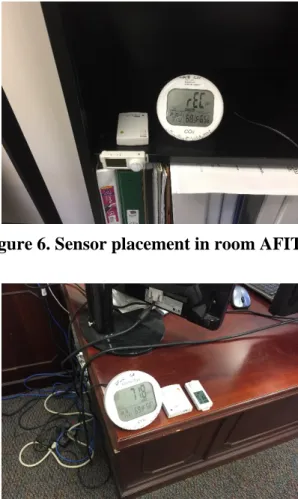
Four of the rooms had the sensors placed on metallic bookshelves located as seen in Figures 3-6. These sensors were approximately four feet from the floor and at least four feet from the window. One office lacked a similarly metallic bookshelf; therefore, the corner of a wooden desk was utilized (Figure 7). Sensors were located away from direct sunlight in all offices. The CO2 sensor required an electric outlet while the other two devices contained internal batteries.
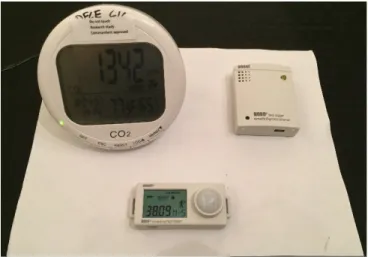
Figure 3. Sensor placement in room AFIT-1 Figure 2. Sensor setup on 8.5” x 11” sheet of paper
Figure 4. Sensor placement in room AFIT-3
Figure 6. Sensor placement in room AFIT-5
Figure 7. Sensor placement in room AFIT-2
3.4 Model testing
One model was studied to determine the effectiveness at predicting occupancy with the collected datasets. The model was based on an existing method derived from the radial basis function through the use of a neural network. Radial basis functions were demonstrated in literature to be able to predict occupancy with inputs including those investigated in this study but also include motion, sound and light input parameters ( Yang et al., 2012). A correlation matrix was generated for both the USAFA and AFIT datasets (Tables 5 and 6). The matrices were generated with Pearson chi-squared tests with p-values indicating all values to be significant. Correlation between relative
humidity and temperature were the same between both datasets with the value being -0.47 representing an inverse correlation which is expected for indoor environments. The largest correlation for occupancy was CO2 for both datasets.
Table 5. Correlation matrix generated with recorded USAFA data. Constructed using a Pearson chi-squared statistical test. Largest correlation for occupancy
found with CO2. Temp RH CO2 Occupancy Temp 1 RH -0.47 1 CO2 0.21 0.12 1 Occupancy 0.06 0.086 0.16 1
Table 6. Correlation matrix generated with recorded AFIT data. Constructed using a Pearson chi-squared statistical test. Largest correlation for occupancy
found with CO2. Temp RH CO2 Occupancy Temp 1 RH -0.47 1 CO2 0.61 -0.19 1 Occupancy 0.26 -0.09 0.45 1
3.4.1 Radial basis function (RBF)
Radial basis functions were realized using the open source software R Studio, version 3.5.0 (RStudio, Inc., Boston, MA), incorporating two packages. The first package “readxl” enabled the program to receive datasets from
Microsoft Excel. The second package used was the Stuttgart Neural Network Simulator also known as “RSNNS”, which enabled radial basic function modeling. Radial basis functions require preset values in order to perform the learning function that it used for prediction. Default parameters were used with
the exception of the number of units in the hidden layer which was manipulated to measure the effect on model accuracy. There was no clear consensus in literature for selecting the quantity of hidden layer units; therefore, several tests were run with a range of hidden layer values. The test using a hidden layer of four units was found to produce the peak accuracy with the number of inputs and output parameters present in this study. Similarly, there was a lack of consensus on the amount of data required to adequately train a model; therefore, 20% and 25% were chosen with the intent of preserving the majority of the dataset for testing.
USAFA dormitory and AFIT office data was compiled into a single dataset with all rooms represented as well as separate sheets with individual rooms data all containing four parameters: CO2, temperature, relative humidity and occupancy. The data was divided between inputs and outputs. Inputs consisted of CO2, temperature, and relative humidity. The output set was simply the occupancy data which would be used at the target or ground truth for the model. The full dataset as well as the individual rooms were each trained and validated using a random 20% or 25% of the dataset. The remainder of the dataset was used for testing the radial basis function to determine overall accuracy. The output from the function was filtered with negative values interpreted as
indicating that the space was unoccupied and positive values interpreted as the space being occupied. These values were formed a predicted results column within the dataset for comparison. The RBF predicted occupancy data was compared to the actual occupancy data collected by the motion sensor to attain an overall accuracy value.
3.4.1.1 Self-estimation
Self-estimation consisted of radial basis functions which were trained, validated and tested, on the same set of data collected from a single room to determine the accuracy of the model when applied to the environment on which it was derived. Larger scale models were also generated with the complete dataset for each facility to evaluate the ability to train a model that can be applied to all rooms within similar
characteristics. Training sets of 20% and 25% were selected from the data being used to train the model. Results of the testing were then compared to the target dataset to calculate the model accuracy. This sought to determine the ability of a model derived from a single environment to accurately predict occupancy. An example of the R code used to perform self-estimation is located in Appendix A.
3.4.1.2 Cross-estimation
Cross-estimation consisted of training the RBF model with a set of data and applying the model to the remaining data contained in other rooms to assess predictive ability across similar indoor environments. The training set was randomly selected from the data collected from the room being modeled with two iterations consisting of 20% and 25%. Cross-estimation was only conducted using data from the same facility; therefore, models trained using the USAFA data was not tested on the AFIT data and, conversely, models trained with the AFIT data was not tested on USAFA data. Time filtered sets were applied to both training
and testing data to maintain consistency. An example of the R code used to perform self-estimation is located in Appendix B.
3.5 Summary
This chapter explored the methods conducted in this study from data collection and processing to model development and testing. The two independent indoor
environmental data sources provide distinctly different settings with one being a residence, albeit within a larger facility similar to an apartment building, and the other consisting of offices that presents a commercial setting. These settings pose unique looks at how the indoor environment is utilized with occupancy occurring at different periods of time with one primarily occupied during the night and the other during the day.
IV. Analysis and Results
4.1 Chapter Overview
This chapter details the results of the models tested on the collected data and presents the accuracy of the models. Several iterations of the results are presented based on the data examined with a look at the complete dataset for each facility and individual rooms. The results are defined as the models accuracy rate in form of a percentage.
4.2 Radial basis function results
Radial basis functions were trained through the use of forming training sets of 25% and 20% of the total available data. The sets were rounded down to the nearest whole number when decimals were present. All models used four units in the hidden layer with all other parameters remaining default to the program. Models were generated for groups of data in facilities and for individual rooms. Radial basis functions were able to accurately predict occupancy with a range of 48% to 68% of the total datasets.
4.2.1 USAFA RBF Results
A radial basis function was developed utilizing the USAFA dormitory room data for training, validation and testing. The first iteration of testing consisted of looking at individual each room’s ability to detect occupancy. The models were trained, validated and tested on the same room to accomplish this with the results shown in Table 7. The highest accuracy rate was 68.15% for room USAFA-3 and the lowest accuracy was 50.15% in room USAFA-2.
Table 7. Individual room self-estimation evaluation utilizing different sized training sets with all collected data.
Room Training 25% Training 20%
USAFA-1 66.99% 66.99%
USAFA-2 50.15% 51.24%
USAFA-3 68.15% 68.15%
USAFA-4 55.49% 55.49%
Cross-estimation using the model trained on room USAFA-1 is shown in Table 8. The training set for the model was 936 rows and 748 rows, representing 25% and 20% respectively, of the total which consisted of 3744 rows. The accuracy rate of the model derived from USAFA-1 was the same for all rooms and training set sizes with the exception of room USAFA-2 with the 20% training set size where it was less than the self-estimated value.
Table 8. Model derived using room USAFA-1 training set and applied to other rooms to assess cross-estimation ability.
Room Training 25% Training 20%
USAFA-1 66.99% 66.99%
USAFA-2 50.15% 50.15%
USAFA-3 68.15% 68.15%
USAFA-4 55.49% 55.49%
Cross-estimation using the model trained on room USAFA-2 is shown in Table 9. The training set for the model was 936 rows and 749 rows, representing 25% and 20% respectively, of the total which consisted of 3745 rows. The highest accuracy rate was found in the room USAFA-3 with 68.15%. Accuracy in rooms USAFA-4 and USAFA-1 with 20% training set size was increased slightly with values remaining the same.
Table 9. Model derived using room USAFA-2 training set and applied to other rooms to assess cross-estimation ability.
Room Training 25% Training 20%
USAFA-1 66.99% 67.15%
USAFA-2 50.15% 51.24%
USAFA-3 68.15% 68.15%
USAFA-4 55.49% 56.08%
Cross-estimation using the model trained on room USAFA-3 is shown in Table 10. The training set for the model was 504 rows and 403 rows,
representing 25% and 20% respectively, of the total which consisted of 2016 rows. The highest accuracy rate was found in the room from which the model was derived, USAFA-3, with 68.15%. All other rooms maintained similar
accuracy rates when compared to the self-estimation models with room USAFA-2 decreasing slightly with the 20% training set.
Table 10. Model derived using room USAFA-3 training set and applied to other rooms to assess cross-estimation ability.
Room Training 25% Training 20%
USAFA-1 66.99% 66.99%
USAFA-2 50.15% 50.15%
USAFA-3 68.15% 68.15%
USAFA-4 55.49% 55.49%
Cross-estimation using the model trained on room USAFA-4 is shown in Table 11. The training set for the model was 720 rows and 576 rows,
representing 25% and 20% respectively, of the total which consisted of 2880 rows. The highest accuracy rate was found in the room from which the model was derived, USAFA-3, with 68.15%. All other rooms maintained similar
accuracy rates when compared to the self-estimation models with room USAFA-2 decreasing slightly with the 20% training set.
Table 11. Model derived using room USAFA-4 training set and applied to other rooms to assess cross-estimation ability.
Room Training 25% Training 20%
USAFA-1 66.99% 66.99%
USAFA-2 50.15% 50.15%
USAFA-3 68.15% 68.15%
USAFA-4 55.49% 55.49%
4.2.2 AFIT RBF Results
A radial basis function was developed utilizing the AFIT office data for training, validation and testing. The first function used all data points in a randomized list with no distinctions made for individual offices or time. The model was able to accurately predict occupancy 14% (0.140) of the time utilizing 25% of the dataset to derive the function and 17% (0.174) accurate at prediction when using 20% of the dataset to derive the function. Additional functions were created for each individual office with the results shown in Table 12.
Table 12. Individual room self-estimation evaluation utilizing different sized training sets with all collected data.
AFIT-1 29.1% 30.6%
AFIT-2 24.6% 29.6%
AFIT-3 24.3% 32.0%
AFIT-4 29.6% 28.1%
AFIT-5 31.3% 24.1%
Additional radial basis functions were derived using a condensed dataset with a set period of time sampled, 0800 – 1600, representing normal working hours. The training was again performed using 20% and 25% of the filtered data. The model was able to accurately predict occupancy 50% (0.506) when trained with both the 20% and 25% complete work hour dataset which combined all sensor data collected from the rooms. The resulting accuracy of RBF derived with only work hour data for each individual room is shown in Table 13.
Table 13. Individual room self-estimation utilizing different sized training sets using only the period data of Monday-Friday 0800 – 1600.
Room Training 25% Training 20%
AFIT-1 48.24% 48.45%
AFIT-2 49.07% 49.90%
AFIT-3 54.04% 54.45%
AFIT-4 49.28% 49.69%
AFIT-5 52.17% 50.31%
Cross-estimation using a model trained on room AFIT-1 is shown in Table 14. The data was time filtered to show only Monday through Friday 0800 – 1600. Each set of data consisted of 483 rows containing four parameters for a total of 1,932 data points for the model to test prediction. The training set consisted of 20% and 25% of the total data collected from the room.
Table 14. Model derived using room AFIT-1 training set and applied to other rooms to access cross-estimation ability using only the period data of
Monday-Friday 0800 – 1600.
Room Training 25% Training 20%
AFIT-1 48.24% 48.45%
AFIT-2 49.07% 49.07%
AFIT-3 54.24% 54.04%
AFIT-4 48.45% 48.45%
AFIT-5 50.31% 50.31%
Cross-estimation using the model trained on room AFIT-2 is shown in Table 15. The data was time filtered to show only Monday through Friday 0800 – 1600. Each set of data consisted of 483 rows containing four parameters for a total of 1,932 data points for the model to test prediction. The training set consisted of 20% and 25% of the total data collected from the room.
Table 15. Model derived using room AFIT-2 training set and applied to other rooms to access cross-estimation ability using only the period data of
Monday-Friday 0800 – 1600.
Room Training 25% Training 20%
AFIT-1 48.45% 48.45%
AFIT-2 49.07% 49.90%
AFIT-3 54.04% 54.04%
AFIT-4 48.45% 48.45%
AFIT-5 50.31% 50.31%
Cross-estimation using the model trained on room AFIT-3 is shown in Table 16. The data was time filtered to show only Monday through Friday 0800 – 1600. Each set of data consisted of 483 rows containing four parameters for a total of 1,932 data points for the model to test prediction. The training set consisted of 20% and 25% of the total data collected from the room.
Table 16. Model derived using room AFIT-3 training set and applied to other rooms to access cross-estimation ability using only the period data of
Monday-Friday 0800 – 1600.
Room Training 25% Training 20%
AFIT-1 48.45% 48.45%
AFIT-2 49.07% 48.65%
AFIT-3 54.04% 54.45%
AFIT-4 48.45% 48.45%
AFIT-5 50.31% 50.31%
Cross-estimation using the model trained on room AFIT-4 is shown in Table 17. The data was time filtered to show only Monday through Friday 0800 – 1600. Each set of data consisted of 483 rows containing four parameters for a total of 1,932 data points for the model to test prediction. The training set consisted of 20% and 25% of the total data collected from the room.
Table 17. Model derived using room AFIT-4 training set and applied to other rooms to access cross-estimation ability using only the period data of
Monday-Friday 0800 – 1600.
Room Training 25% Training 20%
AFIT-1 48.24% 48.65%
AFIT-2 49.28% 49.07%
AFIT-3 54.24% 54.04%
AFIT-4 49.28% 49.69%
AFIT-5 50.72% 50.72%
Cross-estimation using the model trained on room AFIT-5 is shown in Table 18. The data was time filtered to show only Monday through Friday 0800 – 1600. Each set of data consisted of 483 rows containing four parameters for a
total of 1,932 data points for the model to test prediction. The training set consisted of 20% and 25% of the total data collected from the room.
Table 18. Model derived using room AFIT-5 training set and applied to other rooms to access cross-estimation ability using only the period data of
Monday-Friday 0800 – 1600.
Room Training 25% Training 20%
AFIT-1 48.45% 48.45% AFIT-2 49.07% 49.07% AFIT-3 54.04% 54.04% AFIT-4 48.65% 48.45% AFIT-5 52.17% 50.31% 4.2.3 Comparison of RBF Results
The RBF study presented in Chapter 2 attained accuracy rates of 86% to 88% for self-estimation while the accuracy rates associated with the RBF performed using the USAFA and AFIT data peaked at 68% with the majority of accuracy rates around 50%. The difference in accuracy rates can be attributed to several variations between the studies. First, the study identified in the literature review examined the additional environmental parameters of light, sound and motion, with each being included in model creation. The inclusion of these extra inputs would be expected to produce higher accuracy rates. The RBF in this thesis sought to produce the highest accuracy rates when looking at just CO2, temperature and relative humidity. Second, the study did not describe the
parameters set for RBF generation, which could be expected to contain additional hidden layer units to accommodate the extra inputs. Beyond the hidden layer, there are initialization values used to train the RBF functions which were
unknown. This information could improve the refinement of the model, thus increase the accuracy rates.
The self-estimation results based on the USAFA and AFIT data contain some overlap with the USAFA accuracy rates ranging from 50.15% to 68.15% and the AFIT accuracy rates ranging from 48.24% to 54.45%. Between these two datasets, the USAFA derived RBF performed better than the AFIT derived
models. The dual occupancy found in the USAFA rooms could have influenced this result as there was more often at least one occupant present in the room. Another factor could be the higher percentage of occupancy recorded based on the occupants being in their rooms for approximately 8 hours every night. The AFIT office data was narrowed down to what was considered peak occupancy periods during the work day but never approach the same occupancy rates found at USAFA. This tied with only single occupant could have limited the effectiveness of the model to accurately predict with similar results to the USAFA models.
The cross-estimation results produced in the reference study were lower than the estimation with a range of 63% to 66% compared to the
self-estimation accuracy rates of 86% to 88%. The cross-self-estimation accuracy rates for USAFA ranged between 50% and 68%, which is comparable to the results
previously cited study. That study was smaller in scope-only looking at two room, while the USAFA data looked at four. When considering at the best two fit USAFA rooms, the accuracy range narrows to 66% to 68%, which is slightly higher than the other study. The AFIT data produced a less desirable accuracy rate range of 48% to 54%. Applying a similar idea to the number of rooms as
what was mentioned for the USAFA data does not drastically improve range with the two best fit rooms only ranging 50% to 54%. Even with increased rooms for comparison, both the USAFA and AFIT cross-estimation models maintained a consistent level of accuracy indicating that cross-estimation is a viable method for applying models within similar indoor environments.
The AFIT accuracy rates were expected to more closely relate to the cited study as they were both performed in commercial facilities. Both settings would be expected to have normal working hours where the majority of occupants would be present. AFIT data supported this theory with occupancy primarily occurring during the day. Conversely, the USAFA data was collected in a residential setting with much of the occupancy for approximately 8 continuous hours each night. The collected data supported this idea with unoccupied periods occurring during the day.
4.3 Discussion
Results for the cross-estimation using USAFA datasets were the same across each model which likely indicates an error. Each iteration of model training began with a clear workspace with datasets freshly loaded to ensure no previous data was captured
inadvertently for the new iteration. This effort still did not remedy the issue of each model having the same accuracy rate regardless of the model training set origin. The AFIT data suffered similarly with very similar accuracy rates during cross-estimation. An issue may have been present in the interpretation of the outputs produced by the radial basis function model when calculating prediction values based on testing datasets.
The difference in accuracy rates between the two facilities was examined with the overall datasets thought to have impact the results since USAFA had a larger size which increases the training set size as it was based on percentages. This was tested by drawing training sets that matched in size those used in the AFIT model creation. The results were relatively unchanged from those found using the set percentages of the USAFA data.
4.4 Summary
This chapter details the results of the models tested on the collected data and presents the accuracy of the models. Models derived from the entire collected datasets from the facility did poorly when compared to the individually derived models. Cross-estimation was able to demonstrate the ability of models derived within a facility to be applied to other rooms while maintaining similar accuracy rates.
V. Conclusions and Recommendations
5.1 Conclusion
The radial basis function self-estimation test results show that the proposed models can yield accuracy estimates of approximately 50% for determining the presence of at least one occupant. Cross-estimation produced similar accuracy rates. The accuracy rates could be refined by addressing the interpretation of occupancy prediction results produced by the model whereas the models converted negative values to indicate unoccupied and positive values as occupied. This could also be used to estimate the quantity of occupants; however, that is not entirely necessary as the variations in the total number of occupants is not as import as knowing if the area is occupied for energy savings. Sensitivity of that level may be useful for emergency situations, but for HVAC operations the threshold is lower with simple occupancy determination being suitable improved controls.
The minimal amount of recorded environmental parameters combined with as high as 68% accuracy rates demonstrates the ability of models derived by radial basis functions to detect occupancy. Additional collected parameters could increase accuracy rates but the extent is unknown.
5.2 Recommendation of Research
Future research could examine the effect of additional collected environmental parameters provide more inputs for radial basis function models. Literature has shown numerous combinations of parameters that can be used for model development. This would be a departure from the minimalist approach but could be accomplished in layers