COPYRIGHT NOTICE
FedUni ResearchOnline
https://researchonline.federation.edu.au
This is the author’s accepted version of the following publication:
Haque, M., Hassan, M., BinMakhashen, G., Owaidh, A.,
Kamruzzaman, J. (2018) Breast density classification for cancer
detection using DCT-PCA feature extraction and classifier
ensemble. 17
thInternational Conference on Intelligent Systems
Design and Applications, ISDA 2017; Delhi, India; 14
th-16
thDecember 2017; published in Intelligent Systems Design and
Applications (part of the Advances in Intelligent Systems and
Computing book series), 736, 702-711.
The version displayed here may differ from the final published version.
The final publication is available at:
https://doi.org/10.1007/978-3-319-76348-4_68
Breast Density Classification for Cancer
Detection using DCT-PCA Feature Extraction
and Classifier Ensemble
Md Sarwar Morshedul Haque1, Md Rafiul Hassan1, G.M. BinMakhashen1,
A. H. Owaidh1, and J. Kamruzzaman2
1 King Fahd University of Petroleum & Minerals, Dhahran 31261, KSA 2
Federation University Australia and Monash University, Australia
[email protected], [email protected], [email protected]
Abstract. It is well known that breast density in mammograms may hinder the accuracy of diagnosis of breast cancer. Although the dense breasts should be processed in a special manner, most of the research has treated dense breast almost the same as fatty. Consequently, the dense tissues in the breast are diagnosed as a developed cancer. In contrast, dense-fatty should be clearly distinguished before the diagnosis of can-cerous or not cancan-cerous breast. In this paper, we develop such a system that will automatically analyze mammograms and identify significant features. For feature extraction, we develop a novel system by combining a two-dimensional discrete cosine transform (2D-DCT) and a principal component analysis (PCA) to extract a minimal feature set of mam-mograms to differentiate breast density. These features are fed to three classifiers: Backpropagation Multilayer Perceptron (MLP), Support Vec-tor Machine (SVM) and K Nearest Neighbour (KNN). A majority voting on the outputs of different machine learning tools is also investigated to enhance the classification performance. The results show that features extracted using a combination of DCT-PCA provide a very high classi-fication performance while using a majority voting of classifiers outputs from MLP, SVM, and KNN.
Keywords: Breast Cancer; Breast Dense and Fatty; DCT, PCA; Ma-chine learning tools; Pattern Recognition
1
Introduction
According to National Cancer Institute (NCI), the cancer is a term used to describe abnormal cells division without control that has the power to spread to other tissues via blood and lymph system [1]. Breast cancer is one of the most dangerous and lethal diseases that found to be common among females. However, early breast cancer detection leads to high chances of survival. Several studies have pointed out the importance of the breast density as a mammographic risk indicator, since dense breasts can influence the interpretation of the mammogram compared to fatty ones. Therefore, automatic assessment of breast density will be highly beneficial for breast cancer screening.
Regardless of the amount of research conducted on breast cancer early screen-ing, mortality rate from breast cancer remains high. Moreover, it was found that within the last three years 75-80% who came late and diagnosed with advanced stages resulted in a degraded successful treatment [2]. Therefore, an early breast cancer screening is recommended to be conducted from the age of 40 [3]. It is not known until now the exact relationship between breast density and can-cer, but as per current understanding, it is most probable that the increased density turn to cancers tissue [4]. In this study, we aim to enhance the breast density detection using a two dimensional discrete cosine transform with Prin-ciple Component Analysis (2D DCT-PCA) as a feature extraction technique on mammogram images for accurate classification of dense-fatty breast types.
A typical 2D-DCT (for short DCT) technique transforms an image based on the frequency domain information. This information is divided into three parts (low, moderate and high bands). It has been found that the sensitivity to variations can be noticed by the human visual system in low-frequency band [5]. Therefore, this allows the important information to be concentrated within small area of the DCT domain. DCT has been widely used as feature extrac-tor to detect micro calcification in the breast tissues. For instance, Farag and Moshali have adopted the DCT to locate the ROI that contains the micro-calcifications [3]. Prathibha and Sadasivam [6] have combined DCT and DWT to tackle benign-malignant breast tissue using Nearest Neighbor (KNN) classi-fier. Interestingly, to our knowledge there is no research that has adopted DCT to distinguish breast density from mammogram images.
In this paper, we propose and develop a combination of 2D-DCT feature extraction method with principal component analysis to identify the most in-fluential features from mammogram images. These features are then fed to a number of well known classifiers, e.g. Multilayer Perceptron (MLP), Support Vector Machine (SVM) and K-nearest neighbor (KNN) to classify the images as either fatty or dense-glandular. This sort of classification is important in the early diagnosis of breast cancer. It has been noticed that none of the classifier can achieve very high classification accuracy. Hence, a majority voting approach is adopted to decide about the class of each mammogram image, which achieves acceptably high beast density detection accuracy.
2
Related Works
As separating dense breast tissues from the fatty ones in a mammogram image can be treated as a classification problem, it needs a set of good features to characterize inter and intra variations. Texture based analysis is one big field of feature extraction techniques that has been considered deeply to represent breast images with a set of statistical measurements of the textures [2]. Another work by Mudigonda et al. [7] extracted a gray-level co-occurrence matrices (GCM) features. Their feature set was based on a polygonal modeling of boundaries to excerpt a ribbon of pixels across the mass margin. Tan et al. [8] has used texture based image features to establish association between changes in mammographic
3
image features and risk for breast cancer development. Gabor filter bank was also presented in terms of extracting texture representation of the mammograms. Hussain [9] has adopted a bank of Gabor filters that constituted of different scales (5) and angles (8) to represent micro-patterns. Muthukarthigadevi and Anand in [10]have used wavelet transform to analyze the portrait, angular spread of power and fractal analysis as a features to determine the existence of calcification cells. Transformation based feature extraction techniques could lead to a curse of dimensionality such as wavelet transform, Gabor filter bank, Discrete Cosine Transform (DCT). These techniques have a strong way to represent the visual characteristics of the raw image. However, the resultant feature set may have high dimensionality and this will lead to expensive computations and besides redundant information. Therefore, a feature selection step may be necessary to reduce the features dimensionality and remove the redundant information.
Abnormality (e.g. dense Vs fatty) detection could be very hard from mam-mogram images. Therefore, some efforts have been devoted to develop automatic classification systems for breast density. For example, Oliver et al. [11] explored the applicability of morphological features for density classification. They re-ported an 81% classification accuracy using MIAS database. A recent review by Ganesan et al. [12] on computer aided breast cancer detection using mam-mogram suggests that K-NN, neural network and support vector classifiers are along the most widely used classifiers in this domain.
3
System Overview
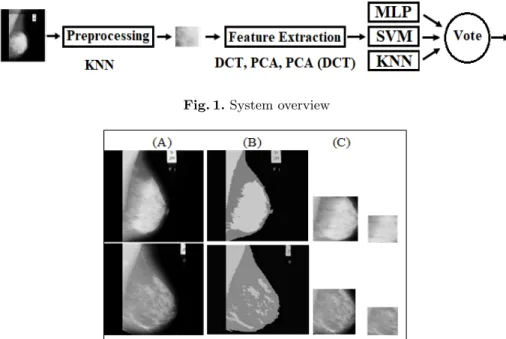
In this work, we propose a novel method for breast density classification using a combination of DCT, PCA and majority voting approach of outputs from a number of classifiers. The method consists of four phases as shown in figure 1. The phases are:
– Data acquisition – Preprocessing – Feature extraction – Classification
In the data acquisition, the system uses hardware (medical sensory) such as an Ultrasound or MRI for capturing some raw representation of the patients breast. After that, these representations (images) are preprocessed to concentrate only on specific location called region of interest (ROI). Furthermore, the raw images may need some enhancement such as intensity adjustment (contrast enhance-ment) [13]. Once the ROI is determined, in the phase of feature extraction, important features are extracted such that the features are able to distinguish among various classes (fatty/dense breast). In case of a very large number of features, the system may adopt a feature selection technique to filter out noisy or less significant features. Finally, the system classifies (recognize or detect) the mammograms through using the selected features.
4
Methodology
4.1 Preprocessing
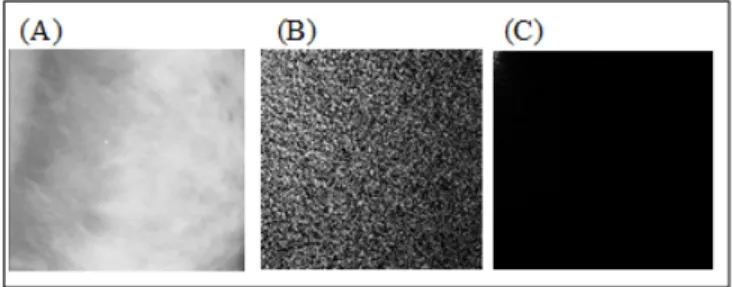
To identify the region of interest (ROI) from a mammogram image, K-means algorithm has been adopted. K-means would group the image based on pixel gray level intensity [14]. An analysis of the available mammogram images revealed that there exist three main groups of pixels: black, white and other. Therefore, the well known clustering technique like K-means has been adopted. A search win-dow of 8 by 8 cells has been used to find the cluster label for the center area of the mammogram to avoid small black background. Fig 2 illustrates an example of the input images in (A), the clustered version of this input is in (B), and (C) is the results after a searching window. The clustered points are obtained by minimizing the objective function:
Od=n k X j=1 X xj∈Ij (xj−Ci) (1)
whereIj= 1,2, . . . , n,Ci is the centroid of the cluster, is the data points.
To remove noise in the images, the clustering technique is applied twice on each of the images, i.e. having received the resultant image after executing
Fig. 1.System overview
Fig. 2.Two examples of right breast clustering results, (A) Original Image, (B) after clustering representations, (c) using the window to select the cluster label and segment the ROI.
5
the clustering technique the resultant image is further tuned by executing the cluster-ing. This removes background noise from the images. Finally, each image is re-sized within a fixed frame of width and height as 300 X 300.
4.2 Feature Extraction
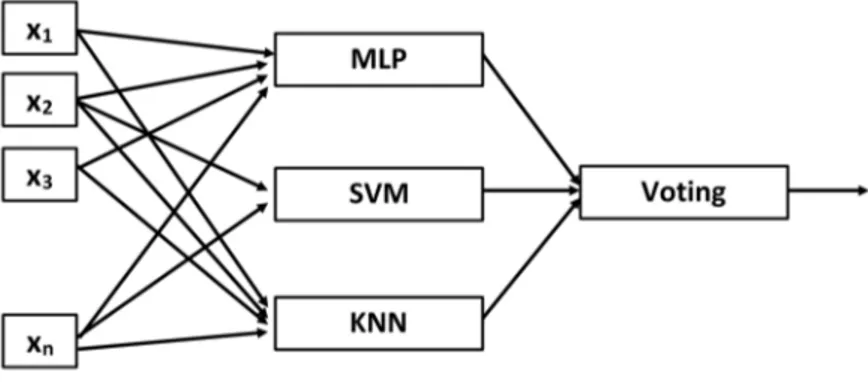
In our proposed method we adopted the DCT to characterize the dense-fatty domain. Since DCT has been proved to be able to aggregate the important information into a small location in a number of studies [15], we used DCT in this study. Figure 3 shows how application of DCT can transform the image of breast mammograms. To find the DCT of image (for our case N = 300), the DCT can be computed as follows [3]:
Cpq=αpαq N X x=1 N X y=1 I(x, y)cos((2x+ 1)πp 2N )cos( (2y+ 1)πq 2N ) (2)
where (x, y) is the spatial coordinates of the image, p and q are the frequency
coordinates 0≤p, q≤N , andαp, αqare DCT coefficients of the two dimensions
that are computed as follows:
αp,q = 1 √ N, p=q= 0 q 2 N, 1≤p, q≤N (3)
Breast density-fatty problem rely very much on the pixel level intensity. There-fore, every single pixel is important to be considered as a feature point. However, for a ROI of size 300 X 300, there are 90000 features which is huge. Therefore, we apply the following two strategies to reduce the number of features without losing any significant information.
Strategy 1: Since DCT concentrates the most significant information in the lower-band frequency, a small number of coefficients in zigzag manner starting from the upper left part of the DCT domain are selected as significant features. Strategy 2:A PCA is applied to reduce and select the best DCT coefficients as significant features.
Fig. 3.Mammograms transformed using DCT, (A) is the ROI, (B) is the DCT Coef-ficients, (C) DCT transformed back into gray level image.
4.3 Classification and Majority Voting
In the process of breast density-fatty classification, three well known classifiers are used: 1) Multilayer perceptron (MLP), 2) Support Vector Machine (SVM) and 3) K nearest neighbor (KNN).
MLP: MLP has been a popular tool to automate classification problems for the last two decades. The underlying learning blocks, i.e., artificial neurons of MLP are similar to a biological neuron. Being capable of dealing with nonlinear problems efficiently, MLP has been widely used to solve complex classification problems. In this paper, MLP has been used to classify breast density-fatty groups while the inputs are extracted features as discussed in Section IV-B.
SVM: SVM is another very popular classifier with strong generalization abil-ity for nonlinear tasks using a kernel trick. Nevertheless, it may consume a very long time to find an optimal discriminant decision boundary. To reduce such computations the sequential minimal optimization (SMO) has been adopted. Details about SVM and SMO can be found in [16].
KNN: Compared to MLP and SVM the underlying methodology of KNN is very simple and straightforward. Given a target point in KNN algorithm distance be-tween the target point and each of the points in the training data is computed. Then, final decision is taken based on the nearest distance to the target point. Provided that each classifier has its own characteristics and capabilities, these classifiers may show a negative correlation in which the integration of these can drastically enhances the overall system performance [17]. Therefore, a majority voting technique has been adopted to combine the three classifiers predictions to a final decision. Fig 4 illustrates the combination of classifiers.
5
Experiments and Discussion
5.1 Mammography dataset
To validate our proposed method, we used the Mammographic Image Analysis Society (MIAS) database that is publicly available at [18]. It contains 322
7
mograms of left and right breasts. In this paper our aim is accurately classify fatty and dense breasts and hence we considered only those mammograms that belong to either fatty or dense-glandular in our experiments. The total number of mammogram images for fatty type is 115 and 105 for a dense glandular type.
5.2 Experimental setup and Performance Metrics
The mammograms were initially preprocessed following methods described in Section 4.1. Then features were extracted as:
* Scenario 1: Select features from the preprocessed mammogram images by using PCA. In the subsequent part of this paper, we refer to this scenario as PCA.
* Scenario 2: Select 1000 features following the method as described in Section IV-B (Strategy 1). Then select the most significant features out of these 1000 features by using PCA. In the subsequent part of this paper, we refer to this
scenario as DCT(103)-PCA.
* Scenario 3: Select the features simply applying PCA to the DCT domain (i.e., DCT transformed images). Following this only 7 features were selected. In the subsequent part of this paper, we refer to this scenario as Direct DCTPCA.
A 10-fold cross validation scheme [19] was used to test the efficacy of our pro-posed method. The performance of classification is measured based on the fol-lowing metrics (given the confusion matrix as Table 1):
The sensitivity (Sen) is the fraction of dense cases that the classifier predicted as dense. Sen is calculated using equation (4). Sen is also known as Recall (Rec). The specificity (Spc) is computed using equation (5). Spc is the fraction of fat-ty cases that the classifier expected as fatty. The classification accuracy (Acc) is the correct prediction of dense and fatty over the number of all considered examples as in equation (6). The precision (Prc) measures how precise is the classification with respect to the positive class. Equation (7) is used to compute Prc.
Sensitivity(Sen) =T P/(T P +F N) (4)
Specif icityorRecall(SpcorRec) =T N/(T N+F P) (5)
Accuracy(Acc) = (T P +T N)/(T P +F N+T N+F P) (6)
P recision(P rc) =T P/(T P +F P) (7)
F Score= 2×P rc×Rec/(P rc+Rec) (8)
Table 1.Confusion Matrix
Classes Positive Negative
Positive True Positive (TP) False Positive(FP) Negative False Negative (FN) True Negative (TN)
In our experiment, we used a three layer MLP (One input layer, one hidden layer and one output layer). The activation function for input and hidden layer was chosen as hyperbolic tangent function while that of output layer was chosen as pure linear. The number of neurons in the hidden layer was chosen empirically. The conjugate gradient backpropagation with Fletcher-Reeves algorithm [20] was used to train the MLP. We used an SVM with radial basis kernel. The parameters of SVM (i.e., sigma and scaling factor) were chosen empirically. Finally, for KNN, K was chosen as 3.
5.3 Results and Discussion
We observe from Tables (2, 3, and 4) that SVM has better accuracy compared to other classifiers (consider performance of individual classifier only) for the cases where data features are collected using PCA, and data features are collected
using DCT (103)-PCA.
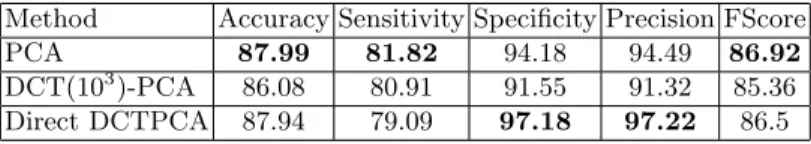
SVM can recognize the dense breasts over fatty better compared with the other classifier which is revealed through a better sensitivity (see Table 3). On the other hand MLP and KNN provide a better recognition to the fatty breast type over the dense type by considering specificity. It is interest-ing to note that, KNN achieves a very high recognition rate for the fatty type using Direct DCT-PCA (97.18% Specificity). The precision of KNN and MLP is higher than SVM because these classifiers have suffered misclassification of dense breast types. The opposite is true with SVM classifier. However, the tradeoff the Rec and Prc can be witnessed from the FScore metric. Therefore, SVM shows a good Fscore over the other two classifiers for all feature types. According to the behavior of these classifiers, we can observe the strength and weaknesses of the classifiers over different breast types (dense or fatty). There-fore, we cannot depend merely on a signal classifier for such classification problem. As seen in Table 5 the majority voting technique obtains better recognition in terms of accuracy compared to the others for cases: DCT-PCA(103) and Direct DCTPCA. This is due to the complementary of the three classifiers. It considers the best results from differ-ent classifiers instead of depending on one, and then vote between these results
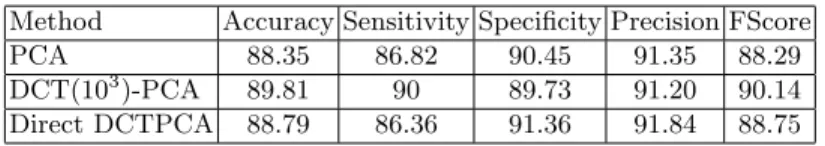
Table 2.MLP Classifier Performance
Method Accuracy Sensitivity Specificity Precision FScore
PCA 88.35 86.82 90.45 91.35 88.29
DCT(103)-PCA 89.81 90 89.73 91.20 90.14 Direct DCTPCA 88.79 86.36 91.36 91.84 88.75
Table 3.SVM Classifier Performance
Method Accuracy Sensitivity Specificity Precision FScore PCA 91.69 93.64 89.64 91.43 92.06
DCT(103)-PCA 91.17 94.55 87.73 89.50 91.62 Direct DCTPCA 87.90 96.36 79.18 83.59 88.75
9
Table 4.KNN Classifier Performance
Method Accuracy Sensitivity Specificity Precision FScore PCA 87.99 81.82 94.18 94.49 86.92
DCT(103)-PCA 86.08 80.91 91.55 91.32 85.36 Direct DCTPCA 87.94 79.09 97.18 97.22 86.5
Table 5.Vote (MLP, SVM, KNN)
Method Accuracy Sensitivity Specificity Precision FScore PCA 92.12 90.91 93.27 94 92.04 DCT(103)-PCA 92.55 93.64 91.55 92.40 92.64 Direct DCTPCA 91.58 89.09 94.27 94.41 91.35
to obtain final decision. Taking into consideration all the performance metrics, the majority voting technique has a balanced degree of performance over all classifiers.
6
Conclusion
In this paper, we have investigated the breast density classification using a com-bination of three classifiers over DCT-PCA feature sets. The majority voting of these classifiers reveals an enhanced performance to classify fatty and dense breast types. In conclusion, the combination of DCT-PCA as a feature extrac-tion methodology along with majority voting could be a good choice to classify fatty and dense breast from breast mammogram images.
References
1. NIH: Comprehensive cancer information – national cancer institute. http://www.cancer.gov/ [Online; accessed 12-June-2017].
2. Silva, W., Menotti, D.: Classification of mammograms by the breast composition. In: Proceedings of the International Conference on Image Processing, Computer Vision, and Pattern Recognition (IPCV), WorldComp (2012) 1–6
3. Farag, A., Mashali, S.: Dct based features for the detection of microcalcifications in digital mammograms. In: Circuits and Systems, 2003 IEEE 46th Midwest Sym-posium on. Volume 1., IEEE (2003) 352–355
4. Komen, S.G.: Understanding breast cancer.
http://ww5.komen.org/BreastCancer/HighBreastDensityonMammogram.htm [Online; accessed 12-June-2017].
5. Chen, W., Er, M.J., Wu, S.: Pca and lda in dct domain. Pattern Recognition Letters26(15) (2005) 2474–2482
6. Prathibha, B., Sadasivam, V.: An analysis on breast tissue characterization in combined transform domain using nearest neighbor classifiers. In: Computer, Com-munication and Electrical Technology (ICCCET), 2011 International Conference on, IEEE (2011) 50–54
7. Mudigonda, N.R., Rangayyan, R., Desautels, J.L.: Gradient and texture analysis for the classification of mammographic masses. IEEE transactions on medical imaging19(10) (2000) 1032–1043
8. Tan, M., Zheng, B., Leader, J.K., Gur, D.: Association between changes in mam-mographic image features and risk for near-term breast cancer development. IEEE transactions on medical imaging35(7) (2016) 1719–1728
9. Hussain, M.: False positive reduction using gabor feature subset selection. In: Information Science and Applications (ICISA), 2013 International Conference on, IEEE (2013) 1–5
10. Muthukarthigadevi, R., Anand, S.: Detection of architectural distortion in mam-mogram image using wavelet transform. In: Information Communication and Em-bedded Systems (ICICES), 2013 International Conference on, IEEE (2013) 638–643 11. Oliver, A., Freixenet, J., Marti, R., Pont, J., P´erez, E., Denton, E.R., Zwiggelaar, R.: A novel breast tissue density classification methodology. IEEE Transactions on Information Technology in Biomedicine12(1) (2008) 55–65
12. Ganesan, K., Acharya, U.R., Chua, C.K., Min, L.C., Abraham, K.T., Ng, K.H.: Computer-aided breast cancer detection using mammograms: a review. IEEE Re-views in biomedical engineering6(2013) 77–98
13. Basheer, N.M., Mohammed, M.H.: Segmentation of breast masses in digital mam-mograms using adaptive median filtering and texture analysis. International Jour-nal of Recent Technology and Engineering (IJRTE)2(1) (2013) 39–43
14. Liu, H., Guo, Q., Xu, M., Shen, I.F.: Fast image segmentation using region merging with a k-nearest neighbor graph. In: Cybernetics and Intelligent Systems, 2008 IEEE Conference on, IEEE (2008) 179–184
15. El-Alfy, E.S.M., BinMakhashen, G.M.: Improved personal identification using face and hand geometry fusion and support vector machines. Networked Digital Tech-nologies (2012) 253–261
16. Platt, J.: Fast training of support vector machines using sequential minimal opti-mization, in, b. scholkopf, c. burges, a. smola,(eds.): Advances in kernel methods-support vector learning (1998)
17. Kuncheva, L.I., Whitaker, C.J., Shipp, C.A., Duin, R.P.: Limits on the majority vote accuracy in classifier fusion. Pattern Analysis & Applications 6(1) (2003) 22–31
18. Suckling, J.: Mammographic image analysis society. http://peipa.essex.ac.uk/info/mias.html (2017) [Online; accessed 12-June-2017]. 19. Kohavi, R., et al.: A study of cross-validation and bootstrap for accuracy estimation
and model selection. In: Ijcai. Volume 14., Stanford, CA (1995) 1137–1145 20. Charalambous, C.: Conjugate gradient algorithm for efficient training of artificial
neural networks. IEE Proceedings G (Circuits, Devices and Systems)139(3) (1992) 301–310
View publication stats View publication stats