http://waikato.researchgateway.ac.nz/
Research Commons at the University of Waikato
Copyright Statement:
The digital copy of this thesis is protected by the Copyright Act 1994 (New Zealand). The thesis may be consulted by you, provided you comply with the provisions of the Act and the following conditions of use:
Any use you make of these documents or images must be for research or private study purposes only, and you may not make them available to any other person. Authors control the copyright of their thesis. You will recognise the author’s right to
be identified as the author of the thesis, and due acknowledgement will be made to the author where appropriate.
You will obtain the author’s permission before publishing any material from the thesis.
DECOUPLING ENZYME CATALYSIS
FROM THERMAL DENATURATION
A thesis
submitted in partial fulfilment of the requirements for the degree
of
Master of Science in Biological Sciences
atThe University of Waikato
byASHLEY DAVYS EASTER
The University of Waikato 2010
Abstract
The equilibrium model (EM) (Daniel et al., 2001) postulates two forms of a folded enzyme, one catalytically active (Eact) and the other inactive (Einact), which interconvert via a fast thermal equilibrium (Keq) (Figure A). This model for enzyme catalysis accounts for experimentally observed time and temperature profiles of enzyme/substrate systems more accurately than the classically derived, single folded-species, model (Figure B). In both models, the denatured species (X) is formed via the kinact process, which is temperature and time-dependent.
Eact Keq ! "! # !! Einact kinact !!!" X E!k!!inact" X
Figure A – The equilibrium model Figure B – The classical model
Comparison between the equilibrium model and classical model for enzyme catalysis. For both, the vertical axis is catalytic rate (M s-1), the left-right axis is increasing
temperature (K) and the back-front axis is assay duration (s).
The physical basis for the Eact/Einact equilibrium is unknown. To study the equilibrium, the temperature midpoint of the Eact/Einact transition (Teq) has to be separated from the thermostability of the enzyme (Tm) to allow the Einact species to exist in measurable concentrations without exhibiting denaturation.
Mutations were made in a well-studied and NMR-accessible ribonuclease, barnase, to alter the thermostability and/or the Teq of the enzyme activity. The stability properties of each mutant were measured and the activity against two substrates assayed. New models were derived and fitted against wild-type barnase, and an ideal data set, to give insight into alternative irreversible and reversible denaturation pathways. Simulations of these models were developed to benchmark potential dynamics work and explain the movements of species within each model’s framework.
Assay data fits to the EM and alternative models show a preference for irreversible denaturation pathways via the Einact species. A mathematically simplified model was also found that accounts for data and could provide an alternative method for determining EM parameters. Although fits of barnase to the EM were statistically good, the denaturation properties could not be reconciled with the literature or experimentally determined values for stability and unfolding. Simulations illustrating how the Eact, Einact and denatured (X) species interact also corroborate this finding.
Despite this discrepancy (in fitted parameters to the EM), it is hypothesised that the Teq and Tm of a disulphide-bridged mutant of barnase have been successfully decoupled. This mutant has been 15 N-labelled for future NMR dynamics measurements. New approaches to the EM model are proposed where the separate determination of enzyme thermodynamic properties (e.g., rate and free energy of denaturation) would allow other EM parameters to be fitted independently to each data set.
Acknowledgements
I would like to thank first and foremost my supervisor Associate Professor Vickery Arcus for the opportunity to work on this project. Thank you for encouraging me into the kinetics/maths side of this thesis, as it has ultimately been the most fulfilling part, and for taking my questions and requests for scholarship references so graciously.
Secondly, to my fellow Equilibrium Modelers at Waikato; Professor Roy Daniel, Colin Monk, Dr Jo Hobbs and the others from the TRU. Thanks to Jo for keeping me on track, listening to my ramblings and kindly critiquing this thesis. Colin, your expertise has been invaluable, especially in getting me started with assays and the fitting procedures. The technical support of Dr F. Grant Pearce (CD & DSC, Canterbury) and Jonathan Puddick (mass spectrometry) is also greatly appreciated, along with important mathematical assistance from Associate Professor Stephen Joe.
To all the others, past and present, in the C.2.10 lab who have helped me out over the past year-and-a-bit (hopefully I have everyone): Dr Jo H, Jo M, John S, Emma S, Emma L, Dr Emma D, Marisa T, Matt C, Line H, Dr Svend H, Dr Randal W, Dr Judith B, Dr Ian M, Ali R, Kevin L and Tammy W – thank you all for help, advice, conversation and time-wasting. John deserves special mention for being my lab buddy for those first few months and putting up with my inane and sometimes stupid questions.
I must thank those across the hall in C.2.03 for the help they have given, and the numerous beers shared on Fridays: Professor Dick W, Dr Ray C, Dr Dave M, Dr Greg J, Olivia P, Raewyn T, Talia S, Niharika S, Helen M, Richard L, Jo D, Rebecca W, Claire M and Harriet F.
Lastly (but never least) I’d like to thank my flatmates, family & friends for putting up with me. Mum (who kindly proof-read this thesis), Dad & Caitlin, you have supported me in every way possible, thanks so much.
This project is supported by the Royal Society of New Zealand Marsden Fund. A.D.E. received a University of Waikato Masters’ Research Scholarship.
Table of Contents
Abstract... i!
Acknowledgements ...iii!
Table of Contents...iv!
List of Figures ... x!
List of Tables ...xiii!
List of Equations... xv!
List of Abbreviations ...xvi!
1 Introduction ... 1!
1.1 Catalysis and Kinetics... 1!
1.1.1 General Catalysis and Kinetics... 1!
1.1.2 Enzyme Catalysis and Kinetics ... 2!
1.1.3 Michaelis-Menten Kinetics... 4!
1.2 Time, Temperature and the Equilibrium Model ... 5!
1.2.1 Time and Temperature ... 5!
1.2.2 The Equilibrium Model Concept ... 6!
1.2.2.1 Initial Postulate ... 7!
1.2.3 Building Evidence for the Equilibrium Model... 9!
1.2.3.1 Work up to 2009: Proof, Validation and Key Points ... 9!
1.2.3.2 The Current State of the Model ... 12!
1.3 Barnase... 13!
1.3.1 Structure and Expression ... 13!
1.3.2 Substrates and Activity... 14!
1.3.3 Barnase and the Equilibrium Model... 15!
1.3.3.1 Protein Folding Studies ... 15!
1.3.3.2 Mutations of Barnase ... 16! 1.3.3.3 Reversible Denaturation... 20! 1.3.3.4 NMR Accessibility of Mutants ... 20! 1.4 Research Objectives... 21! 1.4.1 Experimental ... 21! 1.4.2 Theoretical ... 22!
2.1 Reagents and General Methods ... 23!
2.2 DNA, Transformation and Sequencing Methods... 23!
2.2.1 Plasmids... 23!
2.2.2 Nucleic Acid Concentration Determinations ... 23!
2.2.3 General Electroporation Methodology ... 24!
2.2.3.1 Agar Plating of Freshly Transformed Cells ... 24!
2.2.4 Plasmid Sequencing and Transformed Cell Stocks... 24!
2.2.4.1 Sequencing Methods... 24!
2.2.4.2 Alignment of Sequences ... 25!
2.2.4.3 10% Glycerol Stocks of Transformed Cells ... 25!
2.3 Site-Directed Mutagenesis ... 25!
2.3.1 DNA Preparation ... 26!
2.3.2 Primer Design and Preparation... 26!
2.3.3 Mutagenesis Protocol... 26!
2.4 Protein Expression and Purification... 27!
2.4.1 SDS-PAGE Methodology ... 27!
2.4.1.1 Staining and Destaining of Gels ... 28!
2.4.2 Large-Scale Expression Cultures... 28!
2.4.2.1 For WT and Mutant Protein Expression ... 28!
2.4.2.2 15N-incorporation for NMR ... 28!
2.4.3 Crude Isolation ... 29!
2.4.4 Cation Exchange Chromatography ... 29!
2.4.5 Size Exclusion Chromatography... 30!
2.4.5.1 Small Scale S75 10/300... 30!
2.4.5.2 Large Scale S75 16/60 ... 30!
2.4.5.3 Final Dialysis... 30!
2.5 Characterisation of WT and Mutant Barnase... 31!
2.5.1 Protein Concentration Determination ... 31!
2.5.2 Mass Spectrometry... 31!
2.5.2.1 Gel Extraction... 31!
2.5.2.2 Matrices, Calibrant(s) and Sample Preparation ... 32!
2.5.2.4 Analysis of Mass Spectra... 33!
2.5.3 Rotavirus RNA RNAse Assays ... 33!
2.5.3.1 General Method ... 33!
2.5.3.2 Contaminant Screens ... 34!
2.5.3.3 Time-course Assays... 35!
2.5.4 SYPRO™ Real-time Melts ... 35!
2.5.5 Circular Dichroism... 35!
2.5.5.1 Sample Preparation and Instrument Setup ... 36!
2.5.5.2 Data Fitting and Analysis... 36!
2.5.6 Differential Scanning Calorimetry... 37!
2.5.6.1 Sample Preparation and Instrument Setup ... 38!
2.5.6.2 Data Fitting and Analysis... 38!
2.6 Equilibrium Model Data Collection ... 39!
2.6.1 Initial Dinucleotide Trials... 39!
2.6.1.1 Substrate and Enzyme Preparation ... 39!
2.6.1.2 Sample Preparation and Instrument Setup ... 40!
2.6.1.3 KM Determinations ... 40!
2.6.2 Fluorogenic Substrate (FrG)... 41!
2.6.2.1 Substrate Stock and Preparation ... 42!
2.6.2.2 Product Stocks and Preparation ... 42!
2.6.2.3 Substrate Stability (Real-time Melts) ... 42!
2.6.2.4 Fluorometer Setup... 42!
2.6.2.5 Substrate/Product Optimisation... 43!
2.6.2.6 Assay Method ... 43!
2.6.2.7 KM Determinations ... 44!
2.7 Equilibrium Model Data Processing ... 44!
2.7.1.1 General Data Workup... 44!
2.7.1.2 Absorbance Data Workup... 44!
2.7.1.3 Fluorescence Data Workup... 45!
2.7.2 Using MATBLAB fitting.exe... 45!
2.7.3 Using Alternative MATLAB Equations ... 46!
3 Experimental Results and Discussion ... 48!
3.1 Protein Purification ... 48!
3.2 Characterisation of WT and Mutants ... 51!
3.2.1 Mass Spectrometry (MS) ... 51!
3.2.1.1 Full Protein Results ... 51!
3.2.1.2 Peptide Digest Results ... 51!
3.2.1.3 LIFT™ Results for I88V and L89V ... 52!
3.2.1.4 Unknown ~25 kDa SDS-PAGE Band Analysis ... 52!
3.2.2 Rotavirus RNA RNAse Assays ... 53!
3.2.3 SYPRO™ Real-time Melts ... 54!
3.2.4 Circular Dichroism... 55!
3.2.4.1 Refolding Scans of WT Barnase... 57!
3.2.5 Differential Scanning Calorimetry... 58!
3.2.6 Summary of Thermostability Results... 59!
3.3 Original Equilibrium Model Assays... 61!
3.3.1 Initial Dinucleotide Trials... 61!
3.3.1.1 Experimental ... 61!
3.3.1.2 MATLAB fitting.exe Results ... 62!
3.3.2 Fluorogenic Substrate Characterisation ... 63!
3.3.2.1 Real-time Melts ... 64!
3.3.2.2 Linearity of Fluorescence with Concentration ... 64!
3.3.3 Fluorogenic Substrate Assays (WT, DM and L89V)... 66!
3.3.3.1 Data Gathering and KM Determinations ... 66!
3.3.3.2 Fitting Results to the Original EM ... 70!
3.3.4 Discussion of Output Parameters for WT, DM and L89V Barnase ... 73!
4 Theory and Modelling of the Equilibrium Model... 75!
4.1 Derivation of Alternative Models ... 75!
4.1.1 Species Schemes and Rate Equations for Alternate Models ... 76!
4.1.1.1 Models “O” and “P” ... 77!
4.1.1.2 Model “M”... 77!
4.2 Comparison of Alternative Models ... 79!
4.2.1 Ideal Data Set ... 79!
4.2.1.1 Original Model Fitting ... 79!
4.2.1.2 Custom MATLAB Fitting of Alternative Models ... 80!
4.2.1.3 Analysis of Irreversibly Denaturing Models (EM, O, P and M)... 81!
4.2.1.4 Analysis of Reversibly Denaturing Models (N, R and Q) . 83! 4.2.2 WT Barnase Data Set... 84!
4.2.2.1 Analysis of Irreversibly Denaturing Models (EM, O, P and M)... 85!
4.2.2.2 Analysis of Reversibly Denaturing Models (N, R and Q) . 86! 4.3 Species Concentration Simulations... 86!
4.3.1 Simulations of Different Data Sets and Models ... 87!
4.3.2 Modelling an Ideal Enzyme... 91!
5 Discussion and Conclusions ... 93!
5.1 Experimental ... 93!
5.1.1 Assays and Fitting Results to the Original EM ... 93!
5.1.2 Thermostability and Decoupling Tm from Teq... 94!
5.2 Theory and Modelling ... 95!
5.2.1 Fitting Results for all Models... 95!
5.2.2 Species Simulations... 97!
5.3 Future Research ... 98!
5.3.1 Experimental ... 98!
5.3.2 Modelling and Mathematics ... 99!
References... 101!
Appendix A Reagents and Extra Methods... 105!
A.1 Buffers and Solutions... 105!
A.2 Growth Media... 106!
A.3 Antibiotics ... 107!
A.4 PAGE Gels... 107!
A.5 Bacterial Strains and Preparations... 108!
A.6 DNA Mini-prep Method (Alkaline Lysis) ... 109!
A.8 Thermocouple Calibration... 111!
Appendix B Derivations of Model Equations ... 112!
B.1 Original Equilibrium Model... 112!
B.2 Model “M” ... 114!
B.3 Reversible Denaturation Models (N & Q)... 115!
B.4 Model “N”... 116!
B.5 Model “O”... 117!
B.6 Model “P” ... 119!
B.7 Model “Q”... 121!
B.8 Model “R” ... 123!
Appendix C Contents of Compact Disc... 125!
C.1 Ashley Davys Easter MSc Thesis Waikato 2010... 125!
Appendix D Sequencing Results... 126!
List of Figures
Figure 1.1 – Ester hydrolysis in neutral aqueous solution ... 1!
Figure 1.2 – Transition state for uncatalysed ester hydrolysis (Fersht, 1999) ... 1!
Figure 1.3 – Gibbs free energy diagram for uncatalysed and catalysed reactions... 2!
Figure 1.4 – Plot of the Michaelis-Menten equation for enzyme kinetics .... 4!
Figure 1.5 – (Previous Left) Smoothed experimental data for a model enzyme (collected as per Section 2.6.1) ... 7!
Figure 1.6 – (Previous Right) Simulated rate profile for the same enzyme using classical kinetics (Equation 1.10) ... 7!
Figure 1.7 – (Immediate Left) Simulated rate profile for the same enzyme using the equilibrium model kinetics (Equation 1.15)... 7!
Figure 1.8 – Cartoon representation of WT barnase from PBD 1BRN ... 14!
Figure 1.9 – Barnase complexed with CGAC tetranucleotide (PDB 1BRN) ... 15!
Figure 1.10 – Wall-eye stereo diagram of I51V (yellow) imposed on WT (green) ... 17!
Figure 1.11 – Wall-eye stereo diagram of I88V (yellow) imposed on WT (green) ... 17!
Figure 1.12 – Wall-eye stereo diagram of L89V (yellow) imposed on WT (green) ... 18!
Figure 1.13 – Wall-eye stereo diagram of Y78F (yellow) imposed on WT (green) ... 18!
Figure 1.14 – Wall-eye stereo diagram of S80C/A43C (yellow) imposed on WT (green)... 19!
Figure 2.1 – GpUp dinucleotide substrate with cleavage site shown... 39!
Figure 2.2 – FrG fluorogenic substrate with cleavage site shown... 41!
Figure 3.1 – Traces from L89V CEC protein purification ... 48!
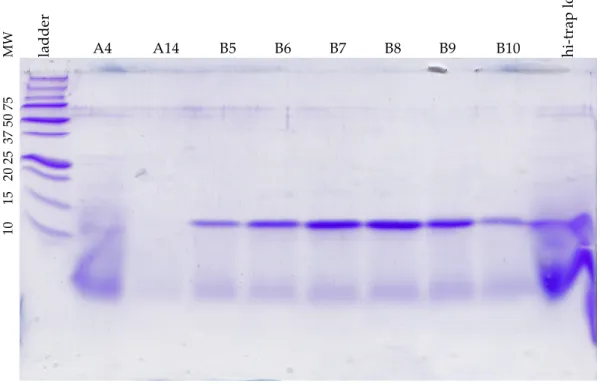
Figure 3.2 – SDS-PAGE gel of I51V CEC protein purification... 49!
Figure 3.3 – Traces from Y78F SEC protein purification ... 50!
Figure 3.4 – SDS-PAGE gel of I88V SEC protein purification ... 50!
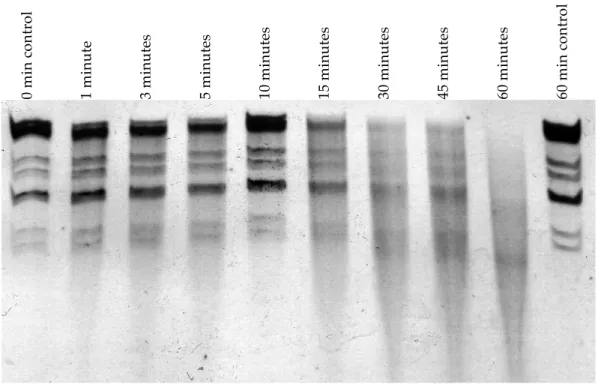
Figure 3.6 – RNAse assay time-course of WT barnase activity ... 53!
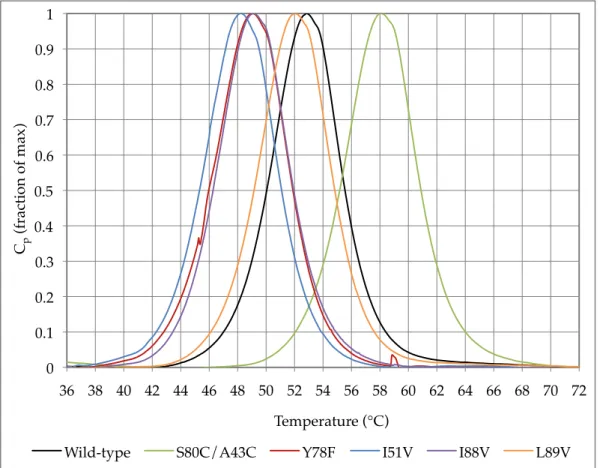
Figure 3.7 – Average SYPRO™ real-time melts for WT and mutant barnase ... 54!
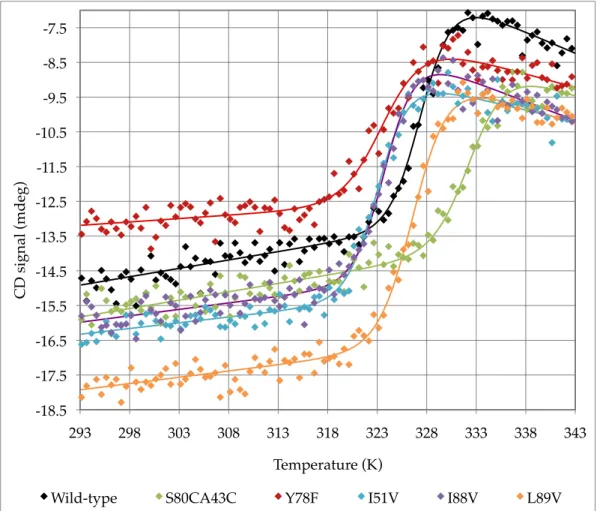
Figure 3.8 – Fitted circular dichroism signal data for WT and mutant barnase unfolding ... 56!
Figure 3.9 – 20 (folded) and 70 °C (unfolded) circular dichroism wave scans of WT ... 56!
Figure 3.10 – Circular dichroism refolding scan of WT barnase between 40-70 °C ... 57!
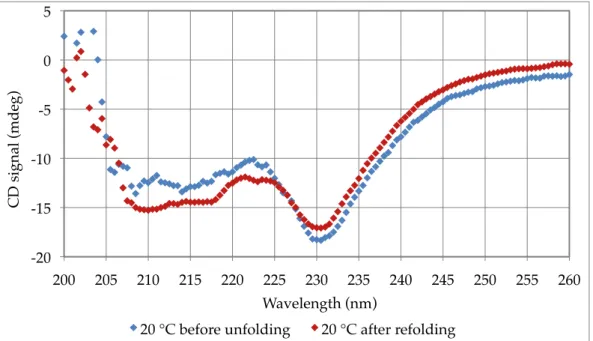
Figure 3.11 – 20 °C circular dichroism wave scans of WT barnase before and after refolding ... 57!
Figure 3.12 – Differential scanning calorimetry scans of WT and mutant barnase ... 58!
Figure 3.13 – Comparison of ∆Tm from WT for barnase mutants between three methods ... 60!
Figure 3.14 – KM determination at 46 °C for GpUp and WT barnase ... 61!
Figure 3.15 – Fitting.exe output figures for WT barnase with GpUp (60 s data set)... 63!
Figure 3.16 – Real-time melts of FrG substrate 25-90-25 °C in assay buffer ... 64!
Figure 3.17 – Wave scan of increasing FrG product concentration at 26 °C ... 65!
Figure 3.18 – Wave scan of increasing FrG product concentration at 50 °C ... 65!
Figure 3.19 – KM determination at 26 °C for FrG and WT barnase... 67!
Figure 3.20 – KM determination at 50 °C for FrG and WT barnase... 67!
Figure 3.21 – KM determination at 26.5 °C for FrG and DM barnase ... 68!
Figure 3.22 – KM determination at 50 °C for FrG and DM barnase ... 68!
Figure 3.23 – KM determination at 25 °C for FrG and L89V barnase... 69!
Figure 3.24 – KM determination at 50 °C for FrG and L89V barnase... 69!
Figure 3.25 – Fitting.exe output figures for WT barnase with FrG ... 72!
Figure 3.26 – Fitting.exe output figures for DM barnase with FrG... 72!
Figure 3.28 – (Left) Simulated rate profiles of WT (blue) and DM (green) barnase & (Right) Simulated rate profiles of WT (blue) and L89V (orange) barnase ... 74!
Figure 4.1 – Species simulations for the ideal data set in the original EM. (Left) View showing Eact (green), Einact (blue) and X (red) and (Right) View with Eact removed... 88!
Figure 4.2 – Species simulations for WT barnase and FrG in the original EM. (Left) View showing Eact (green), Einact (blue) and X (red) and (Right) View with Eact removed. ... 89!
Figure 4.3 – Species simulations for DM barnase and FrG in the original EM. (Left) View showing Eact (green), Einact (blue) and X (red) and (Right) View with Eact removed. ... 90!
Figure 4.4 – 2D temperature/time plot of EM species at > 80% E0 for DM barnase ... 90!
Figure 4.5 – Species simulations for an ideal enzyme in the original EM. (Left) View showing Eact (green), Einact (blue) and X (red) and (Right) View with Eact removed... 91!
Figure 4.6 – 2D temperature/time plot of EM species at > 80% E0 for an ideal enzyme ... 92!
Figure D.1 – Sequence of pMT1002: Alignment of the modified Addgene sequencing (blue), additional new outward sequencing (grey), sequencing primers (brown) and other regions of interest (various)... 129!
List of Tables
Table 1.1 – Average values for enzyme/substrate systems fitted to the
equilibrium model... 12!
Table 1.2 – Thermodynamic and solvation properties of selected barnase mutants ... 20!
Table 2.1 – Sequencing primers for plasmid pMT1002... 25!
Table 2.2 – Mutagenesis primers for WT barnase in pMT1002 plasmid.... 26!
Table 2.3 – Settings for mutagenesis thermal cycling and details of codon changes ... 27!
Table 2.4 – RNAse contaminant screen conditions ... 34!
Table 2.5 – Fitting parameters for CD data... 37!
Table 2.6 – Fitting parameters for DSC data ... 39!
Table 2.7 – Properties of fluorogenic substrate and products ... 41!
Table 2.8 – Starting parameters for fitting.exe fitting runs ... 46!
Table 2.9 – Fitting parameters for custom equilibrium model equations.. 47!
Table 3.1 – Final yields of WT and mutant barnase ... 51!
Table 3.2 – Whole-protein MALDI-TOF MS results for WT and DM barnase ... 51!
Table 3.3 – WT and mutant tryptic digest mass spectrometry results ... 52!
Table 3.4 – Tm values for WT and mutant barnase from differential SYPRO™ melts ... 55!
Table 3.5 – Tm values for WT and mutant barnase from circular dichroism unfolding ... 55!
Table 3.6 – Tm values for WT and mutant barnase from DSC... 59!
Table 3.7 – Summary of ∆Tm from WT for barnase mutants between three methods ... 59!
Table 3.8 – Summary of ∆HVH from WT for barnase mutants from DSC measurements... 60!
Table 3.9 – Output parameters for WT barnase and GpUp substrate for the original EM... 62!
Table 3.10 – KM (at 25-26 & 50 °C) and [E0] values for WT, Dm and L89V EM assays ... 66!
Table 3.11 – Output parameters for WT barnase and FrG substrate for the original EM... 70!
Table 3.12 – Output parameters for DM barnase and FrG substrate for the original EM... 70!
Table 3.13 – Output parameters for L89V barnase and FrG substrate for original EM... 71!
Table 3.14 – Summary of output parameters for WT and mutant barnase 73! Table 4.1 – Comparison of original EM to newly derived alternative models... 76!
Table 4.2 – Output parameters for the ideal data set for the original EM . 79!
Table 4.3 – Output parameters for the ideal data set for original and alternative models... 80!
Table 4.4 – Output parameters for WT barnase and FrG for original and alternative models... 85!
Table 4.5 – Species concentration equations for the original EM... 87!
Table 4.6 – Simulation parameters of an ideal enzyme for the original EM ... 91!
List of Equations
Equation 1.1 – The relationship between rate constant and ∆G‡... 2! Equation 1.2 – The relation between Gibbs free energy, enthalpy and entropy... 3! Equation 1.3 – The relationship between rate constant, ∆H‡ and ∆S‡ (Fersht, 1999) ... 3!
Equation 1.4 – Illustration of substrate binding and catalysis from the enzyme-substrate complex ... 4! Equation 1.5 – (Left) Michaelis-Menten equation for enzyme kinetics (V) . 5!
Equation 1.6 –(Right) The general case for maximum enzyme velocity (Vmax) ... 5! Equation 1.7 – Irreversible denaturation in the classic enzyme kinetics model... 5!
Equation 1.8 and Equation 1.9 – Expressions for the amount of active enzyme present in assays according to classical enzyme kinetics ... 5! Equation 1.10 – Maximum enzyme velocity allowing for denaturation in the classical kinetics ... 6!
Equation 1.11 – The Eact to Einact equilibrium ... 8! Equation 1.12 – The dependence of Keq on ∆Heq and Teq for thermal equilibrium... 8!
Equation 1.13 – The rate of enzyme catalysis according to the equilibrium model... 8!
Equation 1.14 – The interconversion between forms in the equilibrium model... 8! Equation 1.15 – The full equilibrium model rate equation for Vmax... 9! Equation 2.1 – CD equation fitting mdeg data to temperature data ... 36!
Equation 2.2 and Equation 2.3 – Fractional proportion of folded and unfolded forms with changes in thermal equilibrium constant... 37! Equation 2.4 – DSC equation fitting Cp data to temperature data ... 38!
List of Abbreviations
Axxx Absorbance at xxx nm wavelength
ACN Acetonitrile
CCD Charge-Coupled Device
CD Circular Dichroism spectroscopy
CEC Cation Exchange Chromatography/Column
CO Carbonyl Oxygen
Cp Heat Capacity at constant Pressure
∆G‡ Change in Gibbs free energy for the transition state
∆Heq Enthalpy of the Eact/Einact Equilibrium
∆HVH Van ‘t Hoff enthalpy
∆Seq Entropy of the Eact/Einact Equilibrium
∆Tm Change in Temperature Midpoint of denaturation
Da Dalton(s)
DEPC Di-Ethyl Pyro-Carbonate treated water (RNAse free) DLP Double-Layered (Rotovirus) Particle
DM Refer to S80C/A43C
dNTP di-Nucleotide Tri-Phosphate DSC Differential Scanning Calorimetry
Eact Active Enzyme
EDTA Ethylene Diamine Tetra-acetic Acid
Einact Inactive Enzyme
EM Equilibrium Model (usually the established model)
em. Emission
ex. Excitation
Fl.xxx Fluorescence at xxx nm wavelength
FLD Formamide Loading Dye
FrG Florescent substrate for barnase assays GpUp Dinucleotide substrate for barnase assays
GTE Glucose Tris EDTA
HWHM Half-Width Half-Maximum
I51V WT barnase residue 51 replaced with valine I88V WT barnase residue 88 replaced with valine
K Degrees Kelvin
Kd Affinity constant
Keq Equilibrium constant for the Eact/Einact Equilibrium
KM Michaelis-Menten constant
kxxx Rate constant for the xxx process
L89V WT barnase residue 89 replaced with valine LB Luria-Bertani media / Luria Broth
MALDI-TOF Matrix-Assisted Laser Desorption Ionisation – Time of Flight mass spectrometry
MQ Mili-Q water
MS Mass Spectrometric
MW Molecular Weight
NH Amino Hydrogen
NMR Nuclear Magnetic Resonance spectroscopy
OD600 Optical Density (absorbance) at 600 nm wavelength
[P] Concentration of Product
PAGE Poly-Acrylamide Gel Electrophoresis
PCR Polymerase Chain Reaction
PDB Protein Database
PMT Photo Multiplier Tube
pMT1002 Expression plasmid
QX4 4 x SDS loading buffer / “Quench” R2
R-Squared value (coefficient of determination)
RAM Random Access Memory
RMS Root Mean Square
RO Reverse Osmosis water
S80C/A43C WT barnase residues 80 & 43 replaced with cysteine
SDS Sodium Dodecyl Sulphate
SEC Size Exclusion Chromatography/Column
SOC Super Optimal broth with Catabolite repression
SSE Sum of Squared Errors
t0 Fit of the EM at t = 0 using maximum initial rates
t1/2 Half-life for a process
TB Terrific Broth
TBE Tris Borate EDTA
Teq Temperature midpoint of the Eact/Einact Equilibrium
TFA Tri-Fluoro Acetic acid
Tgrowth Growth Temperature of enzyme source organism
Tm Temperature Midpoint of denaturation
TEMED TEtra-Methyl Ethylene Diamine
Topt Temperatureat t = 0 of maximum catalytic rate
TS Transition State
UV/Vis Ulta-Violet/Visible spectrum
Vmax Maximum rate of catalysis
WT Wild-Type enzyme
X Denatured enzyme
1
Introduction
1.1
Catalysis and Kinetics
1.1.1General Catalysis and Kinetics
Chemical reactions can spontaneously occur on time-scales with half-lives (t1/2) of millions of years, to those that are almost instantaneous (Fersht,
1999). When another entity – be it another molecule in solution or a rare-metal/carbon composite – speeds up a chemical reaction, but is not itself consumed, that entity is called a catalyst.
To briefly illustrate how catalysts work, we can consider a simple chemical-reaction; the hydrolysis of an ester molecule by a water molecule:
Figure 1.1 – Ester hydrolysis in neutral aqueous solution
The transition state (TS) for the spontaneous uncatalysed reaction is highly unstable due to the formation of negative and positive partial charges on the ester’s carbonyl oxygen and the water’s oxygen, respectively:
Figure 1.2 – Transition state for uncatalysed ester hydrolysis (Fersht, 1999)
If, for example, an acetate ion was in solution, the negative charge on the acetate carboxylate group could partially stabilise the !+
on the water, lowering the overall free energy of the TS. In this case, the effect is known as general-base catalysis. It can be shown that the Gibbs free energy barrier from the ground state (reactant) to the TS is therefore less (by ∆∆G‡
), and due to the laws of mass action, the reaction proceeds at a faster rate (Fersht, 1999) (Figure 1.3).
R' O OR H O H R' O OH HO R R' O OR H O H TS R' O OR H O H !+ !–
Figure 1.3 – Gibbs free energy diagram for uncatalysed and catalysed reactions
∆∆G‡ is the difference between ∆G‡ for the uncatalysed reaction (uncat.),
and ∆G‡ for the catalysed reaction (cat.). The rate constant for the reaction
(k) can be described in terms of ∆G‡ using transition state theory and the
Eyring equation (Laidler & King, 1983):
k=kB!T hP !exp "#G ‡ R!T $ % & '()
Equation 1.1 – The relationship between rate constant and ∆G‡
where kB is Boltzmann’s constant, hP is Planck’s constant, R is the gas
constant and T is the temperature in Kelvin. Linus Pauling, amongst others, hypothesised that enzymes might work as catalysts by similarly lowering the ∆G‡ of a reaction (Pauling, 1948).
1.1.2Enzyme Catalysis and Kinetics
Catalysts are ubiquitous; it has been suggested that life itself has arisen from autocatalytic processes, where inorganic precursor molecules were arranged into basic building blocks of many enzymes – porphyrins chelating iron, for example, mediating reaction redox properties – and that these processes have been refined in the RNA- and DNA-based organisms present today (Johnson et al., 2008; Miller & Urey, 1959). Some proteins are the most efficient catalysts known and are called enzymes (Fersht, 1999).
Given that organisms produce metabolically costly enzymes, from an evolutionary standpoint they must gain an advantage from doing so. In an
G ib b s fr ee ener g y (G ) Reaction coordinate TS (uncat.) TS (cat.) Reactant(s) Product(s) ∆∆G‡ ∆G‡ (uncat.) ∆G‡ (cat.)
extreme example, the decarboxylation of orotidine 5'-monophosphate to 5'-uridylic acid has a t1/2 of 78 million years in neutral aqueous solution,
but with orotidine 5'-phosphate decarboxylase present as a catalyst this drops to 18 milliseconds, a ~1017
rate increase (Miller & Wolfenden, 2002). The benefit in terms of higher (faster) rate constants is clear, as at 298 K (25 °C), this equates to a ∆∆G‡ advantage of ~98 kJ mol-1.
So, how do enzymes achieve such rate increases? The components that make up ∆G‡
itself give insight:
!G‡ =!H‡"T#!S‡
Equation 1.2 – The relation between Gibbs free energy, enthalpy and entropy
where ∆H‡ is the enthalpy change and ∆S‡ the entropy change in going
from the substrate to the TS structure. Hence, smaller enthalpy changes and more positive entropy changes will result in a lower ∆G‡ overall.
Equation 1.1 can be modified:
k= kB!T hP !exp "#H ‡ R!T $ % & '()!exp #S ‡ R $ % & '()
Equation 1.3 – The relationship between rate constant, ∆H‡ and ∆S‡ (Fersht, 1999)
Simplistically, enzymes are scaffolds made up of amino acids that maintain an environment (the active site) with several properties that aid in catalysis (Benkovic & Hammes-Schiffer, 2003). Firstly, the TS of the reaction is stabilized by the active site (by straining the shape of a substrate towards the TS conformation shape, it reduces the amount of activation energy, a kind of enthalpy, required to complete the reaction) (Pauling, 1948). Secondly, the pocket in which the substrate binds is complementary to the properties of the substrate, e.g. in terms of shape, charge, polarity and hydrophobicity. Hence, the fit of the substrate is induced; binding gets tighter as more favourable contacts are made (Tsou, 1995). A major related effect involves reducing the entropy change of catalysis by bringing substrate(s) and the enzyme together in the correct orientation to react (Daniel et al., 2003; Garcia-Viloca et al., 2004).
Lastly, enzymes can provide an alternative pathway. Reactions under uncatalysed “normal” conditions may have alternative pathways via
enzyme catalysis. These pathways can be of significantly lower ∆G‡, and
hence have faster rate constants. The variance in enzymatic pathways is large (Fersht, 1999). For example, covalent catalysis involves the formation of temporary chemical bonds between enzyme and substrate, allowing a more energetically favourable series of reactions than the uncatalysed pathway. Alternatively, electrostatic effects that polarise bonds or stabilise charges on intermediates can enhance the reactivity of substrate groups (Warshel et al., 2006).
1.1.3Michaelis-Menten Kinetics
The previous section suggests that the binding of the substrate is a major force in enzymatic catalysis. Leonor Michaelis and Maud Menten developed a general model for the binding of an enzyme to its substrate in 1913 to explain the saturation kinetics seen experimentally with enzyme rate and substrate concentration (Michaelis & Menten, 1913). Such behaviour (Figure 1.4) is seen with all enzymes that follow the Michaelis-Menten model (Equation 1.4) (Briggs & Haldane, 1925; Fersht, 1999).
E+S KM
! "!!
# !!! ES ! "k!cat E+P
Equation 1.4 – Illustration of substrate binding and catalysis from the enzyme-substrate complex
Figure 1.4 – Plot of the Michaelis-Menten equation for enzyme kinetics
0! 0.2! 0.4! 0.6! 0.8! 1! 1.2! 0! 1! 2! 3! 4! 5! 6! 7! 8! 9! 10! V (m ult ip les o f Vmax ) ! [S] (multiples of KM)! V" Vmax" KM"
V=
kcat![E]![S]
KM+[S] and Vmax=kcat![E]
Equation 1.5 – (Left) Michaelis-Menten equation for enzyme kinetics (V)
Equation 1.6 –(Right) The general case for maximum enzyme velocity (Vmax)
In Equation 1.5 and Equation 1.6 V, the reaction velocity, is expressed as a function of [S], the concentration of substrate. KM is the concentration of
substrate at which V=Vmax/2; kcat is the rate constant for catalysis and [E] is
the concentration of active enzyme in the assay. Vmax is the velocity of the
reaction if no product inhibition is observed and KM≈ 0 (or [S] is >> KM).
1.2
Time, Temperature and the Equilibrium Model
1.2.1Time and Temperature
Michaelis-Menten kinetics are time-independent; for example, in Equation 1.5, kcat varies with temperature (as in Equation 1.1), but not assay
duration. This assumption holds only if the enzyme is not inhibited by product formation and the temperature is well below that where the enzyme denatures – both conditions that lead to [E] decreasing and hence, a reduction in the observed rate. The Michaelis-Menten equations can be modified to account for enzyme denaturation, a generally slow thermodynamic process, assuming the following scheme:
Equation 1.7 – Irreversible denaturation in the classic enzyme kinetics model
where E is the active enzyme available for catalysis, X is the denatured form of the enzyme and kdenat is the rate constant for the denaturation
process. Hence, the amount of active enzyme available to catalyse the reaction at any point in time, [E], is given by:
and therefore
Equation 1.8 and Equation 1.9 – Expressions for the amount of active enzyme present in assays according to classical enzyme kinetics
where t is time and [E]0 is the amount of active enzyme added to the assay
at t = 0. Therefore, the equation for Vmax (Equation 1.6) can be modified to
allow for denaturation (Daniel et al., 2001): E !k!!denat" X
Equation 1.10 – Maximum enzyme velocity allowing for denaturation in the classical kinetics
1.2.2The Equilibrium Model Concept
Equation 1.10 can be analysed to understand why Figure 1.6 shows high rates at short assay duration and high temperature. The rate constants for catalysis and denaturation (kcat and kdenat respectively) are both relatively
high (due to the high T term in Equation 1.1), but the high kdenat is
compensated for by the small t term. Thus, the rate of catalysis according to Equation 1.10 is much higher than that seen experimentally (Figure 1.5) for these conditions (Daniel et al., 2001). This flaw was ignored until the last ~15 years, as most enzyme assays were performed under “ideal” conditions away from denaturing temperatures and over longer time periods (Daniel & Danson, 2001).
The equilibrium model (EM) was conceived to reconcile experimentally observed enzyme rates (with respect to time and temperature) with the kinetics (Daniel et al., 2001). The classical Michaelis-Menten kinetics approach, even when corrected for non-Vmax conditions (Equation 2.5),
fails to adequately explain the high temperature/short timescale portion of the profile observed (vertical axis is Vmax):
Figure 1.5 – (Previous Left) Smoothed experimental data for a model enzyme
(collected as per Section 2.6.1) Figure 1.6 – (Previous Right) Simulated
rate profile for the same enzyme using classical kinetics (Equation 1.10) Figure 1.7 – (Immediate Left) Simulated rate profile for the same enzyme using the equilibrium model kinetics (Equation 1.15)
To account for the low experimentally-observed rates at short time scales and high temperatures, something other than denaturation must be occurring. The classical Michaelis-Menten equations only adequately describes experimental data when temperatures are significantly below the denaturation temperature of the enzyme being studied (the thermal midpoint of denaturation being Tm), and the assay duration is long (on the
order of tens of seconds and greater) (Daniel et al., 2001).
1.2.2.1Initial Postulate
It was proposed that, with increasing temperature, the active enzyme (E) was being inactivated in a reversible way that was separate from denaturation (Daniel et al., 2001; Thomas & Scopes, 1998). This was because denaturation, as shown in Section 1.2.1, is not a fast enough process to counteract the high rate of catalysis at higher temperatures (Fulton et al., 2005). Hence, the inactivation process has to be very fast (cf. denaturation) to account for the lower-than-expected rates of activity at high temperatures. This concept has existed since 1944 in various guises, but never explicitly as an enzymatic thermal equilibrium (Sizer, 1944). If two folded forms of the enzyme are allowed for, one form being catalytically active and one catalytically inactive (Eact and Einact
respectively), and they are in fast thermal equilibrium with one another, then we can use Equation 1.11 to describe their relationship:
Eact Keq
! "!
# !! Einact
Equation 1.11 – The Eact to Einact equilibrium
where Keq is the equilibrium constant. The thermal interconversion can be
explained using a modified Van ’t Hoff equation (Daniel et al., 2001; Fersht, 1999): Keq=exp !Heq R " 1 Teq # 1 T $ % & '() $ % & ' ( )
Equation 1.12 – The dependence of Keq on ∆Heq and Teq for thermal equilibrium
Here Teq is the midpoint of the transition (in Kelvin) between the two
forms and ∆Heq is the Van ‘t Hoff enthalpy for the interconversion process.
It then follows that instead of Vmax being in terms of E (Equation 1.5), it
must be in terms of Eact:
Vmax=kcat![Eact]
Equation 1.13 – The rate of enzyme catalysis according to the equilibrium model
If Equation 1.11 is expanded to include a version of Equation 1.7, the manner in which two folded and one denatured forms of the enzyme might interact is obtained:
Eact
Keq
! "!
# !! Einact !k!!inact" X
Equation 1.14 – The interconversion between forms in the equilibrium model
kinact is the rate constant for denaturation from the Einact form. The authors
of the EM saw that a thermal equilibrium between Eact and Einact would lead
to Einact being the dominant folded species at high temperatures and short
timescales (Daniel et al., 2001). This implies that it is on-path to denaturation, as illustrated above in Equation 1.14.
All that remains is for the scheme in Equation 1.14 to be described kinetically in terms of Keq, kinact and kcat, which defines the rate profile (Vmax)
in terms of assay time (t) and temperature (T). By expanding Equation 1.13, the full rate equation is obtained in terms of constants describing
rates for catalysis, denaturation and the Eact/Einact thermal equilibrium
(Equation 1.15). For a full derivation of the EM, see Appendix B.1.
Vmax= kcat![E]0
1+Keq !exp "kinact!Keq!t 1+Keq # $ % & ' (
Equation 1.15 – The full equilibrium model rate equation for Vmax
1.2.3Building Evidence for the Equilibrium Model
1.2.3.1Work up to 2009: Proof, Validation and Key Points
The basis of the theory for the EM has been discussed above, and was first published in 2001 (Daniel et al., 2001). The concept was initially tested against phosphoglycerate kinase from mesophilic and thermophilic sources, and found to qualitatively account for the lack of enzyme activity at temperatures lower than where significant denaturation occurs. Prior research on other enzymes also agreed, showing zero-time plots similar to the model (Arnott et al., 2000; Buchanan et al., 1999). An alternative strategy allowing denaturation through the Eact form in addition to Einact
was found to have a similar fit to the original EM (Equation 1.15). Hence, the original model, specifying that Einact alone is on path to denaturation,
was used exclusively in all future work (Daniel et al., 2001).
The methodology for fitting experimental data to model equations was first cited in 2004, where individual experimental time/temperature/rate data sets were fitted to Eyring and Arrhenius plots (see Equation 1.1 & Equation 1.12) (Peterson et al., 2004). The data was smoothed in the time dimension before fitting. This allowed for the determination of ∆Heq, Teq,
∆Gcat
‡
and ∆Ginact
‡
parameters, but not an overall model fit that would minimise the residual error between the model and the entire experimental data set. Four more enzymes (acid & alkaline phosphatases, an aryl-acylamidase and a ß-lactamase) were trialed against the model. Observations were made that the model was not restricted to purely monomeric enzymes and that the Topt (T at t = 0 where maximum V is
reached) for the enzymes was ~20-40 °C above the ideal growth temperature of the organism (Peterson et al., 2004; Thomas & Scopes, 1998).
It was also observed that the Eact/Einact equilibrium process was at least two
orders of magnitude faster than thermal denaturation (Fulton et al., 2005; Peterson et al., 2004). Plots extrapolated back to the assay start, at t = 0, showed drops in activity at high temperatures that could not be ascribed to denaturation. For example, in the case of aryl-acylamidase, at 5 °C higher than the Topt the activity was ~40% lower than maximum, yet 40%
denaturation at that temperature was known to take ~60 seconds (Peterson et al., 2004). Hence, the EM accounted mathematically more accurately for what was seen experimentally, compared with the classical model (Equation 1.10).
By 2006, 30 enzymes had been studied in detail and all adhered to the EM, having a distinctive “tent shape” three-dimensional rate profile (Figure 1.7). The equilibrium process was shown to be reversible as enzymes could be taken past their apparent Topt (as above), but not their Tm, and
regain lost activity once cooled (Eisenthal et al., 2006). This kind of reactivation is assumed to be disallowed in the classical kinetic situation, where denaturation is irreversible and is the only process leading to loss of enzyme activity (Section 1.2.1). The effects of a stabilising agent (betaine) and a destabilising agent (guanidinium hydrochloride) on Teq
were also explored and found to have no effect on Teq, providing initial
evidence that Teq is a distinct and decoupled property from Tm (Eisenthal et
al., 2006).
Alternative substrates were tested on enzymes, and it was found that different substrates gave different experimental values for ∆Heq, Teq, ∆Gcat
‡
and ∆Ginact‡
(the output parameters) (Peterson, 2005). From this, the molecular difference between Eact and Einact was hypothesised to be a
change at the active site, seeing as Teq was substrate-specific. It was
suggested that NMR would be a possible method to investigate the molecular basis for the Keq equilibrium change, as long as Teq was
sufficiently below the enzyme Tm that a population of Einact could be
maintained for NMR timescales (~24 hours).
The extensive data gathered by 2007 (for ~40 enzymes) provided a large data set with not just ∆Heq, Teq, ∆Gcat
‡ and ∆Ginact
data on enzyme size, quaternary structure, growth temperature and other derivations from the output parameters. Hence, a correlation analysis was performed to see if any significant trends could be observed (Lee et al., 2007). Correlations between ∆Heq, HWHM (the temperature difference at t
= 0 between Topt and the temperature at which activity is half-maximal, on
the high-temperature side of the curve), and the difference between Teq & Topt were observed. As these parameters are linked mathematically, it is
unsurprising that they are correlated (Daniel et al., 2008; Lee et al., 2007; Peterson et al., 2004). Growth temperature was shown to have a strong positive correlation with Teq however, backing up inferences made earlier
about the relationship between Teq and optimal temperatures for enzymes
based on their environments (Daniel et al., 2008; Peterson et al., 2004; Thomas & Scopes, 1998).
Now that the model had been established, the methodology behind gathering experimental data was explored to ensure valid determination of parameters. As the rate equation described Vmax, yet most measurements
were not made under saturated conditions (due to substrate expense, solubility or other considerations), most gathered V data had to be corrected for KM influences (see Equation 1.5 and Equation 2.5). Other
considerations, such as product inhibition and the minimal amount of data points required for fitting of data to the model, were also explored (Daniel et al., 2007). Fitting was automated by a stand-alone MATLAB run-time program, which takes matrices of data and fits the model via a least-squares residual minimisation approach (Section 2.7.2) (Daniel et al., 2007). The validation culminated in a full analysis of the required conditions for reliable determination of EM parameters (Peterson et al., 2007).
The fitting of enzyme assay data was further streamlined by integrating the rate equation for the model (Equation 1.15 and Section B.1.6) which enabled processing using raw product concentration data (Peterson et al., 2007). This removed the steps of smoothing raw product data runs (in the time dimension) and then deriving the rate from the manipulated data. Although only minimal differences in output parameters were observed, this gave more confidence in the parameter derivations. The use of initial rates (called t0 runs) found linearly over the first few seconds of an assay
also gave valid parameters, useful for non-ideal enzymes. However, this excluded determining the time-dependent ∆Ginact‡ parameter. It was also
shown that discontinuous assays could be used for model data collection by reducing data sets to discontinuous points (Peterson et al., 2007).
Lastly, circular dichroism (CD) work was performed on the !-glucosidase
from Saccharomyces cerevisiae to probe the molecular basis for the Eact/Einact
species equilibrium. It was found that Einact is not significantly unfolded
and is structurally more similar to Eact than the denatured form (X) or a
molten-globule state (Daniel et al., 2009).
1.2.3.2The Current State of the Model
As of 2009, the EM had been tested against nearly 50 different enzyme/substrate combinations. Extremophile enzymes from the Pomeii worm (Alvinella pompejana) and its episymbionts have even been fitted to the model (Lee et al., 2008). All systems, “monomeric to hexameric, and including a citrate synthase where the active site is at a subunit interface” (Daniel et al., 2009) follow the model rate profile much more closely than that of the classical model, but the molecular basis for the Eact/Einact
equilibrium is still unknown (Daniel et al., 2008; Weinberg et al., 2008).
Value ∆Heq ∆Seq Teq Tgrowth units
Sub-Sub- unit MW ∑ MW Units kJ mol-1 kJ mol-1 kJ mol-1 kJ mol-1 K-1 (°C) (°C) # (kDa) (kDa) Av. 68 96 213 638 58 40 2.0 46 91 Std. Dev. 9 5 177 517 15 19 1.6 21 89
Table 1.1 – Average values for enzyme/substrate systems fitted to the equilibrium model
The range of output parameters for 28 model enzyme/substrate systems is shown (Table 1.1) (Daniel et al., 2009). ∆Seq is the entropy of equilibrium, Tgrowth is the optimum growth temperature for the source organism,
sub-units is the number of monomers in the enzyme complex and MW is the molecular weight of each monomer or complex (∑). There is relatively little variance in the free energies of catalysis and inactivation, but large variance in the enthalpy change of equilibrium. This reflects how ∆Heq
∆Gcat ‡
∆Ginact
describes the broadness or sharpness of the Keq transition. The range of Teq
is from ~18-90 °C, with the Tgrowth ranging from ~2-75 °C, mirroring earlier
work showing a ~20°C increase in Teq over Tgrowth (Daniel et al., 2008;
Peterson et al., 2004; Thomas & Scopes, 1998).
1.3
Barnase
1.3.1Structure and Expression
Barnase is a small 110-residue RNase produced by Bacillus
amyloliquefaciens that has been studied since the early 1980s (Mauguen et
al., 1982). It has a major helix consisting of residues 6-18 (helix1), two
smaller helices to complete the first half of the sequence, then five antiparallel strands making up the ß-sheet. The packing of helix1 onto the
ß-sheet creates the first of three hydrophobic cores (Fersht, 1999). As barnase is such a small (Mr≈ 12383 Da) functional enzyme, it has been the
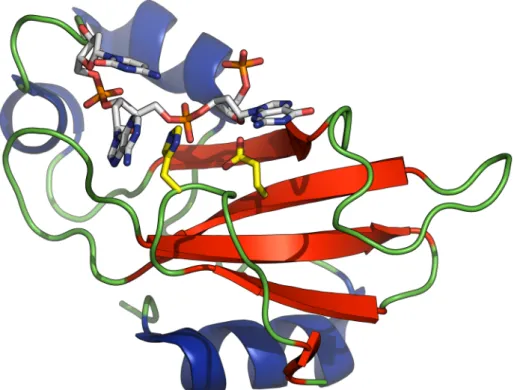
focus of many studies over the past ~25 years. A cartoon representation of wild-type (WT) barnase (Figure 1.8) with the helices in blue and sheets in red is taken from a 1.7 Å-resolution crystal structure deposited in the PBD (1BRN) (Buckle & Fersht, 1994) and ray-traced using PyMol 1.2r1 (DeLano Scientific LLC, USA) (DeLano, 2002).
Barnase was first expressed, with its structure and properties also determined, in 1982 (Mauguen et al., 1982). In its natural operon, barnase is expressed with its inhibitor, barstar, which is an 89-residue protein of mixed !- and ß-structure – both proteins are expressed together to ensure non-toxicity to the expression cell (Hartley, 1988). The complex has an affinity (Kd) of ~ 10-14 M, one of the tightest known (Wang et al., 2004), and
the two bind fast with a rate (kon) of 108 M-1 s-1. Both barnase and barstar
fold alone in solution, reversibly denature, and neither has any post-translational modifications or disulphide bonds (Paddon et al., 1989).
Figure 1.8 – Cartoon representation of WT barnase from PBD 1BRN
1.3.2Substrates and Activity
Barnase cleaves RNA via a two-step hydrolysis; firstly, cleaving the phospho-ribose bond via internal 2,3’-cyclisation to the sugar (transesterification), then (via a much less rapid reaction using the same catalytic residues in reversed roles) the hydrolysis of that bond (Day et al., 1992). Several studies have shown that the active site of barnase consists of subsites with strong preferences for certain nucleotides. Generally, a GpN motif is required for activity, with A > G > C > U in terms of activity at position N, where p is the phosphodiester bond. This is shown by the preference of barnase for GpN dinucleotides (Day et al., 1992). The pH profile for short (e.g. di-,tri-,tetra-nucleotide) substrates has a maximum at approximately pH 5-6, whereas longer substrates are favoured at higher pHs (~ 8-9) (Mossakowska et al., 1989).
Figure 1.9 shows another PyMol rendering of Figure 1.8, this time with a DNA substrate analogue (CGAC, GAC shown) fragment co-crystallised into the active site. Glu-73 and His-102, the general base and acid respectively, are shown in yellow carbons and the substrate in white carbons with orange for phosphorus. Day et. al (1992) showed that substrates of the type Zp0Gp1Xp2Y were favoured as before, but that
occupation of the p2 site led to a 1000-fold increase in kcat/KM. This means
that GpUp, with its low KM and single cleavage site is ideal for EM data
acquisition (Section 2.6.1) (Kippen et al., 1994).
Figure 1.9 – Barnase complexed with CGAC tetranucleotide (PDB 1BRN)
1.3.3Barnase and the Equilibrium Model
Barnase has been used extensively as a model protein, with >800 articles including “barnase” in their topic since 1989 in the ISI Web of Science database (Thomson Reuters, USA). This means that there is a wealth of information available on the folding and unfolding processes for barnase, the effects of many different point mutations (and x-ray and/or NMR structures of most of these) and extensive structural and functional data. It was hoped that this large reference set of data could go some way towards explaining the molecular basis of the EM if suitable barnase mutants were identified.
1.3.3.1Protein Folding Studies
Studies on the folding of barnase were first published in 1989, with the bulk of the work available in 1992. Early work (Matouschek et al., 1989) showed, using amino-acid point mutations and urea denaturation studies, that "-values (Fersht et al., 1992) could be used to approximate the
structure of the transition state and pathway of folding (and hence unfolding). The transition state ensemble for barnase was closely related to the folded form, with most secondary structure formed and only hydrogen bonds and loop docking to be completed (Serrano et al., 1992). The effect of temperature on the transition state has also been probed (Dalby et al., 1998).
The half-life for refolding of barnase (t1/2) is about 30 ms in the most
favourable conditions (Fersht, 1999). This is within the range (from tens of µs to tens of seconds) usually seen for WT proteins (Kubelka et al., 2004). Interactions were found to be synergistic, meaning that the sum of the ∆G
terms for each interaction was greater than each interaction alone (Horovitz & Fersht, 1992). This body of evidence means that the molecular basis for the Eact/Einact transition can be distinguished from processes that
are on-pathway to denaturation – for example, it is known that the docking of !-helix1 to the ß-sheet is preceded by secondary structure
formation in folding (Matouschek et al., 1989; Sancho et al., 1992).
1.3.3.2Mutations of Barnase
As part of the folding work, many mutations were made for "-value analysis and other experimental techniques. In 1991, for example, 64 mutations were characterised for their effects on stability (Serrano et al., 1992a). These were also characterised via x-ray structures etc. for their effects on hydrogen bonding, torsion angles, solvation and sidechain ordering in the folded protein. The following mutations were selected for this thesis research due to their minimal effects on active site residue ordering and sidechain ordering, meaning that Teq changes can be
attributed to changes in dynamics, not physical interactions.
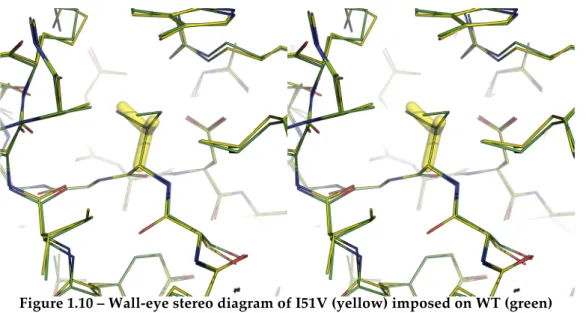
The I51V mutation (replacing isoleucine 51 with valine) was found to delete van der Waals’ interactions with two helices and three loops (Serrano et al., 1992a), decreasing stability by 7.53 kJ mol-1
. The mutant is shown superimposed on the WT (Martin et al., 1999), from PDB structure 1BSA. I51V, on ß-strand1, has a solvent-accessible surface area of 2 Å2,
making it almost completely buried within hydrophobic core2 (Buckle et
Figure 1.10 – Wall-eye stereo diagram of I51V (yellow) imposed on WT (green)
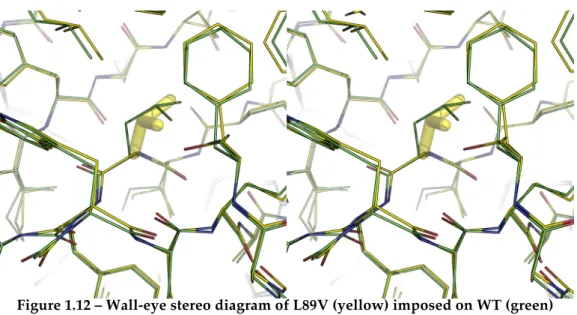
I88V and L89V are mutations either side of ß-strand3, with residue 88
pointing down into the middle of core1 and residue 89 the opposite way
into core3 (Serrano et al., 1992a). Both are completely buried; I88V deletes
the sidechain interaction with helix1 and L89V only causes minor
rearrangements of close residues with very little destabilisation of the protein as a whole (Buckle et al., 1993). Stereo views are presented below for I88V and L89V from PDBs 1BSC and 1BSE respectively (as above):
Figure 1.11 – Wall-eye stereo diagram of I88V (yellow) imposed on WT (green)
Rate constants of folding/unfolding for I51V, I88V and L89V are known (Matouschek et al., 1992), meaning that the shape of the three-dimensional EM rate profiles may be reconcilable with the relative speeds of refolding.
Figure 1.12 – Wall-eye stereo diagram of L89V (yellow) imposed on WT (green)
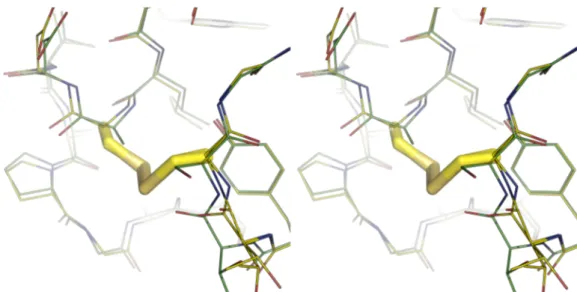
In 1993 the effect of buried hydrogen bonds on the stability of barnase was investigated (Chen et al., 1993). Removing the hydroxyl group of tyrosine via a Y78F mutation, two hydrogen bonds (to the chain CO and NH at G81, shown with black dashed lines) stabilising loop4 are deleted,
destabilising the structure to a similar amount as in I88V. The side chain van der Waals’ interactions to nearby residues were also altered slightly as they moved to compensate for the cavity, which was not filled with water (Chen et al., 1993). Refolding constants are also known (Chen et al., 1993).
Figure 1.13 – Wall-eye stereo diagram of Y78F (yellow) imposed on WT (green)
The above mutations all destabilise barnase and, hence, would also have to drop Teq by a large margin compared with Tm in order to have an
accessible Einact population (Section 1.2.3.1). In case this did not occur, a
active site as to not affect substrate binding or active site residue configurations. Hence, if Teq did not change, at least the Tm would be
significantly higher. Clarke and co-workers (Clarke & Fersht, 1993; Clarke et al., 1995a; Clarke et al., 1995b) have made several disulphide mutants of barnase, probing the effects on folding and stability. In the S80C/A43C double mutant (DM), a disulfide bridge was made between two residues known to pack together only after the rate limiting step for folding. Therefore, the structure was stabilised against unfolding which occurs ~20 times slower than in WT barnase (Clarke & Fersht, 1993). This was due to the covalent bonding between helix3 and loop4, where normally they are
not in contact.
Figure 1.14 – Wall-eye stereo diagram of S80C/A43C (yellow) imposed on WT (green)
It was shown, however, that the disulphide linkage induces slight disorder and rearrangement in nearby residues, with only T79 being severely disordered (Clarke et al., 1995a). This means that the DM is not as stable as could be predicted. Note that root mean square (RMS) values for the main chain showed that the majority of the structure, including the active site, was very close in structure to the WT (Clarke et al., 1995b). In conclusion, one mutant is significantly stabilised (DM), one significantly destabilised (I51V), one similar to the WT (L89V), and two of equal destabilisation through different means (I88V & Y78F). These properties are summarised in Table 1.2. The overlaid PDB files of the structures above (as PyMol session files) are in Appendix C.
Mutation I51V I88V L89V Y78F S80C/A43C ∆∆GU-FD50%
(kJ mol-1) 7.53 5.61 1.26 5.65 -8.79
Side-chain solvent
exposure (Å) 2 0 0 12 –
Table 1.2 – Thermodynamic and solvation properties of selected barnase mutants
∆∆GU-F
D50% is the difference in the ∆G U-F
D50% from WT to mutant (e.g. negative values are stabilising). ∆GUD-F50% is the change in free energy associated with
unfolding the WT or mutant at 50% [denaturant]. All values are from Serrano et. al (1992a) except for S80C/A43C (Johnson et al., 1997).
1.3.3.3Reversible Denaturation
A special property of barnase, and all mutants of barnase that fold spontaneously, is that they renature and do not appreciably aggregate (hence, do not form a kinetic “sink” for the denatured species X) (Sali et al., 1988). If a population of barnase is equilibrated at a temperature close to its Tm, there is an equilibrium between the folded and unfolded forms
(Matouschek et al., 1992). The EM for activity was expected to either a) not fit the data well or b) not fit the data at all, as it cannot account for renaturing (the one-direction kinact implies irreversible denaturation)
(Equation 1.14).
1.3.3.4NMR Accessibility of Mutants
Barnase is small enough (~12 kDa) that it is NMR-accessible. Sizes greater than ~50 kDa (the EM average being 91 kDa (Table 1.1)) have been inaccessible or problematic with traditional NMR experiments, although complexes of 300 kDa and 14 subunits have now been used successfully (Mittermaier & Kay, 2009). Proteins in complex with GroEL (~900 kDa) have also been studied (Fiaux et al., 2002). NMR has been performed on barnase extensively: structure determination (Bycroft et al., 1991), denatured structure studies (Arcus et al., 1995), pKa titrations (Loewenthal et al., 1992; Tan et al., 1995), catalysis (Meiering et al., 1993), hydrogen-exchange (Clarke et al., 1995b) and even real-time folding (Killick et al., 1998). Hence, probing the dynamics change in the Eact/Einact equilibrium
with a suitable mutant would be viable and comparable to a large body of previous work.
1.4
Research Objectives
The overall goal of this thesis was to identify and characterise either the wild-type or a mutant of barnase that would allow insight into the structural changes occurring over the Eact/Einact equilibrium. A major
contribution towards this goal would be decoupling the thermal stability of an enzyme from its thermoactivity through mutation(s) that either lower Teq or raise Tm. This would allow the Einact species to predominate at
temperatures lower than the Tm if the separation of Tm and Teq was
sufficient and the magnitude of ∆Heq for the enzyme was sufficient. The
following objectives make up this overall goal.
1.4.1Experimental
As elaborated in Section 1.2.3.2, the current EM only considers irreversible denaturation and the exact changes associated with Teq are currently
unknown. Therefore, the objectives for this research were to:
• generate mutants of barnase (Section 1.3.3.2) then express and purify them;
• determine Tm values and enthalpies of unfolding (∆HVH) determined
under the conditions used to assay the enzymes, using circular dichroism (CD), differential scanning calorimetry (DSC) and other appropriate techniques;
• acquire data for fitting to the EM, using previously characterised substrates (Section 1.3.2) and moving on to others if unsuccessful; • assess the experimental data to see if the interesting properties of
barnase (Section 1.3.3) fit to the model, or if barnase is an exception; and
• prepare barnase for NMR dynamics measurements (e.g. 15
N labelling, preliminary testing etc.).
1.4.2Theoretical
The theory behind the EM has been explained in introductory detail (Section 1.2). The mathematics, however, is not trivial and understanding the derivation of the full rate and product equations was important. For the purposes of NMR dynamics measurements, new mathematical derivations that describe EM species concentration changes with time and temperature were also required.
It was also investigated to see if a simpler model could be derived and checked against the data to adequately describe the observed kinetics. In addition, alternative derivations of equal complexity to the EM were investigated to see if they too could account for the observed rate profiles, or shed light on the movements of species within the EM. Lastly, to explore the full compliment of possible scenarios, a general model that could account for every possible instance of renaturation was developed and fitted against data.
2
Materials and Methods
2.1
Reagents and General Methods
Unless otherwise stated, all chemicals were purchased from Merk KGaA (Germany), BDH Chemicals Ltd (UK), Sigma-Aldrich Chemicals (USA), Applichem (Germany), Invitrogen (USA), Bio-Rad Laboratories (USA), Scharlau Chemie (Spain) or Fluka Biochemica (Switzerland). All percent values are in weight/volume unless noted otherwise. Details of reagents and buffers referred to below are given in Appendix A.
2.2 DNA, Transformation and Sequencing Methods
2.2.1PlasmidsPlasmid pMT1002 was obtained from Professor C. Nick Pace (Center for Advanced Biomolecular Research, Texas A&M University). pMT1002 (Addgene plasmid 8621) (Hartley et al., 1996) was synthesised by the Hartley group, based primarily on pMT416 (Addgene plasmid 8607) (Hartley, 1988).
Both plasmids require bacterial strains with the lacIq
gene (such as DH5-!, XL1-blue, SURE or HB107). pMT1002, which was used for all work in this thesis, has a temperature sensitive repressor gene (CI157) from lambda phage, followed by its own promoter and, in the forward direction, the PR promoter from # phage (Okorokov et al., 1994) for barnase (Hartley, 1988). Only a partial sequence of pMT1002 was available (see Section 2.2.4). pMT1002 was resuspended in 50 µL Tris buffer.
2.2.2 Nucleic Acid Concentration Determinations
The Nanodrop ND-1000 Spectrophotometer (Nanodrop Technologies, USA) was used to measure the concentration of DNA/RNA samples via extinction coefficients.
2.2.3 General Electroporation Methodology
The following was used for the transformation of WT pMT1002 plasmid into E
![Figure 1.4 – Plot of the Michaelis-Menten equation for enzyme kinetics 0!0.2!0.4!0.6!0.8!1!1.2!0!1!2!3!4!5!6!7!8!9! 10!V (multiples of Vmax)![S] (multiples of KM)!V"Vmax"KM"](https://thumb-us.123doks.com/thumbv2/123dok_us/800416.2601141/26.892.175.770.741.1126/figure-michaelis-menten-equation-enzyme-kinetics-multiples-multiples.webp)