U n i v e r s it y o f H e i d e l b e r g
Discussion Paper Series No. 535 482482
Department of Economics
Anticipating Long-Term Stock Market Volatility
Christian Conrad and Karin Loch
Anticipating Long-Term Stock Market Volatility
∗
Christian Conrad
†and Karin Loch
‡Heidelberg University, Germany
September 26, 2012
Abstract
We investigate the relationship between long-term U.S. stock market risks and the macroeconomic environment using a two component GARCH-MIDAS model. Our results provide strong evidence in favor of counter-cyclical behavior of long-term stock market volatility. Among the various macro variables in our dataset the term spread, housing starts, corporate profits and the unemployment rate have the highest predictive ability for stock market volatility. While the term spread and housing starts are leading variables with respect to stock market volatility, for corporate profits and the unemployment rate expectations data from the Survey of Professional Forecasters regarding the future development are most informative. Our results suggest that macro variables carry information on stock market risk beyond that contained in lagged realized volatilities, in particular when it comes to long-term forecasting.
Keywords: Volatility Components, MIDAS, Survey Data, Macro Finance Link
JEL Classification: C53, C58
∗We would like to thank Robert F. Engle, Eric Ghysels and Thomas Laubach, as well as the
par-ticipants at the Deutsche Bundesbank Research Seminar (Frankfurt, 2011), the KOF Swiss Economic Institute Brown-Bag-Seminar (Z¨urich, 2011), the Macro and Financial Econometrics Conference (Hei-delberg, 2011), the 20th Annual Symposium of the Society for Nonlinear Dynamics and Econometrics (Istanbul, 2012), and the EEA-ESEM joint meeting (Malaga, 2012) for helpful comments and suggestions. Christian Conrad gratefully acknowledges financial support from the “Juniorprofessorenprogramm” of the state of Baden-W¨urttemberg.
†Christian Conrad, Department of Economics, Heidelberg University, Bergheimer Strasse 58, 69115
Heidelberg, Germany, E-mail: christian.conrad@awi.uni-heidelberg.de; Phone: +49/6221/54/3173.
‡Karin Loch, Department of Economics, Heidelberg University, Bergheimer Strasse 58, 69115
1
Introduction
Although the question as to whether measures of economic activity do actually anticipate changes in stock market volatility dates back to Schwert (1989), the recent financial crisis has put this key issue back into the spotlight. For example, Paye (2012) and Christiansen et al. (2012) identify specific macroeconomic and financial variables that predict financial volatility. This paper complements these recent contributions by focusing on two aspects that have been neglected so far. First, we provide a detailed exploration of the lead-lag-structure between macroeconomic variables and volatility and, second, we analyze the role of expectations concerning current and future macro development in predicting volatility. We shall see that both issues are key to enhancing our understanding of the link between macroeconomic conditions and financial volatility.
In the empirical analysis we employ the GARCH-MIDAS model suggested in Engle et al. (2012) and analyze U.S. data for the 1969 to 2011 period. The GARCH-MIDAS is a two component volatility specification in the spirit of Ding and Granger (1996) and Engle and Lee (1999), and separates short-run fluctuations in volatility from long-term developments. Similarly, as in the Engle and Rangel (2008) Spline-GARCH model, the short-term component is specified as a unit GARCH process evolving around a long-term trend component which reflects macroeconomic conditions. In comparison to the Spline-GARCH, the GARCH-MIDAS has the advantage that it allows us to directly incorporate information on the macroeconomic environment into the long-term component. Using a flexible Beta weighting scheme, long-term volatility of daily stock returns is expressed as a weighted average of either lagged (one-sided filter) or lagged and future (two-sided filter) values of lower frequency (e.g., monthly or quarterly) macroeconomic variables. While most of the literature on volatility modeling exclusively focuses on the GARCH component, within the GARCH-MIDAS framework the log GARCH component can be thought of as the residual of a regression of the log conditional variance on macroeconomic explanatory variables. The conditional mean of this regression equals the log of the long-term component, which is now the object of interest. Within this new framework, we can identify specific economic variables that anticipate changes in long-term volatility.
Our analysis extends the results in Engle et al. (2012) in several important directions. While Engle et al. (2012) exclusively focus on industrial production, the producer price index and their respective volatilities as explanatory variables, we consider a variety of measures of economic activity, inflation rates, interest rates, and leading indicators.
Fur-thermore, in order to obtain a realistic picture of the macroeconomic variables’ ability to anticipate changes in stock market volatility in real-time, we employ first release instead of revised data. Finally, combining first release data with expectations from the Survey of Professional Forecasters (SPF) allows us to estimate feasible two-sided filters.
Our main results can be summarized as follows. First, we confirm the counter-cyclical behavior of stock market volatility – this was first observed in Schwert (1989) – for a broad set of macro variables. Long-term volatility is negatively related to measures of economic activity, leading economic indicators as well as the term spread. Based on both in-sample fit and out-of-sample forecast performance, we show that macro variables carry information that is beyond that contained in lagged realized volatilities. Interestingly, we do not find a significant relationship between measures of inflation and stock market volatility.
Second, we identify several leading variables with respect to stock market volatility. That is, the optimal weighting schemes for these variables do not decay from the begin-ning but are rather hump-shaped. Among these leading variables, the term spread and housing starts perform best in terms of variance ratios and out-of-sample forecasting. In particular, the long-term component based on the term spread nicely increases before all the recessions in our sample. The term spread specification clearly indicates stock market risks appearing well in advance of the recent financial crisis. The close relationship be-tween the term spread and stock market volatility is not surprising given the widespread awareness of the term spread as a leading indicator for economic activity.
Third, for some variables which are characterized by strictly decreasing weights, we find that the performance can be substantially increased by using a feasible two-sided filter which combines first release data with SPF expectations about the future. Specifically, for corporate profits, the unemployment rate, and real GDP, the feasible two-sided filters are preferred to their one-sided counterparts in terms of in-sample fit and variance ratios. Although our analysis is about predictability and not causality, the results from the feasible two-sided filters suggest that it is the current stance of the macroeconomy and, most importantly, expectations about future business conditions, that drive stock market volatility and not vice versa.
Fourth, the importance of expectations data receives further support when we com-pare the fit of one-sided specifications that are either based on first release or SPF data. According to the Akaike information criterium (AIC), for most variables the best specifica-tion is expectaspecifica-tions based, which suggests that theperceived stance of the macroeconomy
is a more important determinant of stock market volatility than the actual one. This interpretation is in line with Campbell and Diebold’s (2009, p.275) view that expected business conditions forecast future volatility because they are “linked to perceived system-atic risk and expected returns”. As an empirical application of the GARCH-MIDAS, we revisit the risk-return relationship and indeed find that there is a positive and significant relationship between expected excess returns and the long-term volatility component.
Fifth, we find that SPF measures of ex-ante uncertainty regarding future economic development are an important driver of long-term volatility. In line with the prediction of Veronesi’s (1999) model, our estimates suggest that the same piece of news will have a stronger impact in times of high economic uncertainty than in times of low economic uncertainty. Specifically, higher inflation uncertainty is associated with increasing stock market volatility. Moreover, we find survey based ex-ante uncertainty measures to be more relevant than the ex-post volatility proxies used in Engle et al. (2012).
In summary, we not only find further evidence in favor of the counter-cyclical behavior of stock market volatility, but also single out specific macroeconomic variables that have the ability to anticipate changes in long-term volatility well in advance. In order to uncover the relation between macroeconomic conditions and volatility, it is crucial to first understand the lead-lag-structure between each of these variables and stock market volatility, i.e., whether the variable is leading or whether it requires the combination with expectations data. The most important variables appear to be the term spread, housing starts, corporate profits, unemployment rate, and inflation uncertainty. We can think of these variables as carrying information about the current and future state of the economy, business conditions, and monetary policy. In addition, we illustrate three applications of the GARCH-MIDAS model. Besides risk-return regressions, we consider the ability of the GARCH-MIDAS model to assess “the risk that risk will change” and evaluate how stock market volatility responds to specific macroeconomic stress scenarios.
As mentioned before, our paper can be considered as complementary to Beltratti and Morana (2006), Paye (2012), Dorion (2012), Corradi et al. (2012), and Christiansen et al. (2012), for example. We would like to emphasize an important advantage of the GARCH-MIDAS in comparison to previous approaches. The literature typically focuses on predictive regressions of the type
log(pRVt) =a1+a2log( p
RVt−1) +a3Xt−1+ζt, (1)
explanatory variable (see, for example, Paye, 2012, and Christiansen et al., 2012). The
GARCH-MIDAS framework makes it clear that we should think of log(√RVt) in Eq. (1)
as a noisy measure of the (log) long-term volatility component. Hence, using log(√RVt)
does not only bias the estimate of a2 towards zero, but also increases the standard error of ba3 and, hence, makes it difficult to detect the effect of Xt−1 (see Engle et al., 2012). Apart from the problem that higher order lags of Xt are ignored, this insight might be
another explanation for the relatively weak empirical evidence in the previous literature. By separating the short- and long-term volatility components, the GARCH-MIDAS model bypasses these inferential issues and allows us to determine the effect of the macroeconomic environment on stock market volatility.
The remainder of this article is organized as follows. Section 2 introduces the GARCH-MIDAS component model. The data and empirical results are presented in Sections 3 and 4. Finally, Section 5 illustrates three applications of the GARCH-MIDAS model and Section 6 concludes the article.
2
The GARCH-MIDAS model
The present value models of Campbell (1991) and Campbell and Shiller (1988) illustrate that unexpected returns can be associated with news that lead to revisions in the dis-counted sum of future expected dividends and returns. Specifically, the same news can have a small or large impact on unexpected returns depending on whether it affects ex-pectations over short or long horizons. The volatility component models considered in this article capture this idea by relating the size of the news’ impact to variables that describe the stance of the macroeconomy and, hence, carry information about expected future cash flows. For example, Engle and Rangel (2008) assume that daily unexpected returns can be described by a two component volatility model, i.e.
ri−E[ri|Fi−1] =√giτiZi, (2)
where ri are daily log returns,Fi is the information set available at day i, Zi iid
∼ (0,1),gi
is a unit GARCH process and τi is an exponential spline function. While the short-term
volatility component gi represents the well-known day-to-day clustering of volatility, the
smooth long-term component τi reflects the stance of the macroeconomy. Hence, Eq. (2)
illustrates how the same piece of news Zi can have strong/weak effects on unexpected
component is a deterministic function of time, the unexpected returns are non-stationary with time-varying unconditional variance equal to τi. Note that if the long-term
compo-nent is constant, Eq. (2) is reduced to a standard GARCH process with unconditional variance τ.
The drawback of the Spline-GARCH model is that it does not directly incorporate information on the macroeconomy in the long-term component. This is because the macro variables are typically observed at a lower frequency than the daily returns. Instead, Engle and Rangel (2008) opt for a two-step strategy. In a first step, they estimate the model at a daily frequency and then aggregateτito a lower, e.g. quarterly or yearly, frequency. In a
second step, the aggregated long-term component is regressed on a set of macroeconomic
variables. For a panel of nearly 50 countries, Engle and Rangel (2008) show that τi
behaves counter-cyclically - it is high during recessions and low during boom phases. In addition, long-term volatility is increasing with the variability in output growth, inflation, and short-term interest rates.
Since we intend to directly model the effects of the macro variables on long-term volatility, we rely on the GARCH-MIDAS model recently proposed in Engle et al. (2012). This approach allows us to combine daily return data with a long-term volatility compo-nent that is entirely driven by the evolution of low-frequency macro variables. We employ a variant of the model which assumes that the long-term component changes at the same frequency at which the macro variables are observed. In the following, we use the notation
ri,t−E[ri,t|Fi−1,t] =√gi,tτtZi,t, (3)
wheret= 1, . . . , T denotes a particular period, e.g. a quarter, andi= 1, . . . , N(t) the days within that period. The short-term component is assumed to follow a mean-reverting asymmetric unit GARCH process
gi,t = (1−α−β−γ/2) + α+γ·1{r i−1,t−E[ri−1,t|Fi−2,t]<0} (ri−1,t−E[ri,t|Fi−1,t])2 τt +βgi−1,t, (4) with α >0,β >0 and α+β+γ/2<1.
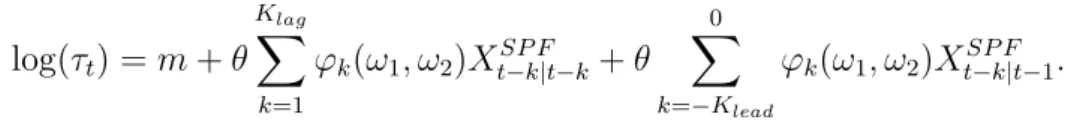
Following Engle et al. (2012), we consider two alternative versions of the long-term component. In the basic version long-term volatility is modeled as a weighted average of
lagged values of an explanatory variable Xt. We will refer to this version as aone-sided
filter. Alternatively, the extended version specifies long-term volatility as a weighted
corresponds to atwo-sided filter. In both cases, we opt for modeling log(τt) rather thanτt
itself which ensures the positivity of the long-term component. As explanatory variables we employ several measures of current economic activity, leading indicators, interest and inflation rates. We refer to these models as GARCH-MIDAS-X. Our benchmark specifi-cation employs quarterly realized volatility, RVt=PN
(t)
i=1 ri,t2 , as the explanatory variable
and is labeled as GARCH-MIDAS-RV.
The basic version of the long-term component is given by log(τt) =m+θ
K
X
k=1
ϕk(ω1, ω2)Xt−k (5)
with Beta weighting scheme ϕk(ω1, ω2) = (k/K)ω1−1 ·(1−k/K)ω2−1 PK j=1(j/K) ω1−1 ·(1−j/K)ω2−1. (6) Even for a largeK, Eq. (6) parsimoniously specifies the weightsϕk which are completely
determined by the two parameters ω1 and ω2. By construction, all ϕk are non-negative
and sum to one. For ω1 =ω2 = 1, the weights are equal, i.e., ϕk = 1/K for all k. The
restriction ω1 = 1, ω2 > 1 guarantees a decaying pattern, i.e., the maximum weight is
at the first lag. The rate of decay is then determined by ω2, whereby large values of
ω2 generate a rapidly decaying pattern and small values generate a slowly decaying one. Finally, the unrestricted scheme can generate hump-shaped or convex shapes.1 The
max-imum number K of lags to be included can be chosen through information criteria. Note
that if we restrict θto zero, the long-run component remains constant. As a consequence, the GARCH-MIDAS-X specification nests the asymmetric GARCH(1,1) process with an unconditional variance equal to exp(m).
Instead of considering one variable at a time, we can simultaneously include two vari-ables, say X and Y, into the long-run component
log(τt) =m+θX K X k=1 ϕk(ω1X, ωX2 )Xt−k+θY K X k=1 ϕk(ω1Y, ω2Y)Yt−k. (7)
Since this GARCH-MIDAS-X-Y model nests the individual GARCH-MIDAS-X (and GARCH-MIDAS-Y) model, one can directly assess the additional explanatory power of variable Y over variable X (and vice versa) by means of likelihood ratio tests (LRTs).
Next, we consider one-period-ahead volatility forecasts. Since at the beginning of pe-riodt the long-term volatilityτt is predetermined with respect toFN(t−1),t−1, the volatility
1
forecast for a specific day i within period t is given by
E[gi,tτtZi,t|FN2 (t−1),t−1] =τtE[gi,t|FN(t−1),t−1]. (8) Since E[gi,t|FN(t−1),t−1] = 1 + (α+β +γ/2)i−1(g1,t −1) converges to unity, i.e., to the unconditional variance ofgi,t, the forecast approaches the long-term component forilarge.
The volatility forecast for period t is then given by
E N(t) X i=1 gi,tτtZi,t|FN2 (t−1),t−1 =τt N(t)+ (g1,t−1) 1−(α+β+γ/2)N(t) 1−α−β−γ/2 ! . (9)
Clearly, if g1,t is equal to its unconditional expectation, the period t forecast would be
τtN(t), which resembles the square-root-of-time rule. For more than one-period-ahead
prediction, one needs to forecast the long-term component itself. We will come back to this issue in Section 4.3.
Finally, the long-term component with a two-sided filter is given by log(τt) =m+θ
Klag X
k=−Klead
ϕk(ω1, ω2)Xt−k. (10)
Two-sided filters are interesting because they reflect the idea that current stock market volatility depends not only on the past, but also the future state of the macroeconomy. Although Engle et al. (2012) have shown that, e.g., future industrial production has predictive power for contemporaneous stock market volatility, the pure two-sided model
is infeasible in real-time since it involves data that is not available in period t−1. In
Section 4.2, we will focus on feasible two-sided filters which are entirely based on data available at time t− 1. In these models Xt−k, k = −Klead, . . . ,0 will be replaced by
the corresponding expectations from the SPF. It is important to note that our two-sided specification includes one scaling parameter θ that affects both past and future realizations. Hereby, we slightly deviate from the two-sided specification presented in Engle et al. (2012), who allow for different slope coefficients for lags and leads. The advantage of our specification is that, besides from being more parsimonious, one can directly interpret the estimated shape of the weighting scheme and infer whether more weight is put on past or future realizations.
We estimate the model parameters via quasi-maximum likelihood. The asymptotic normality of the quasi-maximum likelihood estimator for a ‘rolling window’ version of the GARCH-MIDAS-RV has been established in Wang and Ghysels (2011). To the best of our knowledge, asymptotic results for the general GARCH-MIDAS-X model are not yet available.
3
Data
In the empirical analysis, we focus on the S&P 500 and U.S. macroeconomic data for the 1969 to 2011 period. We consider daily stock returns and combine (first release) macroe-conomic data with expectations from the SPF. The specific choice of macro variables is motivated by their availability in the SPF. To match our datasets, all macro variables are considered at a quarterly frequency. For data that are available at a monthly or daily frequency, we take quarterly averages of the levels. Expectations data are obtained from the database at the Federal Reserve Bank of Philadelphia, while all other variables are obtained from the FRED database at the Federal Reserve Bank of St. Louis.
3.1
Stock market data
We consider continuously compounded daily S&P 500 stock return data,ri,t, from January
2nd 1969 to December 30th 2011. Quarterly realized volatility is calculated as
RVt= N(t) X i=1 ri,t2 or RV adj. t = N(t) X i=1 ri,t2 1 {r2 i,t≤rN}. (11)
Following Mancini (2009), the latter measure adjusts for outliers by excluding squared returns above the thresholdrN =N−0.99 which depends on the average numberN of days
within a quarter. TakingN = 65 gives a threshold of 0.016 which is exceeded only by one observation on October 19th 1987, the so-called ‘black monday’, when the stock market collapsed by 22.9%. Thus, both realized volatility measures are identical except for the fourth quarter of 1987, where the adjustment reduces realized volatility by half.
3.2
Macroeconomic data
Data revisions can be substantial for macroeconomic variables. For example, Croushore (2011) shows that the average absolute revision from the first release to the latest available data on annualized quarterly U.S. output growth is 1.67%. Thus, employing revised instead of first release data can be misleading when it comes to forecast evaluation (see, for example, Stark, 2010). To obtain a realistic evaluation of the various GARCH-MIDAS-X models, we try to match the information that is used in our econometric specification with the one that was available to market participants. That is, for those macro variables which undergo revisions, we employ the advance estimates as published by the Bureau of
Economic Analysis.2
We employ macro data on the current stance of the economy, inflation rates, interest rates, as well as leading indicators. The variables that describe the current stance of the economy are real GDP, industrial production, the unemployment rate, housing starts, real personal consumption, and nominal corporate profits after tax. For all variables except the unemployment rate, we calculate annualized quarter-over-quarter percentage changes as3
100·((Xt/Xt−1)4−1). (12)
For the unemployment rate, we consider the first difference of the respective level. Inflation measures are based on the CPI as well as on the GDP (chain-type) deflator, and are expressed in annualized quarter-over-quarter percentage changes.4 To account for interest rate developments, we calculate the term spread as the difference between the 10-year Treasury bond yield and the 3-month T-bill rate.
Besides the growth rates, we also construct proxies for macro volatilities. We follow the regression approach in Schwert (1989) and Engle et al. (2012) and measure the volatility of a specific macro variable Xt by the absolute residual |ξˆt| from the following AR(4)
model Xt= 4 X i=1 δiDit+ 4 X i=1 φiXt−i+ξt, (13)
where Dit are seasonal dummies.
All the afore mentioned variables are part of the SPF dataset. Additionally, we include three leading indicators: the Chicago Fed national activity index (NAI), the new orders index of the Institute for Supply Management (ISM), and the University of Michigan consumer sentiment index.
Table 1 presents summary statistics for all variables in our dataset, while the corre-sponding times series are plotted in Fig. 1 and Fig. 2.
2
Nevertheless, our evaluation is not fully in real-time. This is because the advance estimate ofXt−1
is published in quartertand therefore not included in the information setFt−1. 3
This definition of annualized quarter-over-quarter growth rates coincides with the one used in the SPF.
4
We include first release data for all variables, except for corporate profits and CPI inflation. For the latter, data vintages are only available since 1994:Q3. To match the data on corporate profits to the SPF dataset, we include inventory valuation (IVA) and capital consumption adjustments after 2006:Q1.
3.3
Expectations data
The expectations data are obtained from the SPF, which has been conducted since the fourth quarter of 1968. The number of variables included in the survey has been gradually expanded over the years and, as a consequence, expectations data are not available over the full sample for some of our variables (see Table 1 for more details). The survey is conducted after the release of the Bureau of Economic Analysis’ advance report, i.e., survey participants know the first release data for the previous quarter when they make their predictions. We consider median expectations of the respective variables for the quarter in which the survey is conducted, denoted by XSP F
t|t , and forecasts up to three
quarters ahead, denoted by XSP F
t+k|t, k= 1,2,3.5
Moreover, the survey provides cross-sectional measures of forecast dispersion that can be used to quantify the disagreement among forecasters. These dispersion measures are calculated as the difference between the 75th percentile and the 25th percentile of the individual point projections. We include dispersion measures of the respective growth projections for all variables, except for the unemployment rate where the dispersion mea-sure is based on level projections.
4
Empirical results
We first present estimation results for various one-sided specifications in Section 4.1 and then turn to two-sided models in Section 4.2. To complete our model comparisons, Sec-tion 4.3 discusses the out-of-sample forecast performance of the one- and two-sided com-ponent models. Since we employ daily return data, we assume that the conditional mean is constant, i.e. we set E[ri,t|Fi−1,t] =µ.
4.1
One-sided filters
For the time being, we consider one-sided filters, i.e., long-term volatility is assumed to depend on the lagged values of a macro variable. In Section 4.1.1, we first investigate whether we can confirm the counter-cyclical behavior of long-term volatility that was detected in Engle et al. (2012) for a broader set of macro variables. In Section 4.1.2, we then analyze the question whether macro variables still contain predictive information
5
The survey also includes four-quarter-ahead forecasts, but these series contain some missing obser-vations at the beginning of the sample and will therefore not be considered in our analysis.
on long-term volatility once one controls for lagged realized volatility. Thereafter, we identify variables that lead long-term volatility and, hence, require flexible unrestricted one-sided filters in Section 4.1.3. Finally, in Section 4.1.4 we compare the explanatory power of the first release data with the one of survey expectations and analyze whether ex-post measures of macro volatility or ex-ante measures of disagreement concerning future development are more informative on long-term risks.
4.1.1 On the counter-cyclical behavior of long-term volatility
As a starting point, we consider a restricted weighting scheme which forces the opti-mal weights to be strictly decreasing (i.e., we set ω1 = 1). To facilitate comparability across models, we chooseK = 12 for all variables which corresponds to three MIDAS lag
years.6 The estimation results for the various GARCH-MIDAS-X models are summarized
in Table 2.
We first note that the estimates of the GARCH parameters (µ, α, β, γ) are significant at the 1% level in all cases. The estimates ofαandβtake the typical values and, consistent with the leverage effect, the parameter γ is found to be positive.7 Next, we have a closer look at the estimates of the long-run component τt. Recall, that the scaling parameter θ
is interesting in terms of its sign and significance. First, for all GARCH-MIDAS-X models which are based on variables that characterize the current stance of the macroeconomy the estimatedθ is highly significant (in all but one case at the 1% level) and has the expected
sign. For example, for real GDP, the estimated θ is negative meaning that an increase
in the growth rate is associated with a decline in long-term volatility. Conversely, the positive θ for the unemployment rate indicates that a rise in unemployment is associated with higher long-term volatility. That is to say, in all cases the sign of the scale parameter confirms the counter-cyclical property of long-run volatility. Second, for both inflation
measures the estimated θ is positive but insignificant. This is in line with Engle et
al. (2012), who report a significant effect of producer price inflation only in samples which are dominated by the period of high and variable inflation during the 1970s. Third, the
6
As long as the chosenK is large enough, we find the estimation results to be robust with respect to the specific choice of the maximum number of lags included. That is, when we varyK the parameterω2
adjusts such that the weighting schemes remain unchanged and level off at the same lag. In the following, we always include three MIDAS lag years.
7
Since in all cases the estimates ofγ are highly significant, we prefer theasymmetric GARCH speci-fication to the symmetric one employed in Engle et al. (2012).
estimate of θ is negative and highly significant for the term spread. This finding squares with the common evidence that the term spread is a powerful predictor of future economic activity and recessions (see, for example, Estrella and Hardouvelis, 1991, Estrella and Mishkin, 1998, and Ang et al., 2006). In our view, this link mainly exists because the term spread incorporates expectations about future monetary policy. It appears that its ability to predict economic growth translates into anticipating changes in the long-run volatility component. Fourth, for all leading indicators, θ is estimated to be negative and highly significant. Fifth, both baseline GARCH-MIDAS-RV specifications lead to very similar parameter estimates. As expected, lagged realized volatility is positively linked to current long-term volatility.8
Next, it is interesting to compare the estimated weighting parameters across the differ-ent macro variables. Recall that the size ofω2 determines how fast the weights ϕk decay
to zero. Fig. 3 shows the estimated weighting schemes for four selected variables. We find the largest values of ω2 for the NAI (ˆω2 = 7.82) and the unemployment rate (ˆω2 = 6.86). For these variables, the optimal weights decline rapidly and roughly become zero beyond two MIDAS lag years. In sharp contrast, the estimates ofω2 are below two for the models including housing starts, the term spread, and consumer sentiments. The low value ofω2 implies almost linearly decaying weights, i.e., the optimal weights are such that observa-tions which are in the distant past still play an important role. We take this as a first indication that the restriction ω1 = 1 might be problematic for these variables. Indeed, in Section 4.1.3 we shall see that these are leading variables with respect to long-term volatility and, hence, require an unrestricted weighting scheme.
Finally, we can evaluate the fit of the various (two-component) GARCH-MIDAS-X models against the nested (one-component) GARCH specification using LRTs. With the exception of the two inflation based models, the LRTs clearly favor the two component specifications. Furthermore, the various models can be ranked by means of the Akaike Information Criterion (AIC). Within each group of variables, housing starts, the term spread and new orders achieve the lowest AIC. Note, that the models based on housing starts and new orders also yield a lower AIC than the one including past realized volatil-ity. Fig. 4 shows the long-term component, τX
t , and the quarterly conditional volatility,
τX
t gtX =τtX
PN(t)
i=1 gi,tX, from the corresponding GARCH-MIDAS-X models along with the
8
The only notable difference is thatω2 is significant in the specification based onRVtadj.but
insignifi-cant in the one usingRVt. SinceRVtadj.andRVtdiffer in the fourth quarter of 1987 only, the discrepancy
realized volatility, RVt. Note that RVt is typically high during recessions and low during
expansions, i.e., stock market volatility is negatively related to economic activity. The four long-term components mirror this counter-cyclical pattern of stock market volatility nicely. Nevertheless, there are also distinct differences. The long-term component corre-sponding to housing starts, τHS
t , increases during the turbulent economic periods of the
70’s, 80’s, and the recent financial crisis. Unsurprisingly, it does not explain the high volatility around the dot-com bubble in the early 2000’s. The long-term volatility based on the term spread, τT S
t , clearly increases well before all the recessions and appears to
actually anticipate them. For example, τT S
t begins to increase in 2005, hence signaling
uprising stock market risks well before the official start of the last recession in December 2007. Given that the NBER dated December 2007 as the beginning of the recession only one year later in December 2008, the leading property ofτT S
t is even more impressive. In
contrast, the long-term volatility based on new orders, τN O
t , typically takes its maximum
towards the end of a recession and is therefore rather coincidental. Furthermore, τT S t is
much smoother than τN O
t which directly reflects the differences in ˆω2. In contrast, the
long-run volatility component from the GARCH-MIDAS-RV model,τRV
t , is dominated by
the 1987 stock market crash and the recent financial crisis. It hardly increases during the other recession periods. Moreover, while the other long-term components often gradually increase well before recessions, the behavior of τRV
t is much more backward looking.
Our preliminary analysis extends the results of Engle et al. (2012) by showing that the counter-cyclical macro finance link is robust to a broader set of variables. In particular, we find that all variables except real consumption and the inflation series yield a better fit (in terms of lower AICs) than industrial production.9
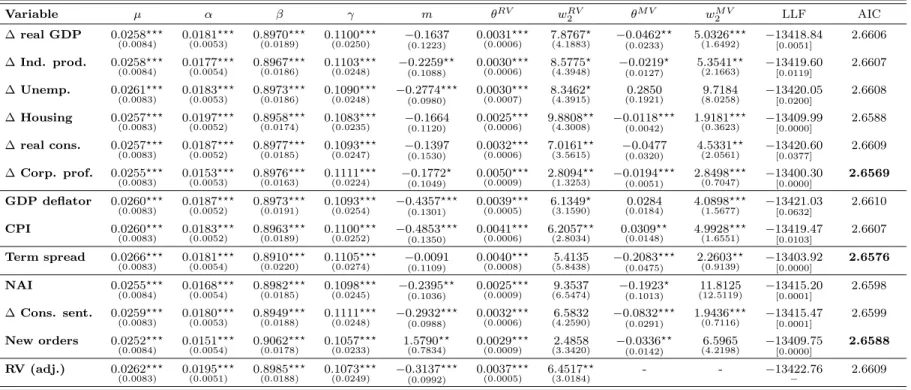
4.1.2 Combining macro information with realized volatility
Fig. 4 suggests that macro variables carry information about long-term volatility that is complementary to the information contained in realized volatility. To formally test whether the various macroeconomic variables indeed have additional explanatory power over realized volatility, we now model long-term volatility through Eq. (7), i.e., by includ-ing quarterly realized volatility (RVtadj.) and a macro variable at the same time. Since the
GARCH-MIDAS-RV-X model nests the specification without a macro variable, a LRT 9
Engle et al. (2012) chose industrial production due to its availability for a period of more than a hundred years. Our result may be explained by the significant fall of importance in industrial production over time.
allows for a direct statistical comparison.
Estimation results are presented in Table 3. The scaling parameter associated with realized volatility, θRV, is significant at the 1% level across all models. Similarly, the
parameter associated with the macro variables,θM V, is significant for all macro variables
except for the unemployment rate, real consumption, and inflation (GDP deflator). Al-though the significance level of ˆθM V varies between 1% (e.g., corporate profits) and 10%
(e.g., industrial production), the corresponding LRTs clearly reject the null hypothesis. Even for the GDP deflator the corresponding p-value is 6%.10 Additionally, it is inter-esting to observe that ˆωRV
2 >ωˆ2M V in most cases, i.e., the weights attached to the macro variables decay more slowly than the weights attached to realized volatility. According to the AIC, the two best specifications are now based on corporate profits and the term spread.
Fig. 5 illustrates more clearly the effects of including eitherRVtadj. or the term spread
separately, or combining both into one MIDAS filter. As one would expect, the long-run component from the model including both variables,τT S−RV
t , typically lies in between the
long-run components τRV
t and τtT S. However, the improvement in terms of model fit does
not come for free. Note that before all recessions, the increase in τT S
t clearly precedes
the rise inτtT S−RV. That is, while combingRV adj.
t with macro variables may improve the
fit, the model which is exclusively based on the term spread better anticipates changes in long-run risk.
We would like to emphasize the importance of the previous results, since they clearly demonstrate that most of the macroeconomic variables considered in our analysis expose information on stock market risk beyond that contained in past realized volatility. The evidence in favor of the predictive ability of GDP growth, industrial production growth, or the term spread challenges the in-sample results in Paye (2012), who does not find that these variables predict future realized volatility when controlling for lagged RVt. These
seemingly conflicting results are likely due to the fact that the GARCH-MIDAS approach takes three MIDAS lag years of the macro variables into account, instead of only the first lag as in Eq. (1). In addition, it avoids the inferential problems of predictive regressions mentioned in the introduction.
10
The two inflation measures partly explain stock market volatility from the mid-1970’s to the mid-80’s, but this is barely the case thereafter.
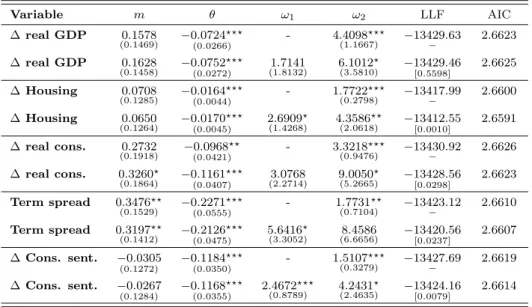
4.1.3 Unrestricted one-sided filters
When we discussed the estimates of ω2 in Section 4.1.1, the low values which were
ob-tained for some macro variables suggested that the restricted filter may be misspecified. In order to identify which macro variables are leading variables with respect to long-term volatility, we re-estimate all GARCH-MIDAS-X models including an unrestricted two parameter weighting scheme (see Eq. (6)). Recall that a leading variable requires hump-shaped weights, i.e., weights that do not decline from the beginning. We find this condition to be satisfied for the following variables: real GDP, housing starts, real personal consumption, the term spread, and the consumer sentiment index. For these variables, Table 4 compares the parameter estimates of the restricted and unrestricted weighting schemes. Note that the sign, magnitude and significance of the scaling parameter are roughly the same under both schemes. However, for all six variables except real GDP, the unrestricted model yields a lower AIC and a significantly higher log-likelihood when compared to the restricted model. Fig. 6, left, shows the two weighting schemes for real GDP. Although the unrestricted weighting scheme takes its maximum value at the second lag, the two weighting schemes are almost identical. This explains why for real GDP the AIC, as well as the LRT, do not favor the more flexible model. In sharp contrast, for the term spread the unrestricted filter takes the maximum weight at a lag of five quarters (Fig. 6, right). The estimated weighting scheme fits well with the evidence in Estrella and Mishkin (1998), who find that the term spread predicts real activity two to six quar-ters ahead. In comparison, the restricted scheme places too much weight on the most recent observations. For the term spread, the striking difference between the restricted and unrestricted weighting scheme explains the difference in the models’ AICs and the significance of the LRT. Similarly, the unrestricted weighting schemes are hump-shaped for housing starts, real consumption, and consumer sentiment (graphs omitted).
It is now interesting to compare the marginal effects of the different macro variables. The effect of a one standard deviation increase in Xt this quarter on long-term volatility
s-quarter-ahead can be calculated by exp(ˆθX
·ϕs(ˆω2X)· p
Var(Xt))−1. For instance, a one
standard deviation increase in industrial production this quarter, i.e., an increase by 6.66 percentage points, leads to a 7.67% decrease in long-term volatility in the next quarter. Fig. 7 illustrates the marginal effects of four selected macro variables over time. Based on the previous analysis, we include unrestricted weights for housing starts and the term spread, but restrict the weighting schemes for industrial production and corporate profits.
The figure shows that an increase in corporate profits has the greatest impact on volatility in the next quarter (-10.12%), whereas the greatest impact one-year-ahead is implied by an increase in housing starts (-12.47%). These examples illustrate the importance of including unrestricted weighting schemes (when appropriate) to correctly assess marginal effects over different horizons. In addition, the size of the marginal effects implies that they are not only highly significant statistically, but also economically.
Finally, hump-shaped weighting schemes are a further explanation for the weak evi-dence in favor of a link between macroeconomic conditions and stock market volatility in the previous literature. Since only the first lag of the macro variable enters predictive regressions like Eq. (1), they are not adequate for capturing the effect of leading variables.
4.1.4 Survey expectations and uncertainty
Eq. (2) suggests that – depending on thestance of the macroeconomy – the same piece of news can have either a large or small impact on unexpected returns. So far, we have tried to extract information about macroeconomic conditions from first release data. However, it is possible that the markets’expectations concerning these macro figures are even more closely related to stock market volatility than the first release data itself. We investigate this hypothesis by extending the analysis in two directions.
First, in Eq. (5) we replace the realizations Xt−k of the macro variables with the
corresponding median SPF expectations XSP F
t−k|t−k. Recall from Section 3 that for some
variables – such as real GDP –Xt−1 is published with a delay and, hence, not available in t−1. In contrast, the real-time expectationsXSP F
t−k|t−k,k = 1, . . . , K, are known int−1 and
therefore describe the market participants’ information set more accurately. Moreover, since market participants are aware that first release data are subsequently revised, they could prefer to rely on expectations data.11 Furthermore, Campbell and Diebold (2009) argue that expectations data are linked to expected returns as they carry information
about time-varying risk. The SPF data allows us to test whether the perceived rather
than the actual stance of the macroeconomy does indeed impact more strongly on stock
market volatility.
Second, there might also be a relationship between stock market volatility and the uncertainty about macroeconomic fundamentals. For example, Veronesi (1999) provides
11
Stark (2010) shows that for some variables, e.g., real personal consumption, the SPF forecasts are indeed closer to the final data than to the first releases.
a theoretical model which predicts that the sensitivity of investors to news increases with the degree of economic uncertainty. Engle et al. (2012) try to proxy economic uncertainty through the regression-based volatility measures (see Eq. (13)) suggested in
Schwert (1989). We conjecture that survey based ex-ante uncertainty measures are more
appropriate than ex-post regression based volatility proxies (see also David and Veronesi, 2009, and Arnold and Vrugt, 2008). As an ex-ante measure we employ the disagreement among the SPF forecasters as described by the interquartile range of the individual point forecasts. To analyze the potential effect of this dispersion measure at different horizons, we use disagreement concerning the respective macro variable in the current quarter,
disp(XSP F
t|t ), as well as three quarters into the future, disp(X SP F t+3|t).
Table 5 presents the parameter estimates for the various model specifications. For each macro variable, the bold figures indicate whether the AIC favors the specification based on first release/expected figures or on volatility/dispersion measures. We first compare the models based on first release figures with the ones based on SPF expectations. In all cases, the estimated θ has the same sign in both specifications. The main difference occurs for real consumption, where ˆθ is insignificant for the first release data but highly significant for the SPF expectations. In addition, for all variables bar housing starts, the AIC prefers the SPF-based specification (although for some variables the difference between the AICs is small). The estimates are in line with Campbell and Diebold’s (2009) finding that expectations data capture information about perceived systematic risk and are hence linked to stock market volatility.
In the specifications including the regression based volatility measures, ˆθ is marginally significant for only three out of the eight macro variables. In sharp contrast, for all macro variables at least one of the dispersion measures leads to a significant ˆθ. Similarly, the AIC always favors one of the dispersion measure-based specifications. As one would expect, higher dispersion in expectations increases stock market volatility.12 For example, higher dispersion in expectations about future CPI inflation, which may be thought of as uncertainty regarding future monetary policy, predicts higher volatility. Interestingly, in most cases it is the three-quarter-ahead uncertainty measure that has the strongest impact. Hence, in line with Arnold and Vrugt (2008), our results suggest that stock market volatility responds much stronger toex-ante uncertainty than toex-post measures of volatility.
12
In summary, our results highlight the role of expectations in determining stock market volatility. In particular, periods of high uncertainty regarding the future development of the macroeconomic environment appear to be an important driver of long-term volatility.
4.2
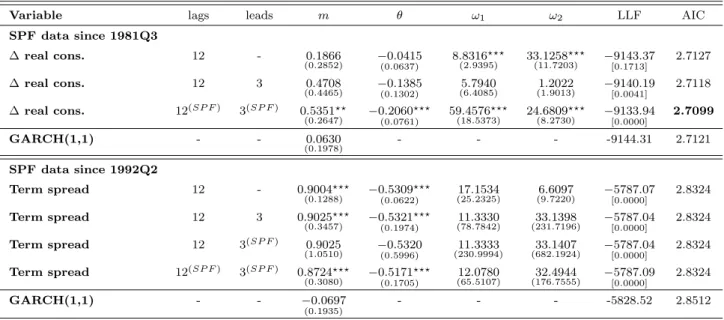
Two-sided filters
So far, we considered the one-sided specification given by Eq. (5). Engle et al. (2012) have suggested that the performance of the GARCH-MIDAS model can be further improved by including future values of the macro variable, i.e., by using a two-sided filter. Although future values ofXtmay contain useful information about current long-term stock market
volatility, the two-sided specification considered in Engle et al. (2012) isinfeasible in real-time. Instead, in this subsection we consider feasible versions of the two-sided filter. Our idea is simply to replace the future values Xt−k, k = −Klead, . . . ,0, that are unknown
in t − 1 with the corresponding survey expectations XSP F
t−k|t−1. We believe that these survey figures are closely related to the expectations on future dividends and returns that determine the current level of long-term volatility.13
Table 6 provides a comparison of four alternative specifications. For each macro vari-able the first line presents the estimates of the restricted/unrestricted one-sided filter (depending on whether Xt is a leading variable according to Table 4). The second line
refers to the infeasible two-sided specification given by Eq. (10). Finally, we consider two feasible two-sided specifications. The first one is given by
log(τt) =m+θ KXlag k=1 ϕk(ω1, ω2)Xt−k+θ 0 X k=−Klead ϕk(ω1, ω2)XtSP F−k|t−1, (14)
i.e., it combines first release data from the past with SPF expectations for the future. The second one is entirely based on SPF expectations and additionally replaces the first release data with the corresponding real-time SPF expectations
log(τt) =m+θ Klag X k=1 ϕk(ω1, ω2)XtSP F−k|t−k+θ 0 X k=−Klead ϕk(ω1, ω2)XtSP F−k|t−1. (15) 13
Alternatively, we could also use forecasts based on simple times series models. We prefer the SPF ex-pectations for two reasons. First, as pointed out by Stark (2010, p.2): “the surveys projections generally outperform the benchmark projections of univariate autoregressive time-series models at short horizons”. Second, Campbell and Diebold (2009, p.270) argue that survey “forecasts contain considerable informa-tion regarding expectainforma-tions about future business condiinforma-tions over and above any that may be contained in the macroeconomic variables”.
For all variables, we choose Klag = 12 and Klead = 2. Note that the leading part of the
two feasible specifications includes SPF expectations up to three quarters ahead.
Intuitively, we would expect that two-sided filters are most useful in case of variables for which the restricted weighting scheme is preferred, i.e., which place the highest weight on the most recent observations. Conversely, leading variables which require unrestricted weighting schemes and place most weight on observations in the past, should benefit less. Table 6 confirms this intuition. First, in all cases where the optimal one-sided filter is the restricted one, the AIC clearly favors a two-sided specification. Except for the unemployment rate, the best two-sided filter is the feasible one which is entirely based on survey expectations as in Eq. (15). Second, while for the term spread all four specifications yield the same AIC, the information criteria slightly favor a two-sided specification for the remaining two leading variables.
Next, we graphically illustrate the benefits of the feasible two-sided filters. Fig. 8, left, shows the estimated weighting schemes for the unrestricted one-sided, infeasible and feasible two-sided specifications for the unemployment rate. Recall that for the unem-ployment rate, the optimal one-sided filter is the restricted one. Clearly, the weighting functions of the two-sided specifications place considerable weight on future values of un-employment. Hence, for such a variable, the availability of the SPF expectationsXSP F
t−k|t−1,
k =−Klead, . . . ,0 is most valuable. Fig. 8, right, compares the long-term components of
the (restricted) one-sided, infeasible two-sided and the preferred feasible two-sided, i.e., the one given by Eq. (15), specification. The figure clearly shows that the long-term com-ponent of the infeasible two-sided model is shifted to the left, i.e., is leading compared to the one-sided specification. Most importantly, the feasible long-term component is much closer to the infeasible than to the one-sided specification, i.e. has the same leading qual-ity. This is not surprising since the AIC of the preferred feasible two-sided model is very close the AIC of the infeasible one. Thus, feasible two-sided filters do have the ability to anticipate changes in long-term volatility.
As another example, Fig. 9, left, shows the various weighting schemes for corporate profits. The information about the future development is again most valuable. Here, both feasible two-sided filters attach considerable weight to the future expected values of the macro variable. Finally, we consider housing starts. For this variable, the difference between the AIC of the unrestricted one-sided model and the best feasible two-sided model is almost negligible. This is not surprising, since housing starts is a leading variable and, as Fig. 9, right, shows, the unrestricted one-sided and feasible two-sided filters almost
coincide and attach most weight to past realizations.
Table 6 and Fig.s 8/9 clearly show that feasible two-sided specifications can be very beneficial in anticipating long-term stock market volatility. The fact that in most cases the specification which is entirely based on expectations data, i.e., Eq. (15), is the pre-ferred one, squares with our findings in Section 4.1.4 that the perceived stance of the macroeconomy can be more informative than the actual one based on first release data.
We provide a ranking of the various one- and two-sided specifications based on vari-ance ratios (VRs) to formally appreciate the information contained in the SPF expec-tations. In general, we can define the VR of a GARCH-MIDAS-X model as the frac-tion of the sample variance of the log of total quarterly volatility, Vard(log(τX
t gtX)) =
d
Var(log(τX
t )) +Vard(log(gtX)), that can be explained by the sample variance of the log
long-term component, Vard(log(τX
t )). For easier comparison across the various
GARCH-MIDAS-X models, we consider
V R(X) = Vard(log(τ X t )) d Var(log(τRV t )) +Vard(log(gRVt )) , (16)
which relates the sample variance of the log of the long-term component of a specific GARCH-MIDAS-X model to the sample variance of the log of the total variance of the
baseline GARCH-MIDAS-RV model. Table 7 presents the ranking of the one- and feasible
two-sided models for the period spanning 1972:Q1 – 2011:Q1.14 We calculate variance
ratios for models including either first release or expectations data, but we only report the specification yielding a higher VR.
Among the one-sided models, the term spread specification achieves by far the highest VR with a value of 57.48. The specification including housing starts yields the second highest VR of 23.08, and in third place we find the specification including real GDP, with a VR of 12.16. For the remaining models, the variation in the long-term volatility component explains roughly between 7% and 11 % of the variation in the total variance of the baseline model.15 The model including the GDP deflator performs worst, yielding a VR of only 1.60%. Note that among the top five models, three specifications are based on the unrestricted filter. Next, we turn to the feasible two-sided filters. Again, the term spread and housing starts perform best. Since both variables are leading variables,
14
Due to restricted availability of the SPF data, the VRs for real personal consumption and the term spread are calculated for samples starting in 1984:Q3 and 1995:Q1 respectively.
15
This is in line with Engle et al. (2012) who find a VR of 9.45 for the one-sided model including industrial production for the 1985-2010 sample.
using the two-sided feasible filter hardly changes their VR. For all other models, the VRs have strongly increased. Now, corporate profits is ranked third and its VR has increased from 11.47 to 16.81. We find the biggest increase for the model including the unemployment rate, where the VR more than doubles from 6.90 to 15.05. These observations are very much in line with our interpretation of Fig.s 8 and 9, left, which suggest that SPF expectations are highly valuable for these two variables. The results are also mostly consistent with our conclusions from Table 5. For instance, we find that both the one-sided and two-sided models including expectations of real GDP or real personal consumption yield higher VRs than the respective models including first release data. Finally, we would like to emphasize that the VR of the model including past realized volatility is 13.84 and that almost all of the feasible two-sided models achieve a higher VR.
4.3
Forecast evaluation
To conclude this section, we analyze the out-of-sample forecast performance of the one-and two-sided component models. We cut the full sample into roughly two halves one-and re-estimate all specifications for the 1969-1993 subsample. Using the subsample parameter estimates, we then calculate volatility forecasts as discussed in Section 2, c.f. Eq. (9), and measure the forecast error with respect to quarterly realized volatility. Since the focus of our work is on explaining and anticipating movements in long-run volatility, we evaluate one- up to four-quarter-ahead forecasts.
Recall that forecasts for the GARCH componentgi,tcan be obtained iteratively for any
horizon given the parameter estimates ˆµ,α,ˆ βˆand ˆγ. Since predictions of this component converge to one with an increasing forecast horizon, long-run volatility predictions are basically determined by the forecast of the τt component times the number of days within
the respective quarter. We first consider the one-sided specifications of the long-term component. The one-step-ahead forecast, ˆτt+1|t, can be directly obtained from Eq. (5).16
Obviously, this direct approach is infeasible for longer horizons. We suggest two alter-16
In the following we assume that the observation Xt is available for all macro variables in period
t, i.e., at the moment forecasts are conducted. Hereby, we deviate from a stringent real-time forecast evaluation since release schedules vary for the different variables. Feasible one-step-ahead forecasts could still be calculated by includingexpectations forXtobtained from the survey of the current quarter, but
to simplify matters we treat all variables equally. This way we can compare the forecast performance of models based solely on macro realizations with that of models augmented by expectations data.
native approaches to forecast the long-term component beyond the one quarter horizon. We either fix the long-term component at the one-quarter-ahead prediction, i.e., we set ˆ
τt+s|t = ˆτt+1|t for s= 2,3,4, or we obtain time varying forecasts by plugging in one- up to
three-step-ahead SPF forecasts of the respective macro variable. Note that in both cases, the short-run component still adjusts over the forecast horizons. The second approach is of course restricted to variables that are included in the SPF dataset. In particular, the long-run component has to be kept fixed at the one-step-ahead forecast for the GARCH-MIDAS-RV model. In a similar way, one can obtain volatility forecasts for the two-sided specifications, but forecasts of the long-run component have to be kept fixed beyond the first step. For a realistic evaluation, we now consider feasible two-sided models only (see Eq. (15)). Note that our approach is different from the one in Engle et al. (2012), who estimate GARCH-MIDAS models for varying frequencies (monthly, quarterly, biannually) of the long-term component and then calculate one-step-ahead forecasts only. Hence, they compare models with different levels of aggregation of macro information, whereas we stick to the same model specification and information set - possibly extended by expectations data.
We report two measures of forecast performance - the mean square error (MSE) and the mean absolute error (MAE), the latter being more robust to outliers. We choose the GARCH-MIDAS-RV as a benchmark and report ratios of the MSE (MAE) of a spe-cific GARCH-MIDAS-X and the benchmark model. Thus, a ratio below one implies an improvement upon the RV model. Finally, we also calculate volatility forecasts from a ran-dom walk model for realized volatility and from the restricted asymmetric GARCH(1,1) model to assess the general forecast performance of the GARCH-MIDAS models.
Results are shown in Table 8. The out-of-sample forecast horizon includes 68 peri-ods. At the one-quarter-ahead horizon, almost all specifications based on macro variables perform worse than the GARCH-MIDAS-RV model - exceptions are specifications that include unemployment, corporate profits, and the three economic indicators (MAE). The model performing best at this short horizon is the one including the leading indicator NAI. Overall, the benchmark model clearly dominates in one-quarter-ahead forecasting.
As expected from the results of the previous sections, models including inflation mea-sures show a comparatively poor forecasting performance over all horizons. Otherwise, relative forecasting performance improves with an increasing forecast horizon. Beyond the three-quarter-ahead horizon, most of the MSE and MAE ratios are less than one. For many models, the best relative forecasting performance is achieved at the one-year-ahead
horizon. For a few variables, relative forecasting performance can be further improved when including expectations data to obtain time varying forecasts of the long-run com-ponent. This is particularly true for those variables for which we found that expectations are most informative (see Table 5), such as real GDP and real personal consumption. Compared to the one-sided specifications, the respective two-sided ones do not improve forecasting performance.17
The models that perform best over the one-year-ahead horizon are the ones including the term spread, housing starts and corporate profits. In particular, the performance of the three respective one-sided models, as measured by the MAE, is significantly superior to the RV model.18 This confirms our previous conclusion that these three variables are best at explaining and anticipating movements in long-term volatility.
Turning to the general forecasting ability of the GARCH-MIDAS models, we note that all models perform better than the pure random walk model. Relative to the RV model, the restricted GARCH(1,1) model yields lower forecast errors over all forecast horizons. Nevertheless, roughly half of the GARCH-MIDAS macro models yield a lower forecast error than the GARCH(1,1) over the longer horizon. Our results support the finding in Conrad (2010) that the performance of component GARCH models relative to the simple GARCH(1,1) model improves with an increasing forecast horizon. Our results are also consistent with Engle et al. (2012), who find that forecasts from the GARCH-MIDAS models including macro variables tend to outperform the RV model on the longer biannual horizon.
5
Applications
This section illustrates three specific applications of the GARCH-MIDAS-X model: the risk-return relationship, the assessment of the term structure of risk, and stress scenario projections of long-term risks.
17
Initially, we also evaluated the forecasting performance of the models which combine realized volatility with macro variables. In general, these specifications performed worse than the GARCH-MIDAS-RV model, exceptions being models that include housing starts and the term spread. This finding is broadly in line with the out-of-sample forecasting regressions in Paye (2012). However, our result stating that models solely based on macro variables perform best, squares with the discussion in Section 4.1.2 which highlighted that the anticipating property of the long-term component is lost when it is augmented with realized volatility in addition to the macro variables.
18
5.1
Risk-return relationship
We now use the insights from our analysis of the GARCH-MIDAS model to have a fresh look at the risk-return relationship. According to Merton’s (1973) ICAPM, there should be a positive relationship between the expected excess return on the stock market and the market’s conditional variance
E[Rt−Rt,f|Ft−1] =λVar[Rt−Rt,f|Ft−1], (17) whereRf,t is the risk free interest rate andλis the relative risk aversion of the
representa-tive agent. Since the seminal contribution of French et al. (1987), there have been many controversial results regarding the sign and the significance of this relation. While some studies such as Lundblad (2007) find evidence in favor of a positive relationship, others such as Glosten et al. (1993) point towards a negative one. On the other hand, Bodurtha and Mark (1991) do not find a significant relationship at all. Potential explanations for the controversial findings have been offered in terms of omitted variables biases (see, for example, Scruggs, 1998, or Guo and Whitelaw, 2006), inaccurate measures of expected volatility (see Ghysels et al., 2005) and non-linearities (see Linton and Perron, 2003, or Conrad and Mammen, 2009).
We follow another stream of literature which hints at the possibility that decomposing volatility in its short- and long-term components may resolve the previously ambiguous results. Using an in-mean version of their additive component GARCH model, Engle and Lee (1999) find that long-term volatility has a positive and highly significant effect on expected returns, while the short-term component is insignificant. More recently, Adrian and Rosenberg (2008) and Guo and Neely (2008) show that while the long-run component is positively priced, the short-run component typically has a negative sign. Adrian and Rosenberg (2008, p. 3003) argue that “this finding might explain why previous papers often have difficulty detecting a time-series relationship between risk and expected returns”. That is, the off-setting effects of the long- and short-term component may have masked the underlying relationship.
Given the evidence of Adrian and Rosenberg (2008) and Guo and Neely (2008), we opt for investigating the risk-return relationship at the quarterly frequency. From Eq. (9) we can assume that the conditional variance of quarterly returns is well approximated by N(t)τ
t, thus the effect of the short-term component should be negligible at this frequency.
volatility to be at its unconditional expectation on average, and thus care more about long-term risks. In addition, Guo and Whitelaw (2006) have recently argued that controlling for the effects of innovations to expected returns can substantially increase the efficiency of risk-return regressions. This argument goes back to Campbell and Hentschel (1992), who show that a positive relation between ex-ante expected returns and expected volatility implies a negative relation betweenex-postreturns and volatility shocks, i.e., the volatility-feedback effect. Hence, we estimate risk-return regressions of the form
Rt−Rf,t =c+λ(N(t)τt) +κ(RVt−N(t)τt) +νt, (18)
whereRt =PN
(t)
i=1 ri,tare quarterly returns,N(t)τtis our measure of the conditional market
variance, and RVt−N(t)τt proxies the volatility innovation. Eq. (18) is in the spirit of
French et al. (1987), who estimate an ARMA model for log(RVt) and employ the one-step
predictions RVdt|t−1 instead of N(t)τt. We estimate four versions of Eq. (18). Model I
excludes the volatility innovation. This model corresponds to the ‘standard’
GARCH-in-mean specification. In addition, model II imposes the restriction that c = 0 which
is implied by the Merton (1973) ICAPM. Modell III is an unrestricted specification and model IV restrictscto zero but includes the conditional variance and volatility innovation. Table 9 presents the parameter estimates. First, note that the intercept is insignificant in all but two regressions. Lanne and Saikkonen (2006) have shown that the unnecessary inclusion of an intercept leads to a lack of explanatory power in tests on theλparameter. Hence, we focus our discussion mainly on the regressions which impose the zero restriction on the intercept. Second, the volatility innovations are highly significant in all regressions and improve efficiency considerably as can be seen by comparing models II and IV. The negative sign ofbκ confirms the existence of the volatility-feedback effect.
In the first panel of Table 9, N(t)τ
t is replaced by the one-step-ahead prediction of the
realized volatility based on an AR(1) model for log(RVt). Hence, model III replicates the
estimates in French et al. (1987) for our sample: the estimate of λ is positive, relatively small and insignificant. However, when we constrain the intercept to zero (model IV), λ increases and becomes significant at the 10% level.
Next, we consider the regressions withN(t)τRV
t in Panel 2. Now, even without
includ-ing the volatility innovation (model II), we find that λ is significant at the 10% level. In models III and IV, λ is highly significant and takes reasonable values for the coefficient of relative risk aversion. The striking difference between the results in Panels 1 and 2 is likely to be due to the fact that N(t)τRV
condi-tional variance than RVdt|t−1. While τtRV is based on 12 MIDAS lags, i.e., three years of
realized volatilities, RVdt|t−1 uses the information from the last quarter only. Our results square with the findings in Ghysels et al. (2005) who also show that MIDAS estimates of the conditional variance are superior to simple monthly rolling window estimates of the realized volatility in risk-return regressions. In particular, the MIDAS estimates capture the high degree of volatility persistence which – as was shown in Poterba and Summers (1986) – is a necessary condition for the predicted positive effect of the conditional vari-ance on expected returns. We find that the first order autocorrelation of τRV
t is 0.86,
while the corresponding figure forRVdt|t−1 is 0.57.
Next, we discuss the τt specifications which are based on three exemplary macro
vari-ables. The estimates for τIP
t show that in all four models λ is significant, at least at the
10% level. The estimate of 2.9 in model IV is highly significant and close to the corre-sponding estimate in Panel 2. In addition, the first order autocorrelation of τIP
t is 0.82,
which is almost the same degree of persistence as in τRV
t . A very similar picture emerges
when looking at the estimates based on τU
t and τtN O. In both cases, we obtain highly
sig-nificant estimates of λ in models III and IV. Interestingly, in all model IV specifications the estimates of λ are very close to the estimate of 2.6 reported in Ghysels et al. (2005). Our results not only confirm that there exists a risk-relationship, but also suggest that the MIDAS conditional variance estimator in Ghysels et al. (2005) should be interpreted as a proxy for long-term macroeconomic risk. This interpretation is perfectly in line with Adrian and Rosenberg’s (2008) finding that long-term volatility is primarily related to business cycle risk.
5.2
Long-term risks before the recent financial crisis
As can be seen from Fig. 4, the behavior of realized volatility suggests that the period before the recent financial crisis was characterized by a historically low volatility regime. Hence, risk measures that either focused on short horizons or extrapolated the low volatil-ity regime further into the future naturally failed to anticipate the crisis. As Engle (2009) puts it, “the risk that risk will change” was not thoroughly considered. He argues that this failure may have been avoided by paying more attention to the term structure of risk and, in particular, assessing long-term risks. In the previous sections, we have shown how we can infer information from macro variables to predict the evolution of such long-term risks.


![Table 5: One sided specification - including SPF data Variable m θ ω 2 LLF AIC SPF data since 1969Q1 ∆ real GDP 0.2048 (0.1505) −0.0802 ⋆⋆⋆ (0.0247) 4.0268 ⋆⋆⋆(0.9988) −13197.19[0.0001] 2.6830 ∆ real GDP - SPF 0.2661 ⋆ (0.1416) −0.1207 ⋆⋆⋆ (0.0261) 5.3170](https://thumb-us.123doks.com/thumbv2/123dok_us/742213.2593968/40.892.166.732.157.1076/table-sided-specification-including-spf-data-variable-llf.webp)
![Table 5: One sided specification - including SPF data (continued) Variable m θ ω 2 LLF AIC SPF data since 1981Q3 ∆ real cons.(*) 0.2108 (0.2668) −0.0423 (0.0578) 34.7596 ⋆⋆⋆(9.1445) −9474.63[0.1432] 2.7339 ∆ real cons](https://thumb-us.123doks.com/thumbv2/123dok_us/742213.2593968/41.892.174.720.166.516/table-sided-specification-including-spf-data-continued-variable.webp)