Dissertations, Theses, and Masters Projects Theses, Dissertations, & Master Projects Summer 2017
On The Impact of Internet Naming Evolution: Deployment,
On The Impact of Internet Naming Evolution: Deployment,
Performance, and Security Implications
Performance, and Security Implications
Shuai HaoCollege of William and Mary - Arts & Sciences, [email protected]
Follow this and additional works at: https://scholarworks.wm.edu/etd Part of the Computer Sciences Commons
Recommended Citation Recommended Citation
Hao, Shuai, "On The Impact of Internet Naming Evolution: Deployment, Performance, and Security Implications" (2017). Dissertations, Theses, and Masters Projects. Paper 1530192350.
http://dx.doi.org/10.21220/s2-d0nn-d249
This Dissertation is brought to you for free and open access by the Theses, Dissertations, & Master Projects at W&M ScholarWorks. It has been accepted for inclusion in Dissertations, Theses, and Masters Projects by an authorized administrator of W&M ScholarWorks. For more information, please contact [email protected].
Shuai Hao
Tianjin, China
Master of Science, Beijing University of Posts and Telecommunications, 2010 Master of Science, London South Bank University, 2008
Bachelor of Engineering, North China Electric Power University, 2007
A Dissertation presented to the Graduate Faculty
of The College of William & Mary in Candidacy for the Degree of Doctor of Philosophy
Department of Computer Science
College of William & Mary January 2018
As one of the most critical components of the Internet, the Domain Name System (DNS) provides naming services for Internet users, who rely on DNS to perform the translation between the domain names and network entities before establishing an Internet
connection. In this dissertation, we present our studies on di↵erent aspects of the naming infrastructure in today’s Internet, including DNS itself and the network services based on the naming infrastructure such as Content Delivery Networks (CDNs).
We first characterize the evolution and features of the DNS resolution in web services under the emergence of third-party hosting services and cloud platforms. At the bottom level of the DNS hierarchy, the authoritative DNS servers (ADNSes) maintain the actual mapping records and answer the DNS queries. The increasing use of upstream ADNS services (i.e., third-party ADNS-hosting services) and Infrastructure-as-a-Service (IaaS) clouds facilitates the deployment of web services, and has been fostering the evolution of the deployment of ADNS servers. To shed light on this trend, we conduct a large-scale measurement to investigate the ADNS deployment patterns of modern web services and examine the characteristics of di↵erent deployment styles, such as performance, life-cycle of servers, and availability. Furthermore, we specifically focus on the DNS deployment for subdomains hosted in IaaS clouds.
Then, we examine a pervasive misuse of DNS names and explore a straightforward solution to mitigate the performance penalty in DNS cache. DNS cache plays a critical role in domain name resolution, providing (1) high scalability at Root and
Top-level-domain nameservers with reduced workloads and (2) low response latency to clients when the resource records of the queried domains are cached. However, the pervasive misuses of domain names, e.g., the domain names of “one-time-use” pattern, have negative impact on the e↵ectiveness of DNS caching as the cache has been filled with those entries that are highly unlikely to be retrieved. By leveraging the domain name based features that are explicitly available from a domain name itself, we propose simple policies for improving DNS cache performance and validate their efficacy using real traces.
Finally, we investigate the security implications of a fundamental vulnerability in
DNS-based CDNs. The success of CDNs relies on the mapping system that leverages the dynamically generated DNS records to distribute a client’s request to a proximal server for achieving optimal content delivery. However, the mapping system is vulnerable to malicious hijacks, as it is very difficult to provide pre-computed DNSSEC signatures for dynamically generated records in CDNs. We illustrate that an adversary can deliberately tamper with the resolvers to hijack CDN’s redirection by injecting crafted but legitimate mappings between end-users and edge servers, while remaining undetectable by existing security practices, which can cause serious threats that nullify the benefits o↵ered by CDNs, such as proximal access, load balancing, and DoS protection. We further demonstrate that DNSSEC is ine↵ective to address this problem, even with the newly adopted ECDSA that is capable of achieving live signing for dynamically generated DNS records. We then discuss countermeasures against this redirection hijacking.
Acknowledgments v
List of Tables vi
List of Figures vii
1 Introduction 2
1.1 Measuring and Characterizing the DNS deployment of Modern Web
Services . . . 3
1.2 Exploring Domain Name Based Features on the E↵ectiveness of DNS Caching . . . 4
1.3 End Users Get Maneuvered: Redirection Hijacking in Content Deliv-ery Networks . . . 5
1.4 Roadmap . . . 6
2 Characterizing DNS of Web Services 8 2.1 Background . . . 10
2.1.1 DNS Overview . . . 10
2.1.2 ADNS Deployment Patterns . . . 11
2.2 Datasets and Methodology . . . 14
2.2.1 Datasets . . . 14
2.2.1.1 Authoritative DNS server dataset . . . 14
2.2.1.2 Cloud-hosting subdomain list . . . 16
2.2.3 Validating the ADNS proxy . . . 20 2.3 Measurement Results . . . 22 2.3.1 Overview . . . 22 2.3.1.1 Deployment Patterns . . . 22 2.3.1.2 DNS-hosting Providers . . . 24 2.3.2 Number of Nameservers . . . 25 2.3.3 Time-to-Live Values . . . 27
2.3.4 Life-cycle of ADNS Servers . . . 28
2.3.5 Performance . . . 29 2.3.6 Availability . . . 30 2.4 Cloud-hosting Subdomains . . . 31 2.4.1 Deployment . . . 32 2.4.2 Subdomain Delegation . . . 32 2.4.3 Life-cycle of Servers . . . 33 2.5 Related Work . . . 34 2.6 Summary . . . 35
3 Domain Name Based Features for DNS Caching 36 3.1 Background . . . 37
3.1.1 DNS Caching . . . 37
3.1.2 Domain Name Misuses . . . 37
3.2 Domain Name-Based Features . . . 38
3.3 Measurement Analysis . . . 41
3.3.1 Dataset . . . 41
3.3.2 Feature Validation . . . 42
3.3.2.1 F1: Length of Query Name . . . 43
3.3.2.3 F3: Number of Format Fields . . . 44
3.3.2.4 F4: Total number of L-FF and S-FF . . . 44
3.3.3 The Classifier . . . 44 3.4 Trace-Driven Simulation . . . 46 3.4.1 Implementation . . . 47 3.4.2 Results . . . 48 3.4.2.1 FIFO . . . 49 3.4.2.2 Pseudo-LRU . . . 49 3.4.3 Discussion . . . 49 3.5 Related Work . . . 50 3.6 Summary . . . 51 4 Redirection Hijacking in CDNs 54 4.1 Background . . . 56
4.1.1 DNS Cache Poisoning Attack . . . 56
4.1.2 DNSSEC . . . 57
4.1.3 Content Delivery Network . . . 58
4.1.3.1 DNS-based Mapping System . . . 58
4.1.3.2 Anycast Routing . . . 60
4.2 Threat Model . . . 60
4.2.1 Attacker Model . . . 60
4.2.2 Redirection Hijacking Attack . . . 61
4.3 Attack Assessment . . . 63
4.3.1 Methodology . . . 63
4.3.2 Characterization Overview . . . 64
4.3.3 Threat Analysis . . . 67
4.3.3.2 TTL . . . 73
4.3.3.3 Performance Impact . . . 74
4.3.3.4 Scope of Impact . . . 77
4.3.3.5 Domain Sharding . . . 78
4.3.3.6 Impact of CDN Caching . . . 78
4.3.4 More Serious Threats . . . 79
4.4 Countermeasures . . . 81
4.4.1 ECS Considerations . . . 81
4.4.2 DNSSEC Considerations . . . 82
4.4.3 CNAME Flattening . . . 83
4.4.4 Request Re-Mapping . . . 85
4.4.5 DNS Encryption and Transport-layer DNS . . . 85
4.5 Related Work . . . 86
4.6 Summary . . . 88
5 Conclusions and Future Work 90 5.1 Thesis Summary and Contributions . . . 90
5.2 Future Work . . . 92
I would first like to sincerely thank my advisor, Professor Haining Wang, for his guidance and support throughout my Ph.D. study. I feel very fortunate to work with Dr. Wang and his interests and enthusiasm in pursuing wonderful research continue to impact and inspire me for my future career.
I would like to thank my dissertation committee members, Prof. Evgenia Smirni, Prof. Gang Zhou, Prof. Kun Sun, and Prof. Chase Cotton, for their collective time and valuable insight.
All members of our research group team, Xing Gao, Dachuan Liu, Daiping Liu, Ji-dong Xiao, Haitao Xu, Zhang Xu, and Yubao Zhang, are making my Ph.D. journey a wonderful academic experience for exploring various ideas as well as an enjoyable, varied life for a lot of fun .
I would also like to thank Mr. Qunyang Lin and Dr. Junqing Xie at HP Labs China, and Dr. Junghwan Rhee and Dr. Chung Hwan Kim at NEC Laboratories America for o↵ering me the research internships during my Ph.D. study.
Finally, I greatly thank my parents for their concern and support throughout my life. Also, I thank my sister for always believing in me. It’s the best thing in my life relishing the moments of your growing up.
2.1 ADNS Deployment of Top 15 Sites3 . . . 13
2.2 Summary of Deployment Patterns . . . 23
2.3 Top 10 sites for each deployment pattern . . . 23
2.4 Top DNS-hosting Domains . . . 25
2.5 Summary of ADNS changes (%) . . . 29
2.6 Summary of Availability (%) . . . 31
2.7 Summary of Deployment patterns for cloud subdomains (%) . . . 33
2.8 Summary of DNS changes for cloud subdomains (%) . . . 34
3.1 Summary of datasets . . . 42
3.2 Percentage of mis-classified instances . . . 46
3.3 Summary of RR Types . . . 47
4.1 Characterization of CDNs’ Request Routing and DNSSEC Provision. The“ ”indicates that adversaries may be able to manipulate the end-user redirection that results in more serious damage. The“#”indicates that the record su↵ers from limited form of dynamic vulnerability that may not cause serious threats such as service interruption. . . 65
4.2 Impact of a single record hijacking (CDNs with global anycast that are invulnerable to the redirection hijacking have been excluded.) . . . 79
2.1 DNS Resolution Process (Iterative query). . . 11
2.2 ADNS Deployment for Web Services. . . 12
2.3 DNS Proxy. . . 14
2.4 DNS Deployment for (Partly) Cloud-hosting Subdomains. . . 15
2.5 CDF for the number of domains supported by individual DNS server under matching occurrence (Note that the Y axis starts from 0.6). . . 18
2.6 CDF for the di↵erence of responses byping and dig. . . 21
2.7 CDF for served domains of DNS-hosting domains. . . 24
2.8 CDF for the number of ADNS servers. . . 26
2.9 CDFs for the number of ADNS servers of top sites (private and up-stream). . . 26
2.10 CDF for the number of private and upstream servers in hybrid de-ployment. . . 27
2.11 CDFs for TTL values. . . 28
2.12 CDF for Response Times of DNS Queries. . . 30
2.13 CDF for the number of ADNS servers. . . 33
3.1 Sample of domains with the domain name-based features . . . 38
3.2 Example of distribution for lengths and depths . . . 41
3.3 Distribution of domain name-based features for Reused and Un-reused domains . . . 52
3.4 Training Results (with Decision Tree). . . 53
entries read into the resolver. . . 53
4.1 Illustration of a Redirection Hijacking Attack . . . 62
4.2 Vantage Points for Resolution . . . 64
4.3 An Example of DNS-based End-User Redirection by CNAME (Akamai) 68 4.4 Illustration of Redirection Hijacking with Regional Anycast . . . 70
4.5 TTL . . . 73
4.6 CDF for the Round-Trip Time . . . 75
4.7 CDF for the TTFB . . . 76
4.8 CDF for the Download Speed . . . 77
Chapter 1
Introduction
Accessing Internet services relies on the naming infrastructure, i.e., the Domain Name System (DNS), for translating human-readable domain names to routable network ad-dresses. DNS is designed as a globally distributed database system, where the Root and Top-Level-Domain (TLD) nameservers are mainly used as the querying referrals, and the authoritative DNS servers (ADNSes) are responsible for storing the name-to-address records and returning answers to clients. Meanwhile, the acquired mapping results are cached by local DNS servers (LDNSes) to answer the following queries in a specific dura-tion. The first two studies presented in this dissertation involve with DNS itself. In the first work, we present a large-scale measurement study to understand the DNS deployment for web services. Then, in the second work, we explore the simple policies to improve the e↵ectiveness of DNS caching by considering the prevalent non-malicious misuse of domain names on the Internet.
Many Internet services have relied on DNS to achieve their enhanced functionalities. The most common example is the Content Delivery Networks (CDNs). CDNs play an important role in the Internet ecosystem by delivering a large fraction of the Internet content to end users with high availability, performance, and scalability. Typically, CDNs place a large number of edge servers at geographically distributed edge networks, enabling content caching and proximal access for end-users. The user requests for the content
hosted by CDNs are served at the “edge” via request redirection to improve user-perceived performance and balance the load across server clusters. Moreover, CDNs are able to provide a security portal of protection mechanism against distributed denial-of-service (DDoS) attacks by redirecting users from overwhelmed nodes [29, 123]. The third study in this dissertation aims to investigate a fundamental vulnerability that could be exploited by adversaries in a very stealthy manner to manipulate the access of end-users for CDNs and nullify the benefits o↵ered by CDN vendors. We characterize popular CDN venders on the vulnerability and discuss countermeasures against such a security threat.
In sub-sections 1.1 - 1.3, we briefly introduce the motivation and problem statement of each study. In sub-section 1.4, we describe the organization of this dissertation.
1.1
Measuring and Characterizing the DNS deployment of
Modern Web Services
Deploying authoritative nameservers requires extra hardware resources and additional maintenance support. Also, the critical roles of DNS services in web infrastructures make DNS an attractive target to attackers. Thus, web service providers are increasingly adopt-ing the upstream authoritative DNS servers, includadopt-ing the top sites (e.g., Amazon and Twitter) that have the ability to maintain their own ADNS infrastructures. In addition, to save a large amount of investments for computing infrastructures, many popular web services are directly built upon Infrastructure-as-a-Service (IaaS) clouds such as Amazon EC2 and Windows Azure. The traditional web service providers are also migrating ex-tended services into clouds to use the “illusively infinite” computing and storage resources. The IaaS infrastructure greatly facilitates the establishment of modern web services and also promotes the process of delegating the authoritative name resolution to third-party ADNS service providers. Besides traditional web-hosting providers such as Dyn [16] and Ultradns [35], the CDN and cloud service providers also o↵er the ADNS services that integrate the name resolution into their CDNs or cloud infrastructures [1, 5].
The existing DNS measurements focus on the characteristics of DNS activities and operations [50, 34, 61, 26, 65] at the root or top-level-domain servers [48, 51, 88, 90, 126], as well as the DNS resolvers [19, 36, 107]. Some works involving with the characteristics of ADNSes mainly center on the comparison with local DNS (LDNS) servers, but none of them explore various ADNS deployments for web services. Complementary to these prior works, we present a large-scale measurement study in attempt to answer the following questions: (1) how do modern web services deploy their ADNS servers? (2) what are the characteristics of di↵erent ADNS deployment patterns? and (3) in particular, how do the cloud-hosting subdomains administer their ADNS servers?
1.2
Exploring Domain Name Based Features on the E
↵
ec-tiveness of DNS Caching
Since DNS is a globally distributed database system, caching has been widely adopted in DNS infrastructures, where the acquired mapping results (i.e., DNS resource records, RRs) will be cached locally to answer the following queries in a specific duration. DNS cache significantly reduces the resolution traffic along referral chains to interact with multiple name servers, resulting in much shortened client-perceived delay and high scalability of DNS.
Due to its fundamental role for accessing Internet services, DNS traffic is the least blocked [103], and provides both attackers and developers with an attractive channel to transmit information. Thus, the misuse of domain names (either malicious or non-malicious) is widely observed on the Internet. On the other hand, since the cached objects in DNS resolvers are typically small, in some instances the caches are not size limited [79] and the memory usage is relatively stable as the expired entries are being evicted. However, when serving a large group of users with heavy workload (e.g., in ISP or CDN/cloud providers), although modern DNS resolvers manage the memory well, the cache will still quickly consume the memory bytes and go into swap. Meanwhile, this may also cause
performance problems on CPU if cleaning-interval is enabled to check the stale records periodically. To this e↵ect, a fixed memory allocation is a common configuration [54] and the typical replacement policies (e.g., LRU and LFU) are employed to manage the cache usage [56, 64]. Therefore, it is critical to ensure that the cached RRs would be quite likely to be accessed again. Unfortunately, the pervasiveness of misused domains, e.g.,disposable domains [54], has caused the ine↵ectiveness of caching on resolvers since the cache is filled up by the records with very low or almost zero cache hit rates.
In this work, we attempt to mitigate the negative e↵ect on DNS caching caused by the domain name misuses, especially the “one-time-use” domains. Di↵erent from previous approaches, we do not pursue an accurate detection of domain misuses by employing the deep inspection techniques such as behavioral features [47], alphanumeric characters-based metric [106], or entropy-characters-based computing [103]. Instead, our key insight is that most misused domains, either malicious or benign, tend to transmit information over DNS query names. Thus, the domain name itself may have distinct features that are explicitly available from individual queries and can be readily exploited for improving DNS cache performance. By extracting the re-used and once-used RRs from our trace logs captured at the campus networks of two universities, we propose and validate the explicit domain name-based features that could be used to improve the e↵ectiveness of DNS caches by proactively eliminating the domains that are highly unlikely to be reused in future’s queries.
1.3
End Users Get Maneuvered: Redirection Hijacking in
Content Delivery Networks
CDNs place a large number of edge servers (also called surrogates) at geographically distributed edge networks, enabling content caching and proximal access for end-users. Thus, how to redirection or route client requests among edge server clusters is a central function of CDNs and its design choice is critical to CDNs. The majority of today’s
CDNs leverage the Domain Name System (DNS) as the core of their mapping systems to redirect a client’s request into a nearby edge server. Since a DNS-based mapping system is based on real-time measurements of server and network conditions, it can provide fast, accurate, and fine-grained control for request redirection. Thus, its usage has been dominant in leading CDN vendors for operating a large number of edge servers, such as Akamai. However, such a DNS-based mapping system requires DNS records to be very dynamic, which restrains those DNS-based CDNs from authenticating their mapping DNS records by using DNSSEC signatures. This is because DNSSEC was originally designed for static records. Due to its prohibitively high computational overhead, traditional RSA-based DNSSEC is not a feasible solution to secure dynamic DNS records in the context of CDNs.
In this study, we investigate the security implication in the DNS-based mapping sys-tem of CDNs, which can be exploited by adversaries to hijack the operation of request redirection in a very stealthy manner and then nullify the benefits provided by CDNs, such as proximal access to nearby edge servers, geographically load-balancing, and DoS pro-tection. To perform the redirection hijacking, the adversaries deliberately maneuver the mapping between end-users and edge servers by injecting fraudulent DNS records. Wor-risomely, even the newly adopted Elliptic Curve Digital Signature Algorithm (ECDSA) that is capable of providing real-time DNSSEC signatures is ine↵ective to detect and pre-vent malicious DNS record injection. We reveal that an adversary can utilize a legitimate mapping record to override CDN’s cluster/server selection and redirect a certain group of users to an edge server chosen by the adversary.
1.4
Roadmap
The remainder of this dissertation is structured as follows. In Chapter 2, we present a large-scale measurement study to profile the characterizations of authoritative DNS (ADNS) servers for modern web services and cloud-hosting subdomains. In Chapter 3, we
propose the domain name based features that are explicitly available from domain name itself to mitigate the performance penalty caused by the prevalent usage of “disposable domains” (i.e., one-time-used names) on the Internet by prematurely excluding the do-mains that are highly unlikely to be used from DNS cache. In Chapter 4, we investigate a fundamental vulnerability of CDNs, called redirection hijacking, which stems from the dynamic characteristics of DNS records used for the CDN’s request routing, and could be exploited by adversaries for degrading CDN’s performance and nullifying the benefits pro-vided by CDN’s such as load balancing and DoS protections. We summarize the studies in this dissertation and discuss future work in Chapter 5.
Chapter 2
Measuring and Characterizing the
DNS Deployment of Modern Web
Services
As a hierarchical distributed database system, the Domain Name System (DNS) is one of the most important components of Internet infrastructure, providing the mapping be-tween the domain names and network-level addresses to direct clients to specific Internet services. In DNS hierarchy, the authoritative DNS (ADNS) servers are administered by the service providers and responsible for storing the name-to-address records and return-ing answers to the clients. Due to the requirements of extra hardware resources and additional maintenance support, the web service providers are increasingly adopting the upstream authoritative DNS servers. Also, many of today’s popular web services are built upon Infrastructure-as-a-Service (IaaS) clouds. In this study, we explore state-of-the-art of the patterns of ADNS deployment and perform a large-scale measurement study to demonstrate the characteristics of di↵erent patterns.
In doing so, we first collect the authoritative DNS server information for top-ranking websites on Alexa’s list [3] and eliminate the redundant domain records. This constructs our dataset with about 2.3 million nameservers for about 0.94 million websites. We then
develop a systematic method to explore ADNS server deployment patterns and perform the geo-distributed probing experiments. In particular, by directly issuing DNS queries to each ADNS server, we examine their deployment details and characteristics. Next, we focus on the DNS deployment of web services whose subdomains are hosted in cloud infrastructure. We extract the subdomain list from an existing dataset [8], reproduce the ADNS servers of subdomains for comparing with the original results, and examine their deployment.
We summarize our major findings and contributions as follows:
• We use a simple heuristic method to determine the ADNS deployment patterns. In fact, it is fairly easy to recognize the pattern for an individual website from its NS records, but it is much more difficult when looking for millions of websites in such a large-scale study.
• We validate the use of ADNS proxy infrastructure by examining the transition delay and the TTL aging.
• We first quantify the usage and profile the characteristics of ADNS servers in terms of the deployment patterns.
• We find that most top-ranked websites deploy their own DNS servers but emerging popular social sites tend to use the upstream DNS-hosting services. We also observe few servers being used in private deployment.
• We find that the ADNS deployment patterns remain stable. The change of private servers is more frequent than that of upstream servers. The websites using upstream services change frequently their hosting domains but have the lowest frequency to change their deployment patterns.
• Among the studied patterns (i.e., private, upstream, and hybrid), we observe that upstream achieves the highest performance while hybrid has the highest availability.
• We quantify the usage of ADNSes for cloud-hosting subdomains. We observe a noticeable growth on the usage of cloud-providing DNS service.
The remainder of this chapter is organized as follows. We introduce the background of DNS and ADNS deployment in §2.1. We describe the data sets used in the study and our analysis methods in §2.2. We present the measurement results and analysis of ADNS deployment for top-ranking websites in §2.3. We profile the usage of ADNSes for cloud-hosting subdomains in §2.4. We survey related work in §2.5, and finally conclude the chapter in §2.6.
2.1
Background
In this section, we give an overview of DNS and present the authoritative DNS deployment patterns for modern web services. In addition, we specially discuss the DNS deployment of cloud-hosting subdomains.
2.1.1 DNS Overview
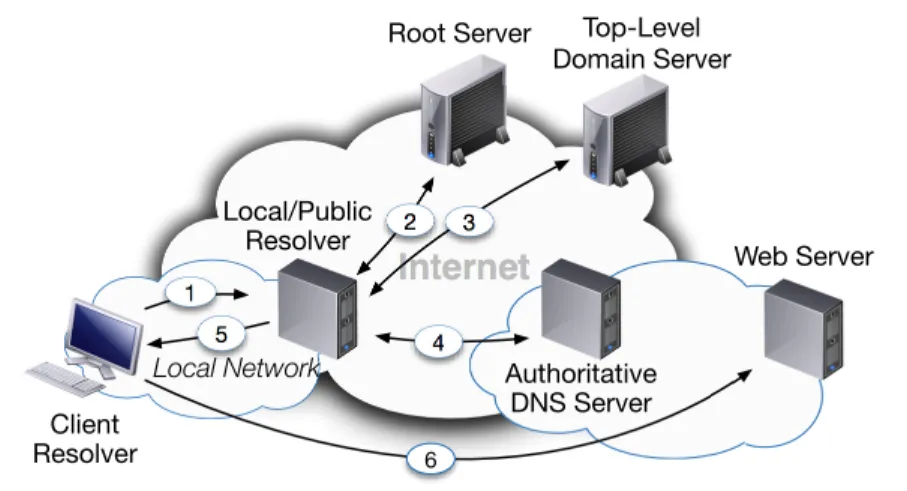
Figure 2.1 shows the DNS components and the process of name resolution. A resolution routine on the client-end host, called stub resolver, issues a DNS lookup to a recursive resolver, a local DNS server (LDNS) deployed by the client’s local network or a public DNS service [21, 28] located in a wide area network. Without considering the cache e↵ects on the resolvers and intermediate servers, the recursive resolver will first contact the root server. The root server directs the resolver to query a top-level-domain (TLD) server (e.g., the .com TLD server). Similarly, the TLD server responds the resolver’s query with the address of theauthoritative DNS server (ADNS) for the corresponding domain. Next, the local recursive resolver queries the ADNS server for the address of the domain host, and finally the client can reach the Internet service as the recursive resolver returns the answer for name resolution.
Internet
1 2 3 4 5 6 Local Network Local/Public Resolver Client ResolverRoot Server Top-Level
Domain Server
Authoritative DNS Server
Web Server
Figure 2.1: DNS Resolution Process (Iterative query).
2.1.2 ADNS Deployment Patterns
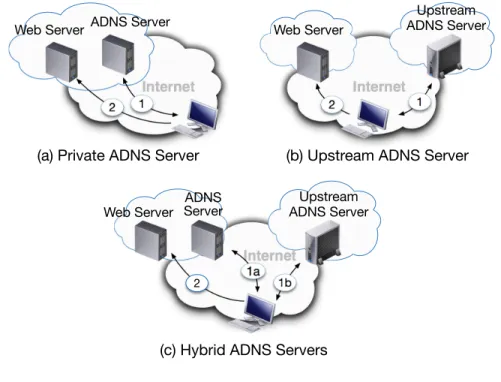
Figure 2.2 illustrates the steps of a client accessing the web services under three di↵erent ADNS deployments:
• Private ADNS server: The web service owners deploy their private authoritative DNS servers only within their own domains.1
• Upstream ADNS server: The web service owners delegate their authoritative name resolution to the upstream DNS-hosting service providers.2
• Hybrid ADNS deployment: The web service owners employ both the private
DNS servers and the upstream ADNS servers for their authoritative name resolution.
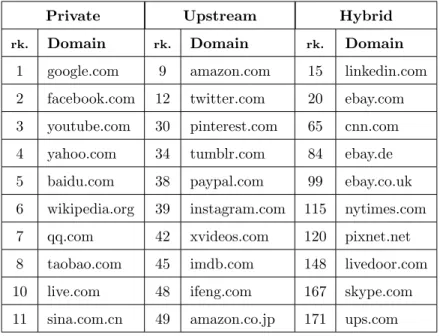
Table 2.1 lists the domains hosting authoritative DNS servers for the top 15 websites on Alexa’s list [3]. Most of these top websites host the ADNS servers within their own domains
1The domains hosting web services and private nameservers may also be located inside IaaS clouds. In such a case, the service provider runs the ADNS servers with cloud instances.
2We only consider the ADNS-hosting domains to identify the deployment, regardless of whether a website itself is hosted in private infrastructure or web-hosting companies.
3The ranking is from April 2015.
4The TLDs of Ultradns serving for amazon.com include .net, .org, .info, and .co.uk. Although Amazon o↵ers a public DNS-hosting service (Route 53 [5]) for its cloud tenants, it delegates its DNS resolution to upstream providers. We infer that it is a historical reason: Amazon has been running the upstream ADNS foramazon.comsince its establishment in 1995 and did not switch to private servers when expanding its business to cloud services.
Internet Internet Internet 1 2 2 1 1a 1b 2
Web Server ADNS Server
(a) Private ADNS Server
Web Server
Upstream ADNS Server
(b) Upstream ADNS Server
Web Server ServerADNS ADNS ServerUpstream
(c) Hybrid ADNS Servers
Figure 2.2: ADNS Deployment for Web Services.
since they are capable of maintaining a secure and reliable DNS infrastructure. However, amazon.comandtwitter.comdelegate their name resolution services to upstream ADNS providers, for which amazon.com uses two di↵erent vendors. Linkedin.com hosts ADNS servers in both its own domain and the upstream provider. Note that many top websites enable their primary ADNS servers to resolve the names for other domains they possess, such as Google foryoutube.com, Microsoft for live.com, and Sina for weibo.com.
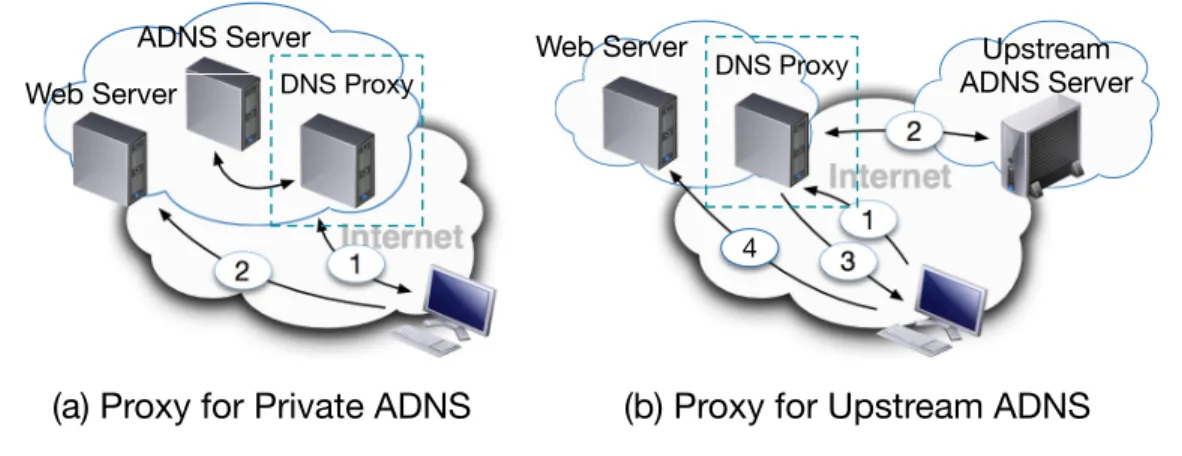
Use of DNS Proxy. To validate DNS traffic and protect the ADNS servers, the ser-vice owners may deploy the DNS proxy servers to control incoming5 DNS queries and enable flexible management. Figure 2.3 shows the DNS proxy deployment for private and upstream ADNS servers. In both scenarios, the clients first contact the DNS proxy servers, and then the proxy servers transparently relay the queries to ADNS servers and
5The DNS proxy can also be used to control the outgoing DNS traffic in local networks. In addition, a specified re-routing service, calledSmart DNS proxy, directs the users to access region-restricted or blocked content. In our study, we only consider the DNS proxy that serves for incoming connections of ADNS servers.
Table 2.1: ADNS Deployment of Top 15 Sites3 Domain ADNS google.com google.com facebook.com facebook.com youtube.com google.com yahoo.com yahoo.com baidu.com baidu.com wikipedia.org wikimedia.org
amazon.com dynect.net, ultradns4
twitter.com dynect.net taobao.com taobao.com qq.com qq.com google.co.in google.com live.com msft.net sina.com.cn sina.com.cn
linkedin.com dynect.net, linkedin.com
weibo.com sina.com.cn
return the answers back to clients. To date the DNS proxy servers have been developed as functionality-rich systems, such as Global Traffic Manager (GTM) [20] or Global Server Load Balancing (GSLB) [27], to optimize access performance and secure DNS servers. All these environments are recognized as the DNS proxy infrastructure in our study.
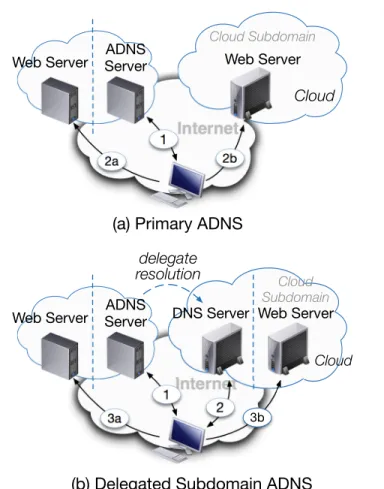
DNS for Cloud-hosting Subdomains. Figure 2.4 shows the steps for accessing the (partly) cloud-hosting subdomains. These subdomains are the partial sections of primary websites, hosted inside a cloud for achieving scalable infrastructure and providing extended services. The primary ADNS servers, deployed by either private servers or upstream services, could be used to direct users to the cloud subdomain, as shown in Figure 4(a). Also, some providers delegate the name resolution for cloud subdomains to a dedicated subdomain DNS server, as shown in Figure 4(b). The delegated DNS server could be deployed by (1) DNS software running within cloud instances, (2) DNS resolution service
Internet Internet 1 2 1 2 3 4 DNS Proxy DNS Proxy Web Server ADNS Server
(a) Proxy for Private ADNS
Web Server Upstream
ADNS Server
(b) Proxy for Upstream ADNS Figure 2.3: DNS Proxy.
o↵ered by the cloud provider, or (3) the third-party upstream services. We examine the DNS deployment details for such cloud-hosting subdomains in §5.
2.2
Datasets and Methodology
This section introduces the datasets used in the study and presents our approaches to examine the deployment patterns of ADNS servers.
2.2.1 Datasets
Alexa’s list [3] of the top 1-million websites is updated daily and based on the one-month average traffic. The list used in our study was downloaded in June 2014.
2.2.1.1 Authoritative DNS server dataset
We collected the authoritative DNS server information for the top 1-million websites on Alexa’s list through dig utility. Since the personal pages from several popular web services are individually included in Alexa’s list and their hosting domains have been ranked, we eliminated those page links from our data with (1) a slash “/” after do-main names, which typically indicates the sub-webpages, such as YouTube’s user home pagesyoutube.com/[user], and (2) the domains having the lower-level names before the
Internet Internet 1 2a 2b 1 3a 2 3b
Web Server ServerADNS
Cloud Subdomain Web Server
Cloud
(a) Primary ADNS
Web Server ServerADNS
delegate resolution DNS Server Cloud Subdomain Web Server Cloud
(b) Delegated Subdomain ADNS
Figure 2.4: DNS Deployment for (Partly) Cloud-hosting Subdomains.
second-level names6, such as Blogspot’s personal blog pages [user].blogspot.com.
Fi-nally, we collected the authoritative DNS information for 942,467 websites with 2,339,345 domain servers, consisting of 352,022 distinct nameservers.
Upon the dataset, we study the characteristics, such as performance and availability, of di↵erent ADNS deployment patterns by probing the collected servers. To eliminate the cache e↵ect at intermediate servers, we issue the DNS queries to designated ADNS servers by using the @global-serveroption of digutility.
6They are identified by publicsuffix[32], a parser implemented by recognizing the domain suffixes from the Public Suffix List [31].
2.2.1.2 Cloud-hosting subdomain list
The list of cloud-hosting subdomains is extracted from a prior dataset [8], which includes the subdomains associated with Alexa’s list and hosted in Amazon EC2 and Windows Azure. We reproduced the DNS server list since we found that a large number of DNS records have been changed. We also found many subdomains had been migrated to other cloud providers, but their DNS information could still be used for our study.
2.2.2 Determining ADNS Deployment Patterns
We first construct the list of authoritative DNS servers of each web domain by extracting NS records from the responses of dig probes, and then attempt to determine the ADNS deployment pattern. However, without a complete list of global upstream DNS providers to identify all DNS-hosting domains, it is impossible to have an automated method to accurately determine the pattern for every site. To ensure our study’s e↵ectiveness and accuracy, we design a heuristic method to capture as many websites as possible for each pattern by discarding the records likely to be miscategorized:
Step 1: First we extract the second-level name from each domain (e.g., google from google.com), and perform a substring search for that name in its every name-server’s hostname. Here we exclude the domains with one or two characters of second-level names since they may coincidently match the hostnames (e.g., the second-level name “t” from t.co matches the servers at dynect.net). We then move these domains into a short-namelist to be determined later (Step 5).
Step 2: For each domain, we assign two variables, tm and tn, to record the number of
matching and non-matching occurrences, respectively.
• If a certain server contributes tm, we consider that it serves as a private
nameserver located in the same or related domain with its web service. We collect those servers in aprivate list.
• For the servers without matching occurrence, we put them to anupstream list.
• For a domain with tm >0 and tn= 0, we consider all its ADNS servers to
be located in a related domain hosting its web service, and thus we refer to the domain as the private ADNS deployment.
For example, four nameserversns[1-4].google.comserve forgoogle.com. The second-level name google matches for all nameservers, which gives tm = 4 and tn = 0. Also,
upon the general naming customs, this matching process has been able to recognize many domains that deploy private ADNS servers in separated and dedicated domains (e.g., ebay.comdeploys its DNS servers in ebaydns.com).
However, some separated DNS-hosting domains cannot be identified from the sim-ple substring search in this step (e.g., as shown in Table 1, the nameservers hosted in sina.com.cnserve forweibo.com).
Step 3: Our basic idea, to recognize such deployment, is to determine the deployment patterns of websites by the categories of their nameservers. Therefore, we would filter the private and upstreamlist (in this and the next step, respectively) to exclude the nameservers that might be miscategorized.
Despite the successful matching in step 1, the private list still includes some servers used as upstream services. For example, the nameserverns1.dnsmadeeasy.com matches the domaindnsmadeeasy.com, and thus is recognized as a private DNS server. However, it also serves as an ADNS-hosting server for thousands of other websites.7 Since the nameservers will be used to determine deployment patterns, we would eliminate such records from theprivate list.
In doing so, we first extract the domain part of each ADNS server by using the publicsuffix [32] parser (e.g., getting the domain partbbc.co.uk from the nameserver
7In our study, the pattern of servers is determined by their specific role for an individual website. That is, in this example,ns1.dnsmadeeasy.comis a private DNS server fordnsmadeeasy.com, but an upstream server for other domains using its DNS-hosting service.
0.6 0.7 0.8 0.9 1 1 20 100 1000 10000
CDF
Number of served domains
CDF
Figure 2.5: CDF for the number of domains supported by individual DNS server under matching occurrence (Note that the Y axis starts from 0.6).
ns1.tcams.bbc.co.uk). We then calculate the number of domains that each extracted domain part serves for, except for the domains with matching occurrences. For exam-ple, the ADNS servers in ebaydns.com support 64 domains in the dataset, 49 of which match the hostnames of servers (i.e., the second-level name ebay matches the domain ebaydns.com). This indicates the ADNS servers in ebaydns.com serve for 15 domains without matching occurrences. On the other hand, we find 8,487 domains supported by the servers located insidednsmadeeasy.com.
The heuristic to filter the private list is from a general observation: the number of domains served by private DNS servers would be less than the number of domains supported by the third-party upstream servers. Since what we want is to have a private server list with accurate classification, simply discarding the servers with a certain number of served domains will be enough for our study.
Figure 2.5 demonstrates the cumulative distribution for the number of domains served by nameservers withmatching occurrences. Not surprisingly, most of servers only support a few domains: about 96.7% of DNS-hosting domains serve for fewer than 20 web domains. We believe that it is safe to discard the servers administrating more than 20 domains in the private list, since (1) the matching process has excluded the majority of upstream
servers, (2) most upstream service providers should have more than 20 served websites in such a large-scale dataset, and (3) while several errors exist, they would not have a significant e↵ect on our study because the number of miscategorized websites is marginal (<20⇥the number of errors).
To inspect the accuracy of our heuristic method, we extract and examine the results for the top 100 most popular websites. We find that the nameservers from three private domains (google.com,facebook.com, andmsft.net) are removed from theprivatelist since they serve for more than 20 domains. We argue that it also does not a↵ect our study because (1) the ADNS deployment patterns of their primary websites have been identified as private due to the matching occurrence in step 2, and (2) only a small portion of the domains served by these private nameservers in the three domains above are discarded but most of them have the same ADNS deployment as their primary sites.8
According to the filteredprivatelist, if any server in theupstreamlist also appears in theprivate list, we consider that it is deployed as a private server for the corresponding domain. We then move this server into theprivate list.
Step 4: We extract all domain parts from the servers in the upstream list and calculate how many websites those DNS-hosting domains support. For similar considera-tions with step 3, we discard the servers with fewer than 20 administrated domains since they could be private servers. We also will not move them to the private list because without any matching occurrence, we cannot ensure that they are private servers.
Step 5: We then updatetmandtnfor each unidentified domain (i.e., a domain not labeled
in step 2 and in theshort-name list) by examining its nameservers:
• if one nameserver appears in theprivate list, increase tm by one;
• if one nameserver appears in theupstream list, increasetn by one.
We finally determine the ADNS pattern as follows:
• tm>0 andtn= 0: private ADNS
• tm= 0 and tn>0: upstream ADNS
• tm>0 andtn>0: hybrid ADNS
As an example, we find six nameservers for hao123.com, a website-directory service provided bybaidu.com. One nameserver is located in hao123.comand the other five are inbaidu.com. Thereby, the matching step gives tm = 1 andtn = 5. In addition, the five
nameservers hosted in baidu.com appear in the private list since they are also serving baidu.com. Finally, we have tm = 6 and tn= 0, and refer to this site as a private ADNS
deployment.
We eliminate the domains whose nameservers cannot be identified by the private or upstream lists. Finally, we discard 19,956 (2.1%) records from the original dataset, of which 922,489 websites remain to be studied in our measurement. We understand our heuristics, filtering-based method may still not be perfect, but we believe that the method’s accuracy is high enough for performing a large-scale measurement, with few errors at an acceptable level.
2.2.3 Validating the ADNS proxy
The use of the DNS proxy conceals the ADNS infrastructure and the proxy discovery is a challenging problem since the DNS proxy exhibits the same behavior as a private ADNS server from the viewpoint of external clients. We perform two di↵erent probing tests to study the proxy infrastructure.
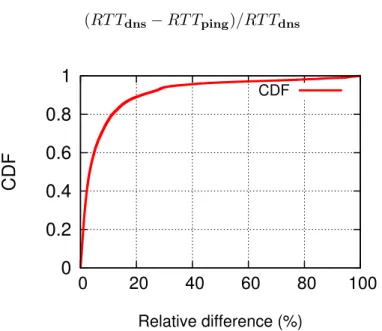
We first discover the usage of a proxy by roughly estimating the DNS response latency within authoritative resolving infrastructure: if a DNS query undergoes a distinctly longer response delay than aping probe, the website has a very high probability of using a proxy. We probe 138,240 private servers for 70,502 domains from three vantage points (at eastern-, middle-eastern-, and western-US)eastern-, and we observe that 73% of servers respond to theping probes.
Then, for each of those servers, we attempt to identify and normalize the time di↵erence in response latency between ping probes and DNS queries. The normalized di↵erence in response latency (i.e., round-trip-time, RTT) between DNS and ping is computed as below: (RT Tdns RT Tping)/RT Tdns
0
0.2
0.4
0.6
0.8
1
0 20 40 60 80 100CDF
Relative difference (%) CDFFigure 2.6: CDF for the di↵erence of responses byping anddig.
We measure the normalized di↵erence values in three vantage points and define their average as the relative di↵erence for each server. Figure 2.6 plots the distribution of relative di↵erence. We observe that (1) the majority of servers (close 90%) whose relative di↵erence values are less than 20%, but (2) indeed there are 3.4% and 1.8% of servers whose relative di↵erence values are higher than 50% and 80%, respectively, i.e., their DNS queries have response times 50% and 80% higher than the RTTs ofping probes. Assuming the same or at least similar routing paths for consecutive ping probes and DNS queries, even if we cannot accurately identify the proxy for each website, our probing results clearly indicate that the use of ADNS proxy infrastructure does exist but the usage is very limited. If a proxy enables the cache, we cannot use the relative di↵erence to detect the use of a DNS proxy anymore, since the cache will respond to the queries and no significant additional delay would be noticed. However, di↵erent from an ADNS direct response, in
which TTL is a fixed default value, the TTL value of a proxy cached record decreases with time elapse. This is because the cache at a DNS proxy will age the cached records like a local resolver. That is, the answers from a proxy will have reduced TTLs. Moreover, the time resolution in TTL is in seconds. Therefore, we send two successive queries with an interval of 10 seconds to these ADNS addresses and then use the reduced TTL values to detect the existence of a DNS proxy. In other words, if we can detect that the di↵erence of TTLs between two successive DNS queries is round 10s, a proxy infrastructure may have been adopted to conceal the actual ADNS servers. However, by probing 70,520 domains with private deployment, we only find 75 (0.001%) domains where TTL-reduced records from their ADNS servers occur. This observation is consistent with the proxy detection result above, i.e., the ADNS proxy infrastructure is not used by most service owners. Furthermore, comparing the two results (3.4% vs 0.001%), we can see that most ADNS proxy servers simply relay the authoritative records to clients and no cache is used.
2.3
Measurement Results
This section presents the measurement results and analysis for the websites on Alexa’s list. First we quantify the usage of deployment patterns and examine the fundamental deployment configurations, such as the number of servers and TTLs of DNS records. Then we present the performance study based on the probes from the geo-distributed locations and analyze the availability for di↵erent patterns.
2.3.1 Overview
2.3.1.1 Deployment Patterns
Table 2.2 summarizes the pattern recognition in our dataset, based on the breakdown by the top 100, 1,000, 10,000, and all records. The majority of websites delegate their authoritative name resolution to upstream DNS-hosting services for the simple manage-ment. The high-ranking sites are much more likely to deploy their own ADNS servers:
the fraction of private deployment decreases sharply as the number of studied domains in-creases. In addition, the percentage of hybrid-deploying domains remains stable on about 4-6% within top 10,000 websites but overall only 1.4% of websites are recognized as such a deployment. Table 2.3 lists the top 10 web domains of each deployment pattern. Many emerging top websites, especially the social sites popular on mobile web, such as Twitter, Pinterest, and Tumblr, use the upstream services to facilitate the quick and convenient deployment.
Table 2.2: Summary of Deployment Patterns
Patterns Top 100 Top 1k Top 10k All
% % % # %
Private 68 34.1 18.76 70,520 7.6
Upstream 27 60.2 77.17 838,605 91.0
Hybrid 5 5.7 4.07 13,364 1.4
Total 100 100 100 922,489 100
Table 2.3: Top 10 sites for each deployment pattern
Private Upstream Hybrid
rk. Domain rk. Domain rk. Domain
1 google.com 9 amazon.com 15 linkedin.com
2 facebook.com 12 twitter.com 20 ebay.com
3 youtube.com 30 pinterest.com 65 cnn.com
4 yahoo.com 34 tumblr.com 84 ebay.de
5 baidu.com 38 paypal.com 99 ebay.co.uk
6 wikipedia.org 39 instagram.com 115 nytimes.com
7 qq.com 42 xvideos.com 120 pixnet.net
8 taobao.com 45 imdb.com 148 livedoor.com
10 live.com 48 ifeng.com 167 skype.com
0 0.2 0.4 0.6 0.8 1 30 100 1000 10000 50000 CDF
Number of served domains CDF
Figure 2.7: CDF for served domains of DNS-hosting domains.
2.3.1.2 DNS-hosting Providers
Here we examine the upstream DNS-hosting providers profiled by our dataset. Figure 2.7 shows the distribution of the number of served domains for extracted DNS-hosting domains. The popularity of upstream domains is quite skewed. We observe that about 70% of hosting domains support fewer than 100 websites, and only 1.4% of hosting domains serve websites more than 1,000.
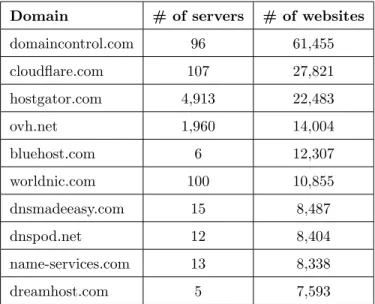
Table 2.4 lists the top 10 DNS-hosting domains in terms of the number of websites they support in Alexa’s list, with the number of servers identified in our dataset. These top 10 domains serve for 26.7% of websites using upstream ADNS. If we include all the domains with more than 1,000 served sites (i.e., 1.4% of hosting domains), this proportion increases to 62.6%. Meanwhile, as the second column of Table IV shows, the quantities of DNS-hosting servers vary considerably,9 from a few to thousands. This implies that the
DNS-hosting providers employ di↵erent system designs and implementations to achieve the load-balancing and reliable upstream ADNS services.
Note that the numbers of websites in Table 2.4 are produced by extracting hosting
9These servers are identified by their hostnames. In some cases, the service providers prefix the clients’ domains to their nameservers to form the client-specific hostnames of ADNSes. This causes the over-estimation of the number of servers for some providers (but not a common case).
Table 2.4: Top DNS-hosting Domains
Domain # of servers # of websites
domaincontrol.com 96 61,455 cloudflare.com 107 27,821 hostgator.com 4,913 22,483 ovh.net 1,960 14,004 bluehost.com 6 12,307 worldnic.com 100 10,855 dnsmadeeasy.com 15 8,487 dnspod.net 12 8,404 name-services.com 13 8,338 dreamhost.com 5 7,593
domains, not the service providers. In fact, several providers o↵er hosting services through multiple domains, e.g., Ultradns (see footnote 4), and Amazon’s DNS service. Amazon deploys a set of hosting domains (256 found), named awsdns-⇥⇥.com/net/org/co.uk, among which the quantities of served web domains remain balanced and stable (i.e., 220-320).
2.3.2 Number of Nameservers
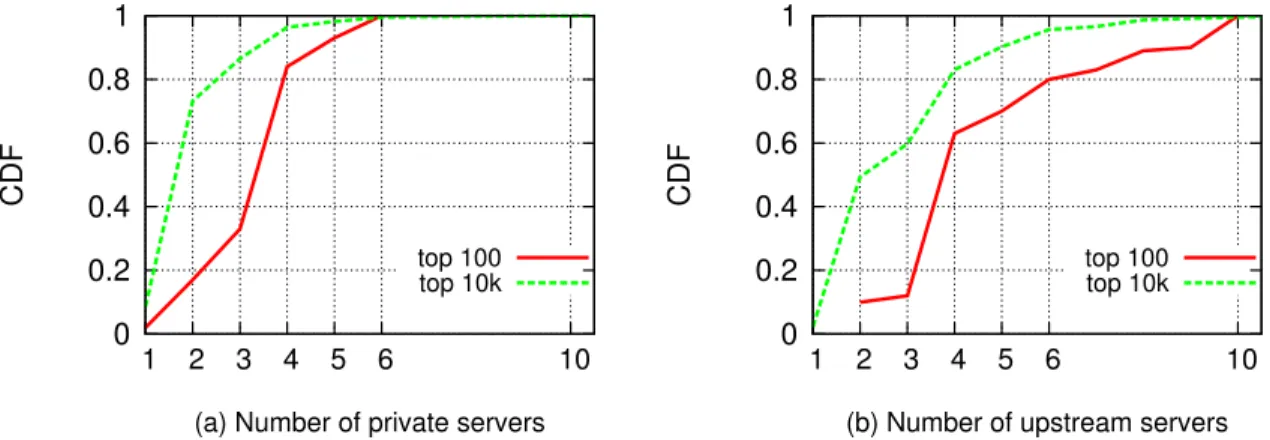
We quantify the usage of ADNS servers in terms of the deployment patterns. Figure 2.8 plots the cumulative distribution of the number of ADNS servers for each pattern.10
Generally, the websites using private ADNS servers tend to deploy slightly fewer servers than the sites using upstream services. This indicates that those sites have the ability to maintain a reliable DNS infrastructure, and various back-end techniques may be used, such as load balancing and failover. On the other hand, simply using more upstream servers is a convenient practice to achieve reliable name resolution. In addition, when looking at the quantities in terms of ranks, as shown in Figure 2.9, we observe that the high-ranked
10We omit the plotting for the overall result since it would show a similar distribution with the upstream pattern due to its dominant quantity.
0 0.2 0.4 0.6 0.8 1 1 2 5 10 12 CDF
Number of ADNS Servers private upstream hybrid
Figure 2.8: CDF for the number of ADNS servers.
0 0.2 0.4 0.6 0.8 1 1 2 3 4 5 6 10 CDF
(a) Number of private servers top 100 top 10k 0 0.2 0.4 0.6 0.8 1 1 2 3 4 5 6 10 CDF
(b) Number of upstream servers top 100 top 10k
Figure 2.9: CDFs for the number of ADNS servers of top sites (private and upstream). sites have more servers than others to handle the high-volume accesses. Figure 2.10 shows the CDFs for the numbers of private and upstream servers in hybrid deployment. They exhibit very similar distributions, and the number of servers for either type is less than that in pure private or upstream pattern.
In our dataset, there are only 209 (< 0.02%) and 28 (<0.003%) domains that have more than 12 and 13 DNS servers, respectively. For easy presentation, we do not show those domains in Figures 8-10. By briefly examining those websites equipped with a large number of ADNS servers, we recognize that 60% of them having more nameservers are mainly for the purpose ofmutual delegation. That is, a group of websites are served by a
0.5 0.6 0.7 0.8 0.9 1 1 2 3 5 10 CDF
Number of ADNSes in hybrid deployment private
upstream
Figure 2.10: CDF for the number of private and upstream servers in hybrid deployment. set of nameservers that consist of the private servers from every site. These websites with mutual delegation mainly fall into two categories: porn-related and loan-related websites, perhaps for circumventing the local laws or web inspection. This observation implies that the large number of ADNS servers could be a rough indicator of spam websites.
2.3.3 Time-to-Live Values
We now profile the Time-to-Live (TTL) settings of ADNS servers. Figure 2.11(a) shows the cumulative distribution of TTL values of NS records for di↵erent ADNS deployment patterns. We observe that the NS records extracted from the nameservers of a hybrid deployment have shorter TTL values than the records of private and upstream patterns. One possible reason to explain why this happens is that: the domain that decides to deploy hybrid DNS servers demands high availability and reliability, thus its system administra-tors are more meticulous and tend to maintain resilient configuration to quickly respond to the changes on ADNS settings.
Figure 2.11(b) shows the distribution of TTL values of A records. The A records of websites using upstream services have shorter TTL values since the majority of those websites run small businesses and may change their service deployment more frequently. The larger TTL values of websites following the hybrid pattern imply that those websites
0 0.2 0.4 0.6 0.8 1 15000 44000 86000 CDF
(a) TTL of NS Records (seconds) private upstream hybrid 0 0.2 0.4 0.6 0.8 1 15000 44000 86000 CDF (b) TTL of A Records (seconds) private upstream hybrid
Figure 2.11: CDFs for TTL values. indeed would like to maintain more stable services.
The larger TTL values of NS records have been identified by many prior studies [79, 65]. However, when comparing Figures 2.11(a) and 2.11(b), we observe that the hybrid deployment pattern has very similar TTL distributions for the NS and A records, while the NS records of private and upstream servers indeed demonstrate the larger TTL values than their A records.
2.3.4 Life-cycle of ADNS Servers
Our probing experiments are performed based on the ADNS server dataset collected in June 2014. After that, we also reproduced two additional lists of ADNS server information in December 2014 and April 2015, for the same Alexa’s list in June 2014, to examine how many records have been changed. We observe that 20.4% of ADNS records have been changed in December 2014, and 33.5% of records have been changed in April 2015.11
We study the ADNS changes at di↵erent levels. We refer to all changes on ADNS records as server change, i.e., the nameservers to be added, removed, or relocated. The
domain change means that the nameservers are relocated to di↵erent hosting domains. The pattern change means that the websites re-deploy their ADNSes with a di↵erent
infrastructure. Clearly, the domain change indicates the server change, and the pattern change indicates both the server change and the domain change.
The detailed breakdown appears in Table 2.5. Although a large number of ADNS records have been changed, we observe that the deployment patterns remain stable. The websites using upstream DNS services frequently change their hosting domains (i.e., third-party service providers), due to the low cost to migrate their authoritative records; but they also have the lowest frequency to change their deployment patterns, due to the high cost to deploy extra infrastructures to host their ADNS records.
Table 2.5: Summary of ADNS changes (%)
Patterns Dec. 2014 Apr. 2015
Ser. Dom. Pat. Ser. Dom. Pat.
Private 23.2 4.57 2.90 37.5 7.09 4.51
Upstream 16.7 8.56 1.78 24.7 13.59 2.47
Hybrid 25.3 4.35 3.22 37.2 6.66 4.67
Overall 20.4 6.34 2.53 33.5 8.05 3.68
2.3.5 Performance
To evaluate the DNS performance, we performed the DNS lookups for each nameserver of every domain, which involves 2,223,972 nameservers for 922,489 websites, from 70 globally distributed PlanetLab [30] nodes, and then we clustered the response times into groups according to the deployment patterns. The probings are performed twice each week during a one-month period. Figure 2.12 plots the cumulative distribution of the response times for each pattern. It demonstrates that the upstream services have a small but noticeable performance advantage, since the mainstream DNS-hosting providers have established the distributed infrastructure and spent significant e↵orts in optimizing their global access.
0
0.2
0.4
0.6
0.8
1
100 200 300 400 500 CDFResponse Times of DNS Queries (seconds)
private upstream hybrid
Figure 2.12: CDF for Response Times of DNS Queries.
2.3.6 Availability
To examine the availability of authoritative DNS servers, we first analyze the responsive-ness from the probing experiments above. During each probing period, we record a query’s response time and retry the unresponsive servers up to three times before we drop the probes. We then calculate the average rates of successful probes. We refer to the results from the performance experiment as Probe 1.
However, the performance probes focus on the response time and do not reflect the availability for a certain period of time. Thus, besides conducting the performance probes, we also perform an active probe experiment with an exponentially distributed interval of a one-hour mean, the same method used in [99], where the availability is defined as the ratio of the number of probes being responded and the number of probes being sent. We select four geo-distributed nodes (located at eastern- and western-US, Europe, and Asia) to issue the probes and run the measurement for approximately five weeks. We refer to the results from the exponential probes as Probe 2.
Table 2.6 summarizes the availability statistics from both probe sets. For each deploy-ment pattern, its server availability refers to the ratio between the successfully responded nameservers and the probed nameservers. The domain availability indicates the chance in
Table 2.6: Summary of Availability (%)
Patterns Probe 1 Probe 2
Server Domain Server Domain
Private 92.54 96.77 95.63 98.65
Upstream 94.44 97.76 98.87 99.04
Hybrid 94.33 97.71 96.93 99.89
Overall 93.54 97.47 97.39 98.98
percentage that at least one of the domain’s nameservers responds to the probes. The ma-jority of ADNS servers are available for almost the entire duration. In both probe sets, the servers in upstream deployment have the highest availability since they are more powerful and expensive servers aiming to provide DNS services for many customers. At the domain level, as one would expect, the hybrid deployment indeed exhibits higher availability than the other two deployment patterns in Probe 2.12
We observe that a few servers become dead during the experiment of Probe 2. We consider a nameserver becoming dead if the server remains no response for at least one week and until the end of the experiment. The dead servers/domains are removed from the results in Table VI. We observe that 3.3% of servers become dead, 87.4% of which are private servers. We further perform another probing in April 2015 to check the status of those severs that have been identified as dead in Probe 2. We find that only 6.4% of them respond to the probes, which implies that the corresponding domains having responsive servers now may have re-deployed their ADNS servers.
2.4
Cloud-hosting Subdomains
In this section, we explore the DNS deployment for subdomains hosted in IaaS clouds.
12In Probe 1, the upstream and hybrid deployment patterns demonstrate similar availability at the domain level, perhaps due to the occurrence of temporary network outage or congestion during the probes.
2.4.1 Deployment
We first extract the cloud-hosting subdomain list from [8] and reproduce the ADNS servers of subdomains in July 2014. Since the subdomains are associated with the websites on Alexa’s list,13 we use our private list to identify the private nameservers. Also, due to
the simplicity of cloud DNS and dominant quantity of subdomains in Amazon EC2, we only examine the EC2-using subdomains in our study.
Here we split the upstream service providers into two categories: the cloud-provided
DNS andnon-cloud-provided services (we still call them upstream providers). The ADNS-hosting servers of Amazon are simply identified by their hostnames, includingamazonaws, awsdns, andCloudFront. We also add a new category of ADNS deployments, called cloud-private, to represent the private DNS servers running atop EC2 instances. We extract the primary domain parts and perform the search like our previous step in Section 2.3. If we recognize a matching occurrence and the nameservers are not in theprivate list, we check if its IP address is located in Amazon EC2’s IP range [4].
Table 2.7 summarizes the usage of the ADNS deployment patterns, showing a di↵erent pattern usage. However, it would be similar to Table II if we combine the private and cloud-private, as well as the upstream and cloud-provided, into one category. We also observe a usage growth of cloud-provided DNS deployment from the original dataset (about 54%). Figure 2.13 plots the number of nameservers used by the cloud-hosting subdomains, which is slightly higher than the numbers shown in Figure 2.8.
2.4.2 Subdomain Delegation
Recall that in Figure 2.4(b), the primary websites may delegate the resolution of their cloud-hosting subdomains to dedicated nameservers. We identify the delegation by ex-tracting all subdomains’ CNAME records and search the CNAMEs in all NS records. We observe that 4.7% of cloud-hosting subdomains use this deployment style, and 97.6%
13The subdomain list [8] was generated by Alexa’s list in February 2013. We exclude the subdomains whose primary domains are not with Alexa’s list.
Table 2.7: Summary of Deployment patterns for cloud subdomains (%) Patterns % private 11.49 cloud-private 5.40 upstream 15.20 cloud-provided 66.59 hybrid 1.32
0
0.2
0.4
0.6
0.8
1
1 5 10CDF
Number of ADNS Servers for subdomains
CDF
Figure 2.13: CDF for the number of ADNS servers.
of them delegate the subdomains to upstream DNS-hosting providers. Not surprisingly, 89.4% of upstream servers are identified as cloud-provided nameservers.
2.4.3 Life-cycle of Servers
Table 2.8 summarizes the statistics of the changes of DNS records for cloud-hosting sub-domains. We recollected the DNS information in April 2015 to compare this dataset with the original one [8] (from February 2013) and the dataset used in our study (from July 2014). We observe a much greater change rate for both nameservers and hosting domains than the identified changes in Table 2.5.
Table 2.8: Summary of DNS changes for cloud subdomains (%)
Change Pattern Jul. 2014 Apr. 2015
Server 35.49 47.51
Domain 18.27 24.68
Pattern 14.64 20.39
2.5
Related Work
Pang et al. [99] presented a comprehensive DNS study by characterizing the properties of local and authoritative DNS infrastructures for the availability, usage, and deployment of DNS. Sisson [19] presented a survey that reports the number of DNS servers on the Internet and various aspects on configuration, such as the recursive support and security configuration. Our work revisits several of their key findings and examines these proper-ties with respect to the evolution of ADNS deployment associated with the use of cloud and upstream resolvers. Schomp et al. [107] presented the measurement techniques to discover the client-side DNS infrastructure and studied its behavior on caching. He et al. [69] examined how modern web services are using the cloud for deployment of their front ends. Our work focuses on the deployment and characteristics of authoritative DNS infrastructure for cloud-hosting services.
There have been studies to investigate the DNS infrastructure. Gao et al. [65] con-ducted a comprehensive measurement study on global DNS resolvers to reaffirm some findings in previous works and reveal the key di↵erences from root and local perspectives, respectively. Callahan et al. [50] passively monitored DNS traffic within a residential network to understand server behaviors and properties of the modern DNS system, such as DNS responses and the violation of TTLs. Jung et al. [79] presented a detailed anal-ysis of DNS traces to evaluate the client-perceived performance and the e↵ectiveness of DNS caching, and to simulate the e↵ect of varying TTLs and sharing caches. Lianget al.
[88] investigated the latency of upper DNS hierarchy and studied the impact of uneven distribution of top-level DNS servers on end-user latency. Pappas et al. [102] studied
the reduced availability and increased query delays caused by DNS misconfigurations, and presented three specific widespread types of misconfigurations: lame delegation, dimin-ished server redundancy, and cyclic zone dependency. Ager et al. [36] compared the local DNS resolvers against open DNS resolvers, i.e., GoogleDNS and OpenDNS, to examine the latency of DNS resolvers and the content of DNS caches.
There have also been prior works to examine the characteristics of DNS services from various aspects. Listonet al. [90] identified the diversity of DNS performance and investi-gated the degree to which they vary from site to site. Deccio et al. [62] proposed a model for server dependencies to measure DNS availability. Castro et al. [51] characterized the workload at root servers and analyzed some trends for DNS evolution, such as DNSSEC and DNS IPv6. Berger et al. [46] examined the associations between IPv6 addresses and IPv4 addresses of Internet DNS resolvers. Ramasubramanian et al. [105] studied the security aspects of nameserver dependencies and delegations. Cranoret al. [58] identified the distribution of DNS servers in clusters. Ottoet al. [97] studied the end-to-end impact of using remote DNS services in CDN, which breaks the assumption that the location of clients’ DNS resolvers is close to the actual location of clients.
2.6
Summary
We conduct a large-scale measurement study to quantify the deployment patterns of au-thoritative DNS servers and examine the characteristics of the patterns. We develop a simple heuristics-based method to determine the ADNS deployment patterns of web do-mains on Alexa’s top 1-million list. We observe that a majority of websites host the ADNSes in upstream services, but the top-ranked sites tend to deploy their own ADNSes. We then perform a probing experiment and observe the performance advantage from up-stream services. The hybrid pattern exhibits the high availability due to the redundant deployment. Finally we examine the usage of ADNSes for cloud-hosting subdomains, and observe a noticeable growth in the use of cloud-providing DNS hosting services.
Chapter 3
Exploring Domain Name Based
Features on the E
↵
ectiveness of
DNS Caching
DNS cache plays a critical role in domain name resolution for reduced workloads and low response latency to clients. In this work, we study the negative e↵ect on DNS caching caused by a new class of domain name misuse, the “one-time-use” or disposable domains, and explore and validate the features that could be used to identify this class of misused domain names, without employing complicated deep inspection techniques.
Since most misused domains, either malicious or benign, tend to transmit information over DNS query names, we explore the distinct features from domain name itself that are explicitly available from individual queries. Based on DNS trace logs captured in the resolvers of campus networks, we extract the re-used and once-used RRs. The reused RRs indicate that the queried domains are retrieved for multiple times, and the once-used RRs only appeared once in one trace. By analyzing a large amount of once-used entries, we observe that several explicit domain name-based features are capable to characterize the reusability of domain names. Based on these features, we propose simple policies to enhance the e↵ectiveness of DNS caching by preliminarily excluding those unreusable RRs.
In order to validate their capability, we quantify the statistical properties of each feature and build a classifier that combines the features. Our classification results demonstrate that our policies are able to prevent around 85% once-used RRs from being cached while only less than 1% reusable RRs are mistakenly kept out of the cache.
The reminder of this chapter is organized as follows. We introduce the background of DNS caching and disposable domains in §3.1. We present the proposed domain name-based features on DNS caching in §3.2. We analyze the collected datasets and build a classifier to validate our features in §3.3, and conduct a trace-driven evaluation in §3.4. We survey related work in§3.5. Finally, we conclude in§3.6.
3.1
Background
3.1.1 DNS Caching
Recursive DNS resolvers retrieve the name resolution results for clients and cache the received responses to answer the following queries. The duration that the cached records would be valid is specified by atime-to-live (TTL) value.
In standard TTL-based caching, the TTL value is set and handed out by the adminis-trator ofauthoritative DNS record, and the cached entries are expunged after their TTLs expire. The duration for caching a negative response (e.g., NXDOMAIN, NODATA,etc.) is given by the TTL value of SOA record [38]. However, although the TTL-aging-based behavior is legible, the violation of TTL is observed pervasively both in modern web browsers and DNS infrastructures [50]. For instance, many browsers and resolvers assign a minimum amount of seconds for holding a RR, and many resolvers trim the large TTL values to a default maximum value.
3.1.2 Domain Name Misuses
The use of DNS in various ways for which it was not originally designed has been observed for many years. For example, DNS is exploited as an e↵ective covert channel for
surrepti-tious communications [103, 127]. Moreover, Chen et al. [54] studied disposable domains, a more generic class of domain misuse where the query names are adopted to convey the “one-time signals”. These domains are not necessarily malicious and are observed per-vasively from various types of service providers, including popular search engines, social networks, CDNs, and security companies, and have being increased to a significant portion of queried domains on the Internet. Due to the “