PENSION FUNDING, PENSION ASSET ALLOCATION,
AND CORPORATE FINANCE:
EVIDENCE FROM INDIVIDUAL COMPANY DATA
Benjamin N. Friedman
Working Paper No. 957
NATIONAL BUREAU OF ECONOMIC RESEARCH
1050 Massachusetts Avenue
Cambridge
MA 02138August
1982The research reported here is part of the NBER's research programs in Financial Markets and Monetary Economics and in Pensions. Any opinions expressed are those of the author and
not
those of the National Bureau of Economic Research.NBER Working Paper #957 August 1982
PENSION FUNDING, PENSION ASSET ALLOCATION, AND CORPORATE FINANCE:
EVIDENCE FROM INDIVIDUAL COMPANY DATA
Abstract
This paper examines the relationship between U.S. corporations' management of their pension plans and their management of the more familiar aspects of corporate financial structure. The chief conclusion, on the basis of data for 7,828 pension plans sponsored by 1,836 companies and their subsidiaries, is that corporations do not manage the pension plans which they sponsor as if these plans had nothing to do with the corporation. Different responses appear to characterize firms' behavior in different contexts, but the evidence persistently indicates clear relationships between decisions about pension assets and liabilities and decisions about the other assets and liabilities of the firm.
At
the same time, the pattern of these relation-ships is, more often than not, inconsistent with familiar hypotheses that have emerged thus far in the theoretical literature analyzing pension aspects of corporate finance. Hence the conclusion from the data is also that the connections between pension decisions and corporate financial decisionsin the more conventional
sense are, at least as yet, not well understood.
Benjamin
M. FriedmanHarvard University Littauer Center 127 Cambridge, MA 02138
PENSION FUNDING, PENSION ASSET ALLOCATION, AND CORPORATE FINANCE:
EVIDENCE FROM INDIVIDUAL COMPANY DATA
Benjamin M. Friedxnan*
Harvard
University
Private pension funds
nowconstitute one of the largest pools of
investment
assets in the United States. Their total assets exceed $300 billion, and for the foreseeable future they are almost certain to grow still further in relation to the overall size of the U.S. financial markets. These funds already comprise by far the largest major category of institu-tional investor in the U.S. corporate equity market, and the second largest(after the life insurance industry) in the corporate bond market. As private pension funds continue to account for a steadily growing share
of these key markets, their behavior becomes increasingly important to the understanding of how the U.S. financial markets determine the yields on, and prices of, financial assets.
At the same time, both the assets held by private pension plans and these plans' liabilities for future benefit payments are now large —
and
growing —
in
relation to the non—pension assets and liabilities of the U.S. private business sector. Many major corporations' pension assets andpension liabilities represent substantial fractions of the net worth of the company, and in some cases even bulk large in comparison to the company's total assets. Because corporate equity shares therefore represent ownership claims on two pools of assets, and obligations via two sets of liabilities, shareholders clearly have a direct interest in the company's pension plan in addition to the quantities that appear on
—2—
its balance sheet. The larger are the assets and
liabilitiesof the
company's pension plan, the greater is their role, along with the non—
pension
assets andliabilities,
indetermining the sponsoring company's
overall
risk—return prospects. Hence private pension plans increasinglymatter not just for employees but for corporations' shareholders arid, in the
event of default, corporations' creditors.
The
growing importance of pension plans' assets and liabilities for nearly all constituencies within a typical corporation raises thepossibility that the corporation's overall financial position arid prospects may influence its strategy for funding its pension liabilities, as
well as its subsequent allocation of these funds among alternative
invest-ment
assets,
in any of a number of ways. Companies may useunfunded
pension
liabilities as a substitute for credit market debt, or alternativelyto extend overall indebtedness in conjunction with credit market debt. Similarly, companies may invest pension assets so as to mitigate, or alternatively to compound, the leverage and other
risk—determining
characteristics
of their business. Then, too, there may be no connection at all —perhaps because managements feel a responsibility to subordinate the corporation's interest in its pension plan to the interests of the plan's beneficiaries.Moreover, as private pension assets and liabilities continue to grow in relation to the
balance sheet of the typical corporation, the
possibilityarises that the connection between corporate finance and
pensions may be as relevant for understanding the former as the latter.
If companies face limitations on the management of their pension assets
and liabilities (as they do under the 1974 Employee Retirement Income
or
liability depends on whether it falls within the pension (as it does under the current U.S. Tax Code), thenthe
desired positioningof
the
company'sconsolidated pension plan and
balancesheet may
notbe
attainable solely through actions executed in the pension plan. In
such circumstances companies may
takeat least some
featuresof (or
constraints on) the pension plan
asgiven in
making decisions about thestructure
of their other assets and
liabilities.More generally, a
company
may actso as to determine the structure of its
pensionplan
and
thatof its balance sheet jointly.
The object of this paper is to test empirically for
interrelation-ships along just these lines between U.S. corporations' management of their pension plans and their management of the more familiar aspects of corporate financial structure. (e motivation underlying this effort
is
to subject to empirical scrutiny some of the theoretical hypotheses that have already emerged in the nascent literature of private pensions and corporate finance. In addition, the goal is to examine the datamore
broadly, to allow other regularities to appear which may be suggestive
in the further development of theory describing these aspects of
corpora-tions' financial behavior.
Because of the overwhelming heterogeneity of both
pensionarrange-ments and financial structure within the U.S. corporate business sector,
as well as the profusion of powerful economic, regulatory, and other
institutional influences that have shaped the pension and general corporate
financial environments in recent years, any attempt to conduct such an
investigation using aggregated time-series data would be of limited value.
Instead, the analysis undertaken here relies on individual company data
assembled from the pension plan information that each plan sponsor
—4—
provides to the Internal Revenue
Service and the U.S. Department of Labor
on Form 5500, used in conjunction with additional conventional individual
company financial statistics contained in the Standard and
Poor'sCompustat
file. The pension data are for planyear 1977, the only year
for
which a nearly complete Form 5500 file exists as of the timeof
writing.Section I describes the data and indicates the procedures used for such steps as within-firm aggregation of multiple pension plans, merging of the Form 5500 and Compustat files, and treatment of corporate parent—subsidiary relationships. Section II, which focuses on pension
funding strategy, presents the results of a series of tests for relation-ships between corporations' funding of their pension liabilities (the total of which is taken as given here) and other characteristics of the respective firms' business and balance sheet (also taken as given). Section III, also on pension funding strategy, digresses to examine the results of tests of the familiar hypothesis that corporations' decisions
in
this regard are oriented not to achieving fundamental financial
objectives but to smoothing their reported earnings statements over time.
Section IV, which focuses on
pension asset allocations, presents theresults of a series of tests for relationships between
corporations'
investment
of their pension assets (the total of which is taken as given here) and other characteristics of thefirm's business and
balance sheet(also taken as given).
Section V generalizes the line of investiga-tion pursuedin Section II by presenting results of tests for a joint
relationship between pension funding strategy and the corporation's
decisions
maynot
be predetermined with respect to pension fundingdecisions. Section VI
briefly
sununarizes the paper's principal conclusions, highlightssome important caveats, and indicates directions for potential
I. The Data
The Employee Retirement Income
Security
Act of 1974 requires each pension benefit plan sponsored by a U.S. corporation to file a reportann,
with the Internal
Revenue Service andthe
Department ofLabor,
on Form 5500 (or Form 5500-C if the plan covers 100 or fewer participants).
The form includes information about the plan's benefit structure, the
number and current status of the participants in the plan, the plan's
income and expenses for the year, and the plan's beginning—of—year and
end—of—year assets broken down into a substantial detail of investment
categories. Each defined benefit plan must also file Form 5500 Schedule B,
which provides actuarial
information about the plan's accruedliabilities,
including
its vested andnon-vested
liabilities separately, together withother related items. The Appendix shows the format of Form 5500 and
Schedule B.
The 1977 Employee Benefit Plan Sample
Filecontains all 29,120 Form
5500 returns
submitted forplan year 1977 and processed by
the InternalRevenue
Service between July 1,
1978,and June 30, 1979.1 Those returns
constituted
77.5% of the Form 5500 returns ultimately submitted for planyear 1977. The 22.5% of the returns that are missing from the file are heavily concentrated among smaller plans (as measured by asset size), how-ever.2 Of the 29,120 returns included in the file, 4,694 either pertained
to
plans sponsored by non—profit organizations
or reported zero assets.
The
remaining 24,426 returns
formthe basic sample used in this paper.
Table
1
shows the distribution of assets across this saxile of 24,426 plans. The combined assets for all 24,426 totaled $222 billion.3 The great majority of this $222 billion was concentrated in a small fractionTABLE 1 ASSET DISTRIBUTION OF DISAGGREGATED SAMPLE: ALL FOR-PROFIT SPONSORS Distribution of Plans Distribution of Assets Cumulative
Cumulative
Cumulative
Asset
Size
Number NumberPercent
Percent
Amount Amount Percent O —0.5
7,384
7,384
30.2
30.2
1.9
1.9
0.9
0.5
—1.0
4,127
11,511
16.9
47.1
3.2
5.1
1.4
1
— 58,414
19,925
34.4
81.6
19.7
24.8
8.8
5
— 101,864
21,789
7.6
89.2
13.1
37.9
5.9
10
— 251,368
23,157
5.6
94.8
21.4
59.4
9.7
25 — 50600
23,757
2.5
97.3
21.3
80.6
9.6
50
— 100 33524,092
1.4
98.6
23.7
104.4
10.7
100
— 250218
24,310 0.9 99.5 33.1 137.5 14.9 250 — 500 6124,371
0.3
99.8
21.3
158.8
9.6
500
—1,000
3324,404
0.1
99.9
23.4
182.2
10.5
over
i,ooo 22 24,426 0.1 100.0 40.0 222.2 18.0 Notes: Asset size categories in millions of dollars. Asset amounts in billions of dollars.—7—
of
the plans. Nearly one-half of the plans had less than $1 million in assets, andmore
than four-fifths had less than $5 million. By contrast,the 22 plans with more than $1 billion in assets together accounted for almost one-fifth of the total, and the 55 plans with more than $500 million together accounted for almost one-third.4
Because many
companies
sponsor more than one pension plan —one plan for salaried staff and another for wage earners, for example —the
24,426 plans in the sample represented only 15,098 sponsoring corporations.5 For purposes of testing hypotheses about relationships between pension asset and liability decisions and corporate financial behavior in the conventional sense, what presumably matters is not the assets or liabilities of any one of a corporation's pension plans but the combined assets and liabilities of all plans that it sponsors. Table 2 shows the distribution of the $222 billion in total assets across the 15,098 sponsoring firms in the sample. As is to be expected, aggregating all plans sponsored by a single firm shifts the distribution toward larger assets for each observation, although theeffect is quantitatively small.
The most common form of pension plan in the United States is the defined
benefit plan, but other forms (primarily the defined contribution
plan) exist as well. The distinction is relevant because the concept of
pension
"liabilities" has meaning only for defined benefit plans. For thesame reason, shareholders in a corporation have no direct financial interest in how the assets of a defined contribution plan perform. Of the 24,426 plans in Table 1, 16,200 sponsored by 10,470 different companies, and with $165 billion in assets, were defined benefit plans. Nevertheless,
856 of these plans failed to file Schedule B in time for the Internal Revenue Service to process it, along with the corresponding Form 5500
TABLE
2
ASSET DISTRIBUTION OF AGGREGATED SAMPLE: ALL FOR-PROFIT SPONSORS Distribution of Sponsors Distribution of Assets CumulativeCumulative
Cumulative
Asset
Size
Number NumberPercent
Percent
Amount Amount Percento
—.05
3,893
3,893
25.8
25.8
1.1
1.1
0.5
0.5
—1.0
2,389
6,282
15.8
41.6
1.9
2.9
0.8
1
— 55,308
11,590
35.2
76.8
12.6
15.5
5.7
5 — 101,301
12,891
8.6
85.4
9.2
24.7
4.1
10
— 251,036
13,927
6.9
92.2
16.5
41.2
7.4
25
— 50491
14,418
3.3
95.5
17.2
58.4
7.7
50
— 100296
14,714
2.0
97.5
20.6
78.9
9.3
100
— 250246
14,960
1.6
99.1
36.7
115.6
16.5
250
— 50073
15,033 0.5 99.6 25.6 141.3 11.5 500 —1,000
38 15,071 0.3 99.8 26.1 167.3 11.7 Over 1,000 27 15,098 0.2 100.0 54.8 222.2 24.7Notes
Asset size categories in millions of dollars. Asset amounts in billions of dollars.—8—
return, before June 30, 1979. The remaining 15,344 plans, sponsored by 9,899 companies, reported $152 billion in cnbined assets, Table 3 shows the distribution of these assets across the 9,899 firms.
The information contained in Form 5500 is insufficient, of course, to facilitate tests of hypotheses about
relationships
between pension asset andliability
decisions andcorporate
finance decisions in the conventional sense. Some source of information about each sponsoring company's balancesheet, as well as its income statement and other aspects of its financial situation, is also necessary. Because many of the 15,098 companies sponsoring pension plans included in the 1977 Form 5500 sample are either small or
closely held, however, obtaining such information on a comprehensive basis would be impractical if not impossible. By contrast, most of the larger
companies
are included in the Standard & Poor's
Compustat file. A systematicsearch,
based on a computer procedure supplemented with "by hand" inspection,
revealed
1,690 corporations included in the Compustat file that were sponsorsof 5,788 pension plans included in the 1977 Form 5500 sample.6
Even so, simply matching Compustat firms with pension plan sponsors would
still be inadequate.
The Compustat file reports balance sheets and earnings statements for each included corporation on a consolidated basis —that is, including all of the corporation's wholly owned subsidiaries.From
the perspective of analyzing corporate financial behavior at the
levelof the relationships posited in this investigation, consolidation is pres.un-ably
the
correct procedure. Matching Compustat firmswith
pension plan sponsorswould be inadequate, therefore, without also consolidating plans
sponsored by each Compustat firm with plans sponsored by its subsidiaries
(if
any).A laborious "by hand" search indeed revealed that 593
CompustatTABLE 3 ASSET DISTRIBUTION OF
AGGREGAD
SAMPLE: DEFINED BENEFIT PLANS ONLY Distribution of Sponsors Distribution of Assets CumulativeCumulative
Cumulative
Asset
Size
Number NumberPercent
Percent
Amount AmountPercent
o
—0.5
2,398
2,398
24.2
24.2
0.7
0.7
0.4
0.5
—1.0
1,498
3,896
15.].
39.4
1.2
1,8
0.8
1
— 53,414
7,310
34.5
73.8
8.2
10.0
5.4
5 — 10923
8,233
9.3
83.1
6.5
16.5
4.3
10
— 25 7769,009
7.8
91.0
12.3
28.8
8.1
25 — 50 3889,397
3.9
94.9
13.8
42.6
9.1
50
— 100240
9,637
2.4
97.4
16.9
59.5
11.2
100 — 250 1649,801
1.7
99.0
24.9
84.4
16.4
250 — 500 539,854
0.5
99.5
18.6
103.0
12.3
500 —i,ooo
309,884
0.3
99.8
20.9
124.0
13.8
Over
i,ooo
159,899
0.2
100.0
27.8
151.8
18.3
Notes:
Asset
size
categories
in
millions
of
dollars.
Asset
amounts
in
billions
of
dollars.
—'9—
pension plans included in the 1977 Form 5500 sample.7 Of the 593 Compustat
firms
sponsoring pension plans through subsidiaries, 447 also sponsoredone or more plans directly.
The fully aggregated and consolidated sample available for use in testing for relationships between pension decisions and corporate financial decisions
therefore consists of 7,828 pension plans (including defined
benefit as well as other type
plans,and,
amongdefined benefit plans,
those that did and did not file Schedule B), with $153 billion in combined
assets, sponsored by 1,836 consolidated companies.8 Table 4 shows the
distribution
of the $153billion of assets across the 1,836 firms.
Ofthe 7,828 plans sponsored by consolidated Coxnpustat companies, 5,836 were defined benefit plans, of which 5,670 filed Schedule B in time for Internal Revenue
Service processing. Table 5 shows the distribution of these 5,670
plans' $110 billion of assets across the plans' 1,552 sponsoring firms.
A comparison of Tables 2 and 4,and of Tables 3 and
5,shows
that the result of not only consolidating subsidiaries into parent companies but alsoexcluding all plans
not sponsored by a Compustat firm (even through a
sub-sidiary) is to shift the distribution further toward larger dollar amounts
9
TABLE
4
ASSET DISTRIBUTION OF AGGREGATED AND CONSOLIDATED SAMPLE: ALL COMPUSTAT SPONSORSDistribution
of
Sponsors
Distribution
of
Assets
Cumulative
Cumulative
Cumulative
Asset
Size
Number NumberPercent
Percent
Amount AmountPercent
o —0.5
87
87
4.7
4.7
0.0
0.0
0.0
0.5
—1.0
108
195
5.9
10.6
0.1
0.1
0.1
1 — 5389
584
21.2
31.8
1.0
1.1
0.7
5 — 10243
827
13.2
45.0
1.8
2.9
1.2
10
— 25 317 1,144 17.3 62.3 5.2 8.1 3.4 25 — 50 226 1,370 12.3 74.6 8.0 16.2 5.3 50 — 100 1801,550
9.8
84.4
12.6
28.8
8.2
100
— 250 180 1,730 9.8 94.2 27.4 56.2 18.0 250 — 50059
1,789 3.2 97,420.4
76.6
13.4
500 —1,000
28 1,817 1.5 99.0 19.2 95.8 12.6 1,000 —5,000
18
1,835
1.0 99.9 38.5 134.3 25.2 Over5,000
1 1,836 0.1 100.0 18.4 152.7 12.1 Notes: Asset size categories in millions of dollars. Asset amounts in billions of dollars.TABLE 5 ASSET DISTRIBUTION OF AGGREGATED SAMPLE: DEFINED BENEFIT PLANS ONLY, ALL COMPUSTAT SPONSORS
Distribution
of Sponsors Distribution of AssetsCumulative
Cumulative Cumulative Cumulative AssetSize
Number NumberPercent
Percent
Amount Amount Percent Percent o —0.5
87
87
5.6
5.6
0.0
0.0
0.0
0.0
0.5
—1.0
78
1655.0
10.6
0.1
0.1
0.1
0.1
1
— 5 342507
22.0
32.7
0.9
1.0
0.9
0.9
5
— 10204
71113.1
45.8
1.5
2.5
1.3
2.3
10
— 25283
944
18.264.0
4.7
7.24.3
6.525
— 50187
1,181
12.0
76.1
6.6
13.8
6.0
12.5
50
— 100170
1,351
11.0
87.0
12.2
26.0
11.1
23.6
100
— 250 128 1,479 8.2 95.320.0
46.0
18.1
41.8
250
— 500 44 1,523 2.8 98.1 15.9 61.8 14.4 56.2500
—1,000
18 1,541 1.2 99.3 12.7 74.5 11.5 67.7 1,000 —5,000
10 1,551 0.6 99.9 19.2 93,7 17.5 85.1 Over5,000
1 1,552 0.1 100.0 16.4 110.1 14.9 100.0 Notes: Asset size categories in millions of dollars. Asset amounts in billions of dollars.II. Pension Funding Strategy
In the most abstract conception of the incorporated firm, the assets and
liabilities
of a corporation's defined benefit pension plan(s) are just like the assets and liabilities that appear on its balance sheet. Shareholders own both sets of assets, and they are responsible (to the extent of their equity) for both sets of liabilities. Whether the firm's managementacts so as to maximize the share price, to maximize expected
profits, or to achieve
yet some other objective, there is no need to dis-tinguish between one pooi of assets and theother, or between one group of
liabilities
and the other.Such an abstraction may fail to describe the world of U.S. corpora-tions and their sponsored pension plans for several well-known reasons.'° At the most practical level, the firm's flexibility on the pension liability side is usually severely limited. Conventions of labor market practice, reinforced by legal requirements and often by collective bargaining agree-ments, restrict the range within which a firm and its workers can divide total labor
costs
between current and deferred compensation. To the extent that the firm's basic pension liabilities are predetermined from the perspec-tive of financial decision making, therefore, its choice of pension"liabilities" in this context refers only to that part of the basic actuarial liability
in excess of the amount
of assets coimitted to the pension fund. Hence decisions about pension "liabilities" in this sense are really decisions about pension assets. Moreover, the firm's flexibility is limited here too, in that its pension funding position must meet standards specified by the nployee Retirement Income Security ActWholly
apart fran such constraints, a variety of considerations may
—11—
substitutes for its other assets and
liabilities.
First, the implicitcost
of "borrowing" by less than
fullyfunding pension liabilities need
not be
identical, either before or after taxes, to the explicit cost ofborrowing
in the credit market.
In the extreme, the former "source offunds" may be
available at times when the latter is not. Even
underordinary
circumstances,
thescheduling of the "debt service" associated with the
two
kinds of liabilities may differ in important ways. Asecond
distinction is that pension liabilities, unlike the firm's other liabilities in most circumstances, are insured in a way that limits the firm's exposure. The Pension Benefit Guarantee Corporation insures corporations' pension liabil-ities in full but, in the event of default, has a claim on only one-third of the firm's assets. The tax treatment of pension plans provides a third reason why the simple abstraction, in which one asset or liability is just like any other, may not apply to actual corporations. Payments of funds into the pension plan are deductible from the firm's income for tax pur-poses, and earnings on assets held in the pension plan are excluded from taxable income. Finally —although
these four factors do not exhaust the possible reasons for distinguishing pension versusother
assetsand liabilities —
shareholders
and potential shareholders may
be more fullyaware of that part of a firm's liabilities which actually appears
on
its balancesheet.12
For
all of these familiarreasons,
therefore, a corporation may not behaveas
if it is indifferent between pensionand
other assets, or between pension and other liabilities. Hence instead of the usual networth constraint
where
TA and TL are the firm's total assets and total liabilities,respectively, and NW is net worth (assi.mted to be predetermined as of any
specific
time),the
more relevant expression isPA+BA-PL--BL =
NW (2)where PA and PL distinguish the assets and liabilities of the firm's defined benefit pension plan(s), while BA and BL represent the assets and liabilities
that appear on the firm's balance sheet.13
If the firm
were
free to choose simultaneously each of these four quantities, subject only to the net worth constraint, then its consolidated"portfolio"
behavior would take the familiar form
PA
=
c+BX
(3)
-BL
where
X is a vector ofexternal factors determining the firm's responses,
Ct
is
a vector of coefficients summing to unity, and
B
is a matrix of
coefficients with zero column sums. The most familiar empirical application
of
this conception is in a time—series context, in which Xwould include primarily (often exclusively) the expected yields on the respective assets and1iabilities. By contrast, in a cross—section context the elements of X are firm—specific factors that are taken to be predetermined with respect to the firm'sportfolio choice in the one time period under
observation, and that(at least potentially) influence that choice. To the
extentthat
some of the firm's portfolio choices are predetermined with respect to
—13—
belong
more properly
on the right. If the firmdecides
on its pension assets and liabilities only secondarily, after deciding on its otherliabilities,
then
PAand
PL maydepend on
BA and BLas
well as the otherfactors
included within X.
One question
that immediately
arises in this context is whether firms havefixed targets for their total liabilities (PTJ +
BL)so that
they
take on fewer pension liabilities as they have more liabilities on their balance sheets or, alternatively, whether they systematically use PL and BL together to achieve greater or lesser total leverage. Put in another way, the question is whether the firm treats pension liabilities and other liabilities as substitutes or conlements, although the sense of substitutability versus complementarity involved here differs somewhat from the usual one in which vector X includes specific time—varying yields associated with PL and BL.The evidence from the 1977 Form 5500 sample is consistent with comp].ementarity of PL and BL in this sense. Estimating the cross-section
regress ion
=
+y
(4)NW NW
for
the sample of all consolidated Compustat firms with defined benefit
plans
filing Schedule B yields y =.17,
with t—statistic 7.8
=.04).14
For
the subsample in which each firm's pension plan is sufficiently impor-tant in its overall structure that pension liabilities amount to at least3%
of the firm's total
assets,the result is y =
.26,
with t—statistic6.4 (R
2 =
.07).
For the further subsample in which PL/TA >.10,
the
Further
analysis that controls for other influences in the spirit
of
(3), while maintaining the assumption that BL is predetermined withrespect to PL, supports this conclusion. Table 6 reports estimation results for a series of regressions of the form
PL = EL
(5)
where
X is, in turn, each of a series of variables describing the firm andits operating environment. ice again, the positive relationship between pension and other liabilities (both scaled by net worth) holds up regardless of the choice of additional controlling variable.
The specific results for the partial effects of the several controlling variables are also interesting in some cases. Neither the growth rate nor
the
trend-adjusted variability of the firm's earnings had a significant
effect
on its pension liabilities. The 1977 rate of return on assetsaffected pension liabilities positively, but the mean rate of return over the past ten years did not. The negative effect of the volatility of rate of return was marginally significant in the full sample, but not in the
subsample with large pension liabilities relative to the firm's total assets. The firm's tax status had no significant effect. As would be expected, the
firm's labor intensiveness affected pension liabilities positively, arid the fraction of the firm's pension plan participants who were still employed affected pension liabilities negatively; but both effects were significant in the full sample only.
The failure of so many basic aspects of the firm's risk and return situation to affect its pension liabilities supports the suggestion, made
TABLE 6
RELATIONSHIP BEEEN PENSION LIABILITIES AND OTHER LIABILITIES
Ful]. Sample
PL/TA .
.10
Subsanle
Control Variable
_____
8p(EBIT)
.17
.32
.51
—.46(7.5)
(0.4)
(7.6)
(—0.2)
a(EBIT)
.17
.14
.51
1.20
(7.5)
(0.4)
(7.9)
(1.1)
ElBA.20
.60
.55
1.15
(6.7)
(3.1)
(6.8)
(2.0)
.16
.17
.46
.20
(5.6)
(0.6)
(6.0)
(0.2)
aCE/BA) .15 —.81 .46 —.46 (6.1) (—1.9)(6.8)
(—0.3)p(T/E)
.15 .00 .46 .06 (6.5) (0.4) (6.9) (1.0) p(L/S).20
.23
.66
.21
(5.6)
(2.0) (5.7) (0.6) AGE .15 —.44 .44 —.26 (6.1) (—5.6) (6.6) (—1.2)Note:
Results shown are estimated coefficients (and t—statistics) for the
regression
PL
=
BLcx+y—+8x
Variable
Symbols:p CEBIT)
=
ten-year
growthrate
of earnings before interest andtaxes
aCEBIT)
=
ten-year
normalized standard deviation of EBIT aroundits
growthtrend
E/BA
=
ratio
of earnings to non—pension assetspCE/BA)
=
ten-year
mean of EISA
a CE/BA)
=
ten-year
standard deviation of E/BA around p CE/BA)
u(T/E)
=
five-year
mean of ratio of taxes paid to before—tax earnings
p(L/S)
=
five—year
mean of ratio of labor and related expenses to net sales
AGE
=
ratio
of pension plan participants currently employed to all
sense. Instead, the firm may take PL as given —
by
labor market
considerations,
for example —so
that its actual choice in thiscontext is simply how much of its pension liabilities to fund. If the firm
were
free to choose in this context, its portfolio problem would take the form-BL =
a+BX.
(6)
-(PL - PA)
Moreover, if the firm decides only secondarily on its unfunded pension liabilities (that is, on its pension assets in this context), then again the possibility arises that (PL — PA) depends on BA and BL as well as on any
or
all of the other factors included within X.The parallel question in this context is whether firms
with
large amounts of debt on their balance sheet choose to have greater or smaller amounts of unfunded liabilities. In this form the question bears a direct connection to at least one prominent line of theoretical analysis of howcorporations'
pension funding decisions depend on their financial condition.In
particular, Sharpe (1976)
has suggested that an important rationale forfirms to
fund their pension plans less than fully is the value of the
insurance provided by the Pension Benefit Guarantee Corporation (PBGC) •15
In Sharpe's analysis the insurance written by the PBGC is equivalent to
a put option, and the firm's incentive is to maximize the value at the put.
A major implication of this line of reasoning is that firms
forwhich the
probability of bankruptcy is nontrivial have an incentive to underfund their
pension
plans. The more highly levered a firm is, therefore —that is,the
—16—
is
the firm's incentive to underfurid its pension plan. In terms of the
current analysis, therefore, the Sharpe hypothesis suggest that BL and
(PL
—
PA) are complements.The
evidence from the
1977 Form5500
sampleis
consistent withcomplementarity not only
of
BL andPt,
as in (4), but also of BL and(PL
—PA).
Hence the data are consistent with Sharpe's analysis of the pension funding decision. Estimating the cross—section regressionPL-PA
— EL(7)
NW
a+y
for the full sample yields y =
.14,
with t—statistic 10.1 2 =.07)
16 For the subsample of firms with PL/TA >.03,
the corresponding results are y =.25,
with t—statistic 9.3 (R2 =.13).
For the subsample with Pt/TA >.10,
the results are y =.44,
with t—statistic 10.8 (R 2=
.27).
Table 7 shows estimation results, comparable to those in Table 6, for a parallel series of regressions
PL-PA
C+y+X
(8)
that differ only in the assnption that the firm's choice variable is
unfunded pension liabilities rather than total pension liabilities.
Here Sharpe's analysis implies that aspects of the firm's operating
environment
that affect its probability of bankruptcy —variability
of earnings, for example —should
also increase the
firm's incentive to underfund itspension.
ice again, the strongpositive
relationship between(unfunded) pension liabilities and the firm's other liabilities
Full Sample
PL/TA .
.10Subsample
Control Variable
_____
______
_____
______
p(EBIT)
.14
.13
.45
—.82(9.6)
(0.3)
(10.2)
(—0.4)
a(EBIT)
.14 .17 .45 1.05 (9.7) (0.8) (10.8) (1.3) E/BA .15 .35 .48 .88 (7.3) (2.7) (8.1) (2.1) liCE/BA) .12 .12 .42 .25 (6.5) (0.7) (7.5) (0.4) c(E/BA).12
—.32 .41 .11 (7.0) (—1.1)(8.4)
(0.1)
li(T/E)
.11 .00 .39 .05 (7.2)(0.4)
(8.2)
(1.1)
l1(L/S)
.16 .16 .53 .30 (7.4)(2.1)
(8.0)
(1.1)
AGE .12 —.31 .39 —.37 (7.1) (—6.0)(8.1)
(—2.4)Notes: Results shown are estimated coefficients (arid t-statistics) for the
regression
PL-PA
BLNW =
—17—
effects
of the individual controlling variables are again about
as inTable
6. In particular, neither volatility of earnings
nor volatilityof
rate of return exhibits the significant positive effect that would
be
consistent with Sharpe's hypothesis.Finally,
the form of both (7)
and (8)assumes not only that the firm
takes
its
pension liabilities as given in deciding on pension funding, but alsothat the firm
takesdecisions solely on the difference (PL —
PA)irrespective
of either individual amount. In otherwords, (7)
arid (8)are equivalent, respectively, to
=
(9)
NW NW NWand
PA = PL ELa+6+y—+x
(10)subject
to the constraint (S =1.
The data consistently reject this con-straint, however. Estimating (9) for the full sample yields (S =
.60
and= —.06
with respective t—statistics 42.8 and —4.9 (R2 =
59)17
For the subsample with PL/TA >.03,
the corresponding results are 6 .63 andy =
-.09,
with respective t-statistics 32.8 and —4.4 (2 =.66).
For the subsample with PL/TA >
.10,
the results are 6 =.66
and y =-.16,
with respective t—statistics 22.6 and —4.7 (R2 =.64).
The results ofestimating (10) with
any
of the control variables shownin Tables 6 and
7indicate similar values for iS and y,
and
values that are again consistentwith
those
found inestimating (5) and (8).
Hence the fLrm-to-fjrm variation in pension funding does not
simply
At
the margin, with
otherfactors equal, a firm
withan additional $1 of
pension liabilities typically funds only
about60 more in pension assets.
This marginal funding rate —
marginal
from one firm to the
next,that is,
rather than
forone
firm overtime —
is
also just equal to the average
funding ratio (.62) for all firms
inthe sample. In addition, the
consistent finding of a negative y value in (9) and
(10)indicates that
firms
withgreater amounts of non-pension liabilities fund their pension
liabilities less fully, to
the extent of about a l0 reduction in pension funding for each $1 of additional non—pension liabilities. This result is again consistent with Sharpe's analysis of the pension funding decision in the context of the value of the put to the PBGC.The main conclusions that emerge from this consideration of the firm's choice of pension liabilities and funding, on the asstunption that the asset and liability totals on the firm's balance sheet are predetermined with respect to its pension decisions, are (1) that pension liabilities, either in total or in excess of funding, depend positively on the firm's other liabilities; (2) that firms do not make decisions simply with respect to their unfunded pension liabilities, but instead fund pension liabilities less than one-for-one at the margin; (3) that funding of the firm's pension liabilities depends negatively on its other liabilities; and (4) that,
apart from labor—specific characteristics like the firm's labor intensiveness and the working—retired status of its labor force, basic aspects of the
firm's risk and return position have no apparent effect on its choice of either total or unfunded pension liabilities.
—19—
III. The Earnings Smoothing Hypothesis
The discussion of pension funding strategy in Section II focuses on fundamental aspects of portfolio behavior: substitutability versus
complementarity of pension arid other liabilities, the degree to which pension assets offset pension liabilities, and the role of other measures of risk and return confronting the firm. From the perspective of any familiar theory of corporate financial behavior, these considerations and others like them are the principal determinants of the firm's pension decisions.
By contrast, discussions of pension funding strategy by corporate practitioners often emphasize different factors. In particular, in seeking to explain why so many firms underfund their pension pians
despite
apparent tax incentives to fund fully, corporate financial officers and other financial market participants frequently cite the "hidden" nature of pension liabilities. Because the pension plan is off the balance sheet, shareholders and others may be at least partly unaware of the associated liabilities. The most obvious implication of this assertion is that a firm may be able to raise its share price by substituting pension liabilities for liabilities that appear on the balance sheet, but recent research on the relationship between stock prices and pension liabilities has provided evidence that typically18 warrants rejecting this proposition.
A further implication of the idea that pension assets and liabilities are "hidden" is that shareholders and other interested persons may judge
the firm's performance by its reported earnings, rather than by more com-prehensive flow measures. Because contributions to a firm's pension plan
reduce
its reported earnings in the same way as any other expense item,
control over the timing of pension contributions enables firms to influence
the
time path of reported earnings. Tothe
extent that the management seeksto report smoothly growing earnings over time, therefore, it
maywant to
increase
pension contributions when business is strong and reduce them whenbusiness is weak. Such actions need not change the total amount contributed to the pension plan over time. Indeed, in the broader context that consol-idates the firm's pension assets arid liabilities with its other assets and liabilities, such actions change nothing at all. They have a purpose only if some constituency, whose actions matter to the corporation, focuses on the time path of reported earnings.
This earnings smoothing hypothesis provides a potential explanation for the pension underfunding puzzle to the extent that firms with unfunded pension liabilities have more flexibility to adjust the timing of their
pension contributions than do firms with fully funded pensions. Restrictions on pre-funding unaccrued pension liabilities prevent a firm with a fully
funded pension from making extraordinary increases in contributions, and firms that simply decide to fund fully choose thereby to forego using the potential flexibility in the opposite direction.
Data from the 1977 Form 5500 sample provide evidence indicating that firms typically do manage earnings in this way. For the entire sample of firms with defined benefit plans, 70.0% had before—tax reported
earnings
streams that were smoother, as measured by the normalized ten—year standard
deviation
around trend, than the corresponding consolidated earnings includingpension contributions. On an after-tax basis, with the included pension contributions adjusted for additional taxes that the firm would otherwise have paid, 70.5% of firms had smoother reported earnings than consolidated
earnings
-Nevertheless,
the data provide almost no support for the claim that firms with underfunded pension liabilities are more likely to manage their—21—
reported earnings in this way. Table 8 shows the percentages of firms
with
smoother reported than consolidated earnings, comparable to the percentages reported above, for a break-down of the full sample according to the ratio of pension assets to pension liabilities. If anything, these distributions seem to indicate that firms with underfunded pension liabilites are less likely to engage in smoothing their reported earnings by managing their pension contributions. Only for the two extreme subsamples —with fundingratios below .10 or above .90 —does the relationship go in the hypothesized
direction.
A more systematic examination of the data confirms this impression. Estimating the regression
aCE) PA
aCE + PC) =
' +
(11)where
aCE) and a(E +
PC)are the normalized ten-year standard deviations of
reported earnings and consolidated earnings, respectively, yields a value
of
which is positive, as hypothesized, but negligibly small andwith
t—statistic
less than 0.1. The results for the relationship based onafter—tax earnings are analogous.
In stan, the evidence does show substantial prevalence of the timing of pension contributions so as to smooth reported earnings, but it does not support the hypothesis relating this activity to the funding status of firms'
pensions. The explanation for the underfunding puzzle apparently lies
Funding Ratio
0—.].
.1 —.2
.2
—.3
.3 —.4
.4
—.5
.5 —.6
.6 —
.7
.7 —.8
.8 —
.9
.9 —1.0
Percentage Showing Smoother Reported
Than Consolidated Earnings
Before Tax
After Tax
64.3%
78.6%
50.0
66.7
53.3
53.3 69.0 66.7 77.677.6
73.6
75.7 71.070.2
69.8
70.6
77.1
72.9 58.660.6
—22—
IV. Pension Asset Allocations
Private pension pians invest their assets in a way unlike any other major category of institutional investors. For the aggregate of all pension
plans, nearly two—thirds of all assets held are corporate equities. Among other major investor groups (apart from mutual funds), the corresponding fractions are about one-fifth equities for the public pension plans sponsored by state and local governments, one-sixth equities for fire and casualty insurance companies, and one-ninth equities for life insurance companies
(even including some "separate accounts")
19
Clearly there is something unique about the investment choices made by private pension plans.
To the extent that the assets in a corporation's defined benefit pension plan "belong" to the sponsoring firm's shareholders, in the sense that they and not the plan's beneficiaries stand to gain or lose according to the assets' return, the heavy concentration of private pension assets in equities is not surprising.0 By holding the corporation's shares in the first place, shareholders have already expressed the desire for an equity investment. Because of the pension plan(s) that the firm sponsors, however, each such investment represents ownership in two pools of assets. If the firm's pension plan holds debt securities instead of equities, then the -shareholder's investment is no longer a pure (or even levered) equity but a
mixture of debt and equity claims.
In the simplest abstraction like that used to motivate the discussion in Section II, a corporation would not hold its pension assets in any form other than the ordinary assets of its business —that is, in its own stock. Legal restrictions preclude holding pension assets entirely in this form, however, and also impose "prudence" standards that many firms interpret
a fully diversified basis. Once again, therefore, the extreme simplifica-tion does
not adequately describe the behavior of actual corporations and
the pension plans that they sponsor. In addition, tax considerations appear
to favor holding equity assets outside the pension plan and
debtassets in
the plan.21
The discussion in Section II emphasizes the role of the firm's pension assets and liabilities, along with the assets and liabilities on its balance
sheet,
in determining its overall risk and return posture. The allocation
of the pension assets among alternative investment
vehicles is a furtherelement in this calculus. For example, borrowing in the credit market to finance additional (tax-deduction augmented) pension contributions has essentially no risk implications for the firm if the pension plan then invests these funds in debt securities, but such an action increases the firm's risk if the pension plan invests in equities.22
The dependence of the firm's riskand return posture on the allocation of its pension assets raises in turn the possibility that these allocations may depend on the firm's asset—liability structure in thesense of either (1) or (2), or on other characteristics of the firm's business and
financial situation as introduced in (3), or on both. Sharpe's analysis described in Section II, for example, suggests that firms with nontrivial probability of bankruptcy have an incentive to maximize the value of the effective put to the PBGC. In the context of pension asset allocation decisions, therefore, the Sharpe hypothesis is that firms bearing greater overall risk will tend to invest their pension assets more in equities. Hence the more highly levered a firm is (as measured by debt on the balance sheet or by unfunded pension liabilities), or the
—24—
incentive to invest its pension
assets
in equities.In the simple context of (3), the question of pension asset allocation represents simply a disaggregation within the pension asset total PA. By contrast, if the total amount of pension assets is predeter-mined with respect to the allocation as seems plausible in the
context of most corporations' decision procedures —then PA is the constraining variable and
the
portfolio choice problem is of the formPA1
PA2
=
a+BX
(12)PAN
where the PA. are specific forms of pension assets, and and B are again as in (3). Table 9 presents the results of estimating this relationship,
for
the sample of all Compus tat firms sponsoring defined benefit plans,
in the somewhat different form
PAE
1
PAD =
PAa
+y
+x
(13)PAO
where PAE, PAD and PAO are pension assets in defined benefit plans, held in equities, debt securities, and other investment vehicles, respectively, cis a vector of coefficients swnxning to zero, and y is a vector of coefficients summing
to
unity.The one result that stands out in Table 9 is the negative relation-ship between the allocation of pension assets to equities and the
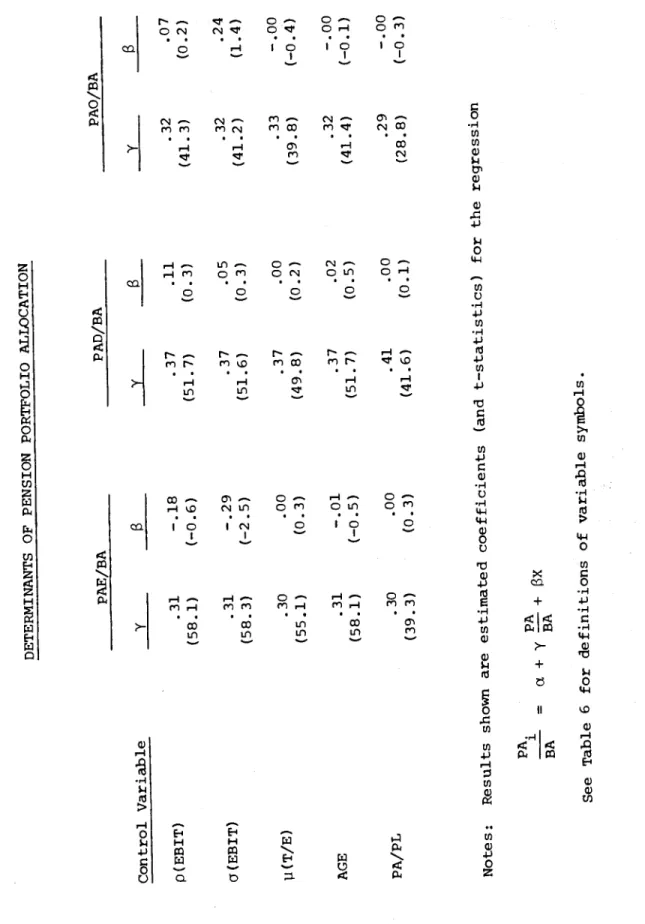
TABLE 9 DETERMINANTS OF PENSION PORTFOLIO ALLOCATION PAE/BA PAD/BA PAO/BA Control Variable y - ______
_____
______
c(EBIT)
.31 —.18 .37 .11 .32 (58.1) (—0.6) (51.7) (0.3) (41.3) G(EBIT) .31 —.29 .37 .05 .32 (58.3) (—2.5) (51.6) (0.3) (41.2) .30 .00 .37 .00 .33 (55.1) (0.3) (49.8) (0.2) (39.8) ACE .31 —.01 .37 .02 .32 (58.1) (—0.5) (51.7) (0.5) (41.4) PA/PL .30 .00 .41 .00 .29 (39.3) (0.3) (41.6) (0.1) (28.8) Notes: Results shown are estimated coefficients (and t—statistics) for the regression PA. 1 PA—
=
BA BA See Table 6 for definitions of variable symbols.—25—
variability of the firm's earnings relative to trend —a result that is directly counter to the implication of Sharpe's hypothesis. Moreover, this result holds regardless of the definition of earnings used (before tax, after tax, with or without consolidation of pension contributions, etc.), and
it
also holds for subsaxnpleslimited according
to the importance23
of pension
assets
in the firm's overall asset structure. Hence firms with greater business risk, as measured by greater volatility of earnings, systematically seek to offset at least part of that risk by investing their pension assets in instruments other than equities.It is interesting that several measures included in Table 9
do not appear to affect pension asset allocations. Despite the incentives for taxable firms to hold high—yield assets in their pension plans and low—yield assets on their balance sheets, as emphasized by Black (1980) and Tepper (1981), the firm's tax status over the past five years had no apparent impact at this level. Similarly, although the age and related structure of the pension plan's beneficiary population affects the time profile of liabilities under the plan, the current employment ratio also had no effect. Finally, the firm's overall pension funding ratio had no noticeable effect either —
again
in apparent contradiction of Sharpe's analysis.It is also useful to note how two specific aspects of the results shown in Table 9 carry over to the larger sample including Compustat firms' defined contribution plans as well as their defined benefit plans. First, the negative relationship between earnings volatility and the equity alloca-tion was smaller in absolute magnitude, but statistically more significant, in the broader sample.24 With cY(EBIT) as the control variable in (13), the
estimated value of
in the equity equation was —.11, with t—statistic
-4.0 (R
2
=.60).
Second,although the current employment ratio of the
beneficiary
populationdid not matter in the defined-benefit—only saxle,
it did in the broader sample. With AGE as the control variable, the
estimated
value of in the equity equation was .014, witht—statistic
2.1
(R 2 =.60)
25 Because a large AGE ratio typically reflects a younger beneficiary population, a positive value meansthat plans with younger
workers
are typically more heavily invested in equities. Hence pension plans in which the beneficiaries stand to gain or lose according to the return on the plan's invested assets do take account of the beneficiarypopulation's age structure in making asset allocation decisions, even though plans in which the firm's shareholders stand to gain or lose from the
assets' return do not.
The pension asset allocation and
the
pension funding ratio are two major determinants of prospective risk and return for manyfirms.
A third important element in the risk and return structure, of course, is the debt on the firm's balance sheet. The relationship among these several components raises the possibility, therefore, that the firm's allocation of its pension assets may also depend on its basic leverage. A relationship consistent with the risk—offsetting strategy reported above, for example, would be for highly levered firms to offset some of their leverage by holding debtsecurities in their defined benefit pension plans.27 Alternatively, under
either Sharpe 's PBGC put hypothesis or some form of "general
aggressiveness" hypothesis, firms content to have a more leveraged
position,
asindicated by the liabilities on their balance sheets,
might further extend that risk posture by investing their pension assets
—27—
Table
10 presents the results of an attempt to examine this question in compact form by estimating the regressionPAD BL
PAD+PAE
=
cL+YBL+BEQ+X
(14)where BEQ is the book value of equity on the firm's balance sheet, and
all
other variables are as before. The estimated value of y is consistently positive, in contradiction to either the Sharpe hypothesis or a "general aggressiveness" hypothesis, indicating instead that firms with more highlylevered balance sheets have some tendency to offset that leverage
28
by
investing more or their pension assets in debt secuzities. Somewhatsurprisingly, however, this positive relationship is statistically
significant (and
larger) in the broader
sampleincluding
defined contribu-tion plans but not in the sample limitedto defined benefit plans.
The estimated $
values
shown in Table 10 support and extend the
findings shown in Table 9
inseveral ways. First, the allocation
of pensionassets
to debt securities is positively related to anymeasure of the
variability of earnings. It is
interesting that this effect, too,is
always largerand more highly significant in the broader sample. Second, firms
with
high rates of return (to either assets or book equity) tend to invest their pension assets more in equities and less in debt securities. Third, the firm's tax statusapparently
has no independent impact on pension asset allocation,although allowing for it about doubles
the estimated magnitudeof the effect of balance sheet leverage. Fourth, after allowance for balance
sheet leverage, firms with yowiger pension beneficiary populations tend to
invest more in debt securities and less in equities, although the estimated
effect is smaller (as would be expected) and statistically insignificant
Defined Benefit Only All Pension Plans Control Variable _____
______
______
P(EBIT) .05 —.23 .09 .07 (0.9) (—0.3)(1.9)
(0.1)
o(EBIT)
.05
1.3]. .09 1.86 (1.1)(3.6)
(2.0)
(5.7)
p(E/BA)
.02
—.25.02
—.55(0.4)
(—0.8)(0.4)
(—1.9)(E/BA)
.05
1.77.09
2.96
(1.1)
(3.8)
(2.0)
(6.9)
1J(E/EQ).04
—.08.07
—.11(0.7)
(—2.1)(1.5)
(—2.6)a(E/EQ)
.04 .03 .07 .04 (0.8) (1.9) 1.6) (2.3) i(T/E) .10 .00 .17 .00 (2.0) (0.5) (3.8) (0.4) AGE .05 .22 .08 .14 (1.0) (2.6) (1.9) (1.8)Notes: Results shown are estimated coefficients (and t—statistics) for the regression
PAD BL
PAD+PAE
=Z+YBL
BEQE/EQ
=
ratio
of earnings to book value of equity
(E/EQ) =
ten-year
mean of E/EQ
c(E/EQ) =
ten-year
standard deviation of
E/EQ around 1.t(E/EQ)—28—
in
the broader sample including defined contribution plans.The main conclusions of this analysis of the allocation of pension assets, on
the
assumption that not only the pension asset total but also theother principal elements of the firm's asset and liability structure
are predetermined with respect to that allocation choice, are
(1) thatfirms
with
more volatile
earnings invest pension assets so as to offset theirordinary
business risk by holding less equity and
more debt securities inthe
pension; (2) that firms with more highly leveraged balance sheets invest
pension
assets soas to offset
this risk too, again by holding less equity and more debt securities in the pension; (3) that firms earning high rates of return adopt the opposite allocation strategy, investing pension assets more in equities and less in debt securities; and (4) that firms' pension asset allocation decisions also depend on the current employment status of the pension beneficiary population, with employed (hence presumably younger) beneficiaries leading firms with defined benefit plans to invest pension assets less in equity and more in debt securities, but with just the opposite effect for defined contribution plans.V. The Corporate Balance Sheet
The empirical analysis undertaken in Sections II and IV considers first the firm's pension funding strategy, and then its pension asset allocation, on the assumption that the
amount
and nature of assets and liabilities on the firm's balance sheet are predetermined with respect to decisions about the firm's pension. Such a secondary role for pension decisions in corporate financial structures may be plausible when the sums involved are small in relation to the sponsoring firm's ordinary business assets and liabilities. In an increasing number of corporations, however, pension liabilities (and pension assets too, if the liabilities are fullyfunded) are large in comparison to the assets and liabilities that appear on the firm's balance sheet. Moreover, pensions are continuing to grow more rapidly than general corporate assets or liabilities. The larger
pensions become, the more likely it is that firms make decisions about their pension assets and liabilities and their other assets and liabilities
jointly.
As the discussion in Section II already emphasizes, the combination of legal requirements and established labor market practices sharply restricts many firms' flexibility with respect to their pension liabilities. In
considering possible interrelationships by which the firm's pension assets and liabilities affect its ordinary business decisions, therefore, a useful place to begin is the possibility that the direction of influence in (4)
and (5) is backward. Estimating the reverse relationship, in which the firm takes its pension liabilities as given in deciding how much to borrow on
its
balance
sheet,=
c+y
(15)—30—
yields
y =.26,
with t—statistic 7.8 (R2 =.04),
for the sample of allConipustat
firms sponsoring defined benefit plans, and y
=
.34,
witht-statistic
7.9
(R2
=.17)
for the subsample in which each firm's pension
29
liabilities equal at least one—tenth of its total assets.
That estimating (4) in the reverse order (15) again leads to a
significant positive relationship is hardly surprising. What is more
interesting is that the
positive partial relationship between pensionliabilities
and other liabilities —
that
is, the relationship after
allowance for other controlling variables —
also
holds up on reversal
of the ordering. Table 11 presents results, analogous to those in
Table 6, of estimating the reverse of (5),
=
(16)
for the full sample and the sample with PL/TA >
.10.
ice again, the strong
positive value of y appears regardless of the choice of controlling variables.
Although the focus of this paper is not on corporations' debt issuance,
except in
its relation to their sponsored pension plans, it is interestingnevertheless to notice several of the values in Table 11. First, the growth of earnings had no effect on pension liabilities in (5), but earnings growth negatively affects other liabilities in (16). This result also holds for other definitions of earnings. Second, the mean rate of return either
on
assets or on equity (not shown in the table) had no effect on pension
liabilities in (5), but mean returns negatively affect other liabilities
in (16). Third, the variability of the firm's rate of return affected
pension liabilities negatively in (5), but return variability affects other
Full Sample
PL/TA
.10
Subsample
Control Vari1e
_____
p(EBIT)
.25 —5.62 .32 —8.45 (7.5) (—6.5) (7.6) (—4.0)C(EBIT)
.26 .40 .34 —.92 (7.5) (1.0) (7.9) (—1.0) E/BA .22 —3.52 .28 —3.77 (6.9) (—20.6) (6.8) (—11.1) p(E/BA) .20 —4.].]. .27 —4.66 (5.6) (—15.5) (6.0) (—8.6) o(E/BA) .24 1.20 .34 1.54 (6.1) (2.3) (6.8) (1.1) .24 .00 .33 —.02 (6.5) (0.1) (6.9) (—0.5) p(L/s).28
—.33 .30 —.63 (5.6) (—2.4)(5.7)
(—2.5) AGE.24
.12 .33 —.28 (6.1) (1.2) (6.6) (—1.5)Notes: Results shown are estimated coefficients (and t—statistics) for the regression
BL
=
PL—31—
labor intensity affected pension liabilities positively in (5), at least in the full sample, but labor intensity affects other liabilities
negatively in (16). Each of these influences is familiar in the literature
on
corporate choice of capital structures, and these results would perhaps
be of interest in an investigation of that subject. In the context of this
paper's focus on pensions, the main point is simply that the positive
partial relationship between pension liabilities and
other liabilitiesholds
up
after allowance for any ofthese separate effects.
Similar
conclusions follow fran reversing the order of (7) and (8),which treat not total pension liabilities but only the unfunded portion as the relevant measure. Estimating the reverse relationship
EL
=
PL-PA
(17)
yields y =
.50
with t—statistic 10.12
=
.07),
for the full sample andy =
.61,
with t-statistic 10.8 (R 2=
.27)
for the PL/TA >.10
subsample.31Controlling for additional influences by estimating the regression
BL =
PL-PA
cz+y
(1.8)also yields consistently positive y values, and values roughly in line with those shown in Table 11 and discussed above.
Cmce again, it is useful to examine whether pension liabilities and assets
matter separately in this context, or whether what matters is only
the difference, as in (17) and
(18).Estimating the regression
BL = PL PA