CREI Working Paper no. 10/2011
Forced Manager Turnovers in English Soccer Leagues:
A Long-Term Perspective
by
Stefano D’Addona
Axel Kind
University of Roma Tre
University of Basel
available online at http://host.uniroma3.it/centri/crei/pubblicazioni.html
ISSN 1971-6907
Outputs from CREI research in progress, as well contributions fromexternal scholars and draft reports based on CREI seminars andworkshops, are published under this
series. Unless otherwise indicated, the views expressed are attributable only to the author(s), not to CREI nor to any institutions of affiliation.
CREI
Centro di Ricerca
Interdipartimentale
Forced Manager Turnovers in English Soccer Leagues:
A Long-Term Perspective
∗
Stefano d’Addona
†Axel Kind
‡November 30, 2011
Abstract
We conduct an empirical analysis of a hand-collected sample of 2,376 turnovers of soccer managers in the four major English leagues in the seasons from 1949/50 to 2007/08. While the relation between the probability of a manager being fired and long-term performance remained remarkably stable, both the absolute frequency and the sensitivity of firing decisions on the outcome of recent matches steadily and significantly increased during the six decades covered by our sample. This is likely to reflect the increased level of competition in and economic importance of the English soccer leagues.
Keywords: Managers’ Turnover; Firing Decision; Governance Mechanisms; Logit Models, Du-ration Models
JEL codes: G30; M51
∗We thank David Offenberg and participants at the 2009 Financial Management Association Meetings in Reno
and the Research Seminar of the University of Rome 3 for their very helpful comments. Moreover, we would like to thank Marco Poltera for his excellent research assistance.
†Department of International Studies, University of Rome 3, Via G. Chiabrera, 199, I-00145 Rome;
+39-06-5733-5331; [email protected]
‡Department of Finance, University of Basel, Peter Merian-Weg 6, CH-4002 Basel; +41-61-267-3310;
Forced Manager Turnovers in English Soccer Leagues:
A Long-Term Perspective
Abstract
We conduct an empirical analysis of a hand-collected sample of 2,376 turnovers of soccer managers in the four major English leagues in the seasons from 1949/50 to 2007/08. While the relation between the probability of a manager being fired and long-term performance remained remarkably stable, both the absolute frequency and the sensitivity of firing decisions on the outcome of recent matches steadily and significantly increased during the six decades covered by our sample. This is likely to reflect the increased level of competition in and economic importance of the English soccer leagues.
1
Introduction
The threat of firing a manager is a powerful mechanism for aligning the interests of managers with those of investors, thereby increasing the performance of an organization, be it a corporation or a sports team. In particular, the threat of being fired due to bad performance ensures adequate effort by the incumbent manager. Furthermore, monitoring managers’ performance may provide a better understanding of the level of their skills and enable the board to replace a low-performing manager with a better one. The large majority of papers in the field of corporate governance (see Section 2.1) and sports economics (see Section 2.2) are indeed able to show that the past performance of an organization is significantly related to the probability of its leading manager being fired.
This paper studies the performance sensitivity of firing decisions in English soccer teams, with a particular focus on its long-term development. The four major English soccer leagues have expe-rienced considerable development in the last decades in terms of revenues, salaries, transfer sums, and media coverage. For example, Deloitte (2009) reports average annual revenue growth rates1
since the 1991/92 season of 16.4%, 11.6%, 10.6, and 9.2%, respectively, for teams in the four major English soccer leagues—Premier League, Championship, League 1, and League 2. These figures
1
Revenues are classified in four categories depending on their source: Matchday, Broadcast, Sponsorship, and Other Commercial.
are particularly impressive when compared to the much lower annual nominal UK gross domestic product growth of 5.4% over the same time period. However, as noted in Deloitte (2009), English soccer is also characterized by a high level of entrepreneurial competition: “Despite the increases in revenue, the fiercely competitive nature of the league has seen potential profits quickly competed away, with operating margins falling from 16% to 10%” (p. 2). This raises the question of whether the increased economic importance of English soccer and its fiercer competition are also reflected in the performance pressure exercised on managers via the threat of firing.
This paper contributes in two ways to the existing literature. First, to the best of our knowl-edge, this study is the most comprehensive empirical investigation so far of manager turnovers in sports teams in terms of numbers of (forced) manager turnover events and match data used for the construction of the performance variables. The sample comprises a complete set of 2,376 manager turnovers in the four major English soccer leagues. Out of these, 1,213 are classified as firings of regular managers.2 The construction of the performance variables is based on the outcome of
119,555 soccer matches.
Second, this paper focuses on the existence of time period differences and long-term trends in the performance sensitivity of firing decisions, an aspect that has never been systematically studied in the field of sports economics. The sample used in this study is particularly well suited for in-vestigating this research question because it is comparatively long, spanning six decades, from the 1949/50 season to the 2007/08 season.
As argued by other authors (see, e.g., Audas, Dobson, and Goddard, 1997, 1999), studying the performance sensitivity of manager turnovers in sports teams is appealing because of the possi-bility of constructing simple, reliable, and uncontroversial performance measures based on match outcomes. Match-based performance measures have decisive advantages over traditional market-based and accounting-market-based measures. First, they are free from the forward-looking problem of
2
In contrast to the majority of studies, we distinguish between regular managers and caretakers. In our view, this distinction is important because caretakers only take temporary charge of the management of a club when a regular manager is ill or abruptly leaves the club. From a corporate governance perspective, caretakers are comparable to interim chief executive officers (CEOs), which are often excluded from turnover studies because of their temporary management role (e.g., Furtando and Rozeff, 1987).
market-based measures which tend to anticipate the occurrence of a manager turnover. Second, the frequency of the performance signal is (at least) weekly, and not quarterly or annual, as in the case of accounting data. This allows one to test the performance–turnover relation in a close time frame around the turnover event. Third, match-level performance measures are free of ma-nipulation biases because managers have generally no reason to artificially alter the outcome of a game. On the contrary, the general consensus in the related literature is that both departing and incoming CEOs of public companies have the incentives and means to manipulate accounting data in correspondence with the beginning and end of their appointments (see, e.g., Pourciau, 1993).3
This paper employs discrete-choice logit models and proportional hazard models to detect the determinants of manager firings in English soccer. While the main focus of the paper is on (the evolution of) the relation of firing decisions and managerial performance, all regressions include a number of control variables related to the team position, the time period within the season, as well as variables capturing the individual characteristics of managers, such as age and prior experience as team coach and former soccer player.
In accordance with economic intuition and empirical evidence of previous papers, the proba-bility of a manager being fired is found to be negatively related to both short-term and long-term managerial performance. Interestingly, while the relation between the firing probability and long-term performance has remained remarkably stable, the absolute firing probability and its sensitivity toward the outcome of recent matches (short-term performance) has steadily and significantly in-creased over time. The fact that nowadays soccer managers are fired more frequently and their jobs depend to a larger extent on the outcome of recent matches indicates that they are confronted with stronger short-term monitoring and that the governance mechanism of the firing threat has gained importance. In general, these findings seem to comply with the increased level of economic importance and competition in English soccer. Furthermore, the probability of being sacked is found to be (all else being equal) higher for older managers and less-experienced ones. The latter
3
Departing CEOs typically increase reported earnings in a last attempt to keep their position. On the other hand, newly appointed CEOs tend to lower reported earnings to credit the predecessor with poor performance and take credit for the subsequent increase in performance.
result is interesting on its own because previous studies could not detect any significant impact of experience variables on turnover probabilities. Finally, managers of teams in relegation positions are found to face a higher probability of getting fired. The combination of this observation with the fact that manager firings seem to trigger lower mean performance but higher variance (see Audas, Dobson, and Goddard, 2002) supports the hypothesis that owners of teams in relegation positions tend to play a gambling for resurrection game.4
The paper is structured as follows. Section 2 provides a detailed literature review on the de-terminants of manager turnover rates. Section 3 describes the sample construction and the set of explanatory variables. The empirical findings are presented and discussed in Section 4. Finally, Section 5 concludes with a summary of the main results of the paper.
2
Related Literature
2.1
CEO Turnovers in Corporations
Firing a CEO is one of the most drastic decisions to be made by the board of directors of a company. Not surprisingly, academics in the field of corporate governance have devoted considerable research resources to study different aspects of this decision. This section provides an overview of the most important empirical contributions in this field of research. The rich body of papers that investigate the turnover of executive managers can be classified along several dimensions. A first distinction concerns the broad research focus: Some papers mainly investigate the determinants of manager turnovers (see Table 1), others study their consequences on firm performance (e.g., Denis and Denis, 1995; Furtando and Rozeff, 1987; Huson, Malatesta, and Parrino, 2004; Kang and Shivdasani, 1996; Kind and Schl¨apfer, 2011), and still others deal with both research questions (e.g., Ertugrul and Kr-ishnan, 2011; Warner, Watts, and Wruck, 1988; Weisbach, 1988). A second distinction concerns the entities for which the manager turnovers are considered: industry corporations (see, e.g., Coughlan and Schmidt, 1985; Warner, Watts, and Wruck, 1988; Weisbach, 1988; Parrino, 1997), banks (Barro
4
and Barro, 1990), or sport teams (see the next subsection). The most important empirical findings (see Brickley, 2003, for a summary of the literature) can be summarized as follows.
First, the majority of studies find a negative and statistically significant relation between
Table 1: Literature Overview on Manager Turnovers in Corporations
This table summarizes the most important publications that investigate the determinants of manager turnovers in corporations. ‘Performance Measure’ refers to the type of measures used to capture managerial performance: SA and SR indicate absolute and relative (i.e., corrected for market and/or
industry effects) stock returns, respectively. Similarly,ROAAand ROARdenote the absolute and relative
(i.e., adjusted for market and/or industry effects) returns on assets, andEAand ER denote absolute and
relative earnings yields (earnings per share over share price), respectively. ‘Success.’ indicates the total number of turnovers considered in the empirical analysis, while ‘Dismiss.’ denotes the number of forced conversions present in the sample, and ‘–’ means that no explicit distinction is made between forced and voluntary turnovers.
Authors (year) Performance Country Sample Success. Dismiss.
Measure Period
Barro and Barro (1990) EA,ER USA 1982–1987 60 –
Bushman, Dai, and Wang (forth.) SA, SR, ROAA USA 1992–2005 1,823 794
Coughlan and Schmidt (1985) SA,SR USA 1977–1980 76 –
DeFond and Park (1999) SA,SR USA 1988–1992 301 –
Engel, Hayes, and Wang (2003) SA,SR USA 1975–2000 1,330 171
Farrell and Whidbee (2003) SR, ROAR USA 1986–1997 363 86
Jenter and Kanaan (2011) SA,SR USA 1993–2001 1,590 384
Huson, Parrino, and Starks (2001) SR, ROAR USA 1971–1994 1,316 213
Kaplan (1994) SA, ROAA Germany 1981–1989 46 –
Parrino (1997) SR, ROAR USA 1969–1989 977 127
Warner, Watts, and Wruck (1988) SA,SR USA 1963–1978 567 102
Weisbach (1988) SA USA 1974–1983 286 –
performance measures and the probability of a forced turnover (see Coughlan and Schmidt, 1985; Warner, Watts, and Wruck, 1988; Weisbach, 1988, among many others).
Second, the negative relation between stock performance and turnover probability is more pro-nounced when (i) the board is dominated by outside directors (Weisbach, 1988), (ii) the successor is a firm outsider (Parrino, 1997), (iii) the industry is homogeneous (Parrino, 1997), (iv) the competi-tion in the relevant industry is high (DeFond and Park, 1999), (v) the precision of the performance signal is high (Engel, Hayes, and Wang, 2003), and (vi) the board is small (Yermack, 1996).
Third, performance measures based on deviations from boards’ expectations (e.g., earnings de-viations relative to analyst forecasts) seem to provide a better empirical fit in explaining firing decisions (Farrell and Whidbee, 2003).
Fourth, the absolute probability of a dismissal as well as its performance sensitivity should in-crease with idiosyncratic risk and dein-crease with systematic risk (Bushman, Dai, and Wang, forth.). Huson, Parrino, and Starks (2001) is the corporate governance paper with the closest link to ours. The authors analyze the development of CEO firings in US corporations from 1971 to 1994 and conclude that the performance sensitivity of CEO firings has not changed significantly from the beginning to the end of the sample period, in spite of a general improvement of the governance structure of companies and an increase over time in forced turnover frequency.
2.2
Manager Turnovers in Sports Teams
While most empirical studies that investigate the determinants of managerial turnovers focus on large corporations and rely either on accounting- or market-based performance measures, an es-tablished and growing strand of literature deals with managerial changes in the context of team sports. Studying the determinants of managerial turnover in team sports is particularly appeal-ing because of the availability of large, accurate, and transparent data on managerial change and team performance. As noted by several authors (see, e.g., Audas, Dobson, and Goddard, 1997, 1999), the possibility of constructing simple performance measures based on match outcomes is particularly valuable. First, match-based performance measures are free from the forward-looking bias of market-based measures, such as (abnormal) stock returns, that tend to anticipate man-ager turnovers. Second, match-level performance signals are observed at a higher frequency than quarterly or annual accounting-based measures. This allows one to test the performance–turnover relation in a closer time frame around the turnover event. Third, match-level performance measures are free of manipulation biases: Managers have neither the means nor the incentives to artificially alter the output of a game. This is different from earnings-based performance measures which tend to be prone to “creative accounting.”
Table 2 provides a list of important papers that study the determinants, and thus the per-formance sensitivity, of manager firings in team sports. The methodology for studying the de-terminants of manager turnover ranges from descriptive statistics, correlation analysis, and linear probability regressions (Allen, Panian, and Lotz, 1979; Audas, Dobson, and Goddard, 1997; Fizel and d’Itri, 1997) to discrete-choice models (logit/probit regressions) (Forrest and Tena, 2007; Mixon and Trevino, 2004) and duration models (Audas, Dobson, and Goddard, 1999; Audas, Goddard, and Rowe, 2006; Barros, Frick, and Passos, 2008; Kahn, 2004). While a complete review of those studies is beyond the scope of this paper, several established facts arising from the existing research are worth mentioning. Since the number of observations used in the empirical analysis is likely to play a critical role in identifying the importance and significance of explanatory variables, in the following summary greater weight is given to studies relying on large samples.
First, manager turnovers in sports teams are characterized by a higher turnover frequency and a larger share of forced turnovers compared to the world of corporations. For example, Audas, Dob-son, and Goddard (1999) identify 82.7% of a sample of 1,058 manager turnovers between 1972/73 and 1999/2000 in the four English soccer leagues as involuntary manager changes. This is in striking contrast to the 16.2% of forced turnovers in a sample of 1,316 CEO turnovers at large US public firms between 1971 and 1994 (Huson, Parrino, and Starks, 2001).
Second, the majority of studies (e.g., Allen, Panian, and Lotz, 1979; Audas, Dobson, and God-dard, 1999; Barros, Frick, and Passos, 2008; Kahn, 2004; Salomo and Teichmann, 2000) provide evidence that manager firings in teams sports are strongly linked to past performance as measured by (recent) match outcomes. For instance, Audas, Dobson, and Goddard (1999) show that in their sample of manager turnovers in English soccer the results of up to the last nine matches are sig-nificantly related to the occurrence of manager firings, with more recent matches having greater explanatory power, on average.
Third, individual manager characteristics related to past experience as either player or manager do not seem to affect, all else being equal, the probability of being fired (see Audas, Dobson, and Goddard, 1999; Audas, Goddard, and Rowe, 2006).
Fourth, racial differences do not seem significantly related to firing decisions (Kahn, 2004; Mixon and Trevino, 2004).
Finally, it is important to note that, to the best of our knowledge, no paper in sports economics has so far systematically analyzed the development over time of the performance sensitivity of fir-ing decisions. Audas, Dobson, and Goddard (1999) document, however, a statistically significant increase over time in the absolute number of firings.
Table 2: Literature Overview on Manager Turnovers in Sports
This table summarizes the most important publications that investigate the determinants of manager turnover in sports teams. ‘Success.’ indicates the number of turnovers considered in the empirical analysis, ‘Dismiss.’ denotes the number of forced conversions present in the sample, and ‘–’ means that no explicit distinction is made between forced and voluntary turnovers.
Authors (year) Sport Country Sample Success. Dismiss. Period
Panel A: Studies of Manager Turnovers in Soccer Teams
Audas, Dobson, and Goddard (1997) Soccer England 1972–1993 633 – Audas, Dobson, and Goddard (1999) Soccer England 1972–1997 826 699 Bachan, Reilly, and Witt (2008) Soccer England 2001–2004 N.A. N.A. Barros, Frick, and Passos (2008) Soccer Germany 1981–2003 190 190 Frick, Barros, and Prinz (2009) Soccer Germany 1981–2003 142 115 Salomo and Teichmann (2000) Soccer Germany 1979–1998 194 – Forrest and Tena (2007) Soccer Spain 2002–2005 20 20
Panel B: Studies of Manager Turnovers in Other Sports
Allen, Panian, and Lotz (1979) Baseball USA 1920–1973 934 – Audas, Goddard, and Rowe (2006) Ice Hockey USA 1967–2002 369 – Borland and Lye (1996) Football Australia 1931–1994 219 – Fizel and d’Itri (1997) Basketball USA 1984–1991 147 100
Kahn (2004) Basketball USA 1996–2003 60 41
3
Data
3.1
Sample Construction
This paper analyzes the complete set of manager turnovers in the four major English soccer leagues from the beginning of the 1949/50 season until the end of the 2007/08 season. An initial sample of complete manager histories corresponding to each of the 92 teams currently playing in any of the four major soccer leagues is obtained from SoccerBase5, an Internet portal that provides a wide
range of statistics related to soccer. To avoid survivorship biases, this initial sample is extended to consider the manager histories of 17 teams that played in any of the four major leagues during the time period covered by our sample. Manager histories for these additional 17 teams are ob-tained and cross-checked using a variety of Internet sources, such as teams’ official Internet pages, fan pages, Internet soccer portals6, Wikipedia pages dedicated to either teams or managers, and
on-line newspapers and broadcasters, such as the BBC,The Guardian,The Independent,The Daily Telegraph, or The Times.7 The above-mentioned Internet sources are also used to cross-check the
turnover dates of the initial sample and to collect manager characteristics, such as age and relevant soccer experience as a player.
Additionally, we collect three categories of data: (i) performance data, (ii) individual manager data, and (iii) manager turnover data. Performance is measured by the on-field performance of a team and requires information on the date of each soccer game, the teams playing (home and away), their scores, and the league in which they play. Manager data include manager character-istics, such as age, prior appointments as club manager, and experience as a player in the team currently managed or in a national soccer team. Turnover data comprise the exact date of the succession as well as its nature, that is, whether it was forced or voluntary.
5
http://www.soccerbase.com.
6
See, for example,http://www.4thegame.comor http://www.talkfootball.co.uk. 7
The Internet addresses corresponding to the online newspapers and broadcasters arehttp://news.bbc.co.uk,
http://www.guardian.co.uk, http://www.independent.co.uk/, http://www.timesonline.co.uk, and
3.2
Forced versus Voluntary Turnovers
The identification of whether a manager was fired or not8 deserves particular attention, because
this information is seldom correctly disclosed by companies (Weisbach, 1988) and sometimes not even critically discussed in the media (Warner, Watts, and Wruck, 1988). In fact, it is very likely that both parties (the board as the principal and the manager as the agent) have an interest in letting a dismissal appear to be a consensual agreement. To minimize the risk of misclassification, we adopt the following procedure.
Manager changes within the regular season are, in general, treated as sacking, unless we find evidence that the manager left the team for any of the following reasons: (i) new appointment in a more prestigious team, (ii) illness, or (iii) tragic circumstances, such as death, the illness of a family member, and others.9
Manager changes during theoff-season are, in general, treated as voluntary successions, unless we find evidence that the manager was forced to leave the team. We reclassify a turnover during the off-season from voluntary to forced if it is clearly described as such in news articles commenting on the event or if any of the following circumstances apply to the succession: (i) The manager leaves the team and retires before the age of 60, (ii) there is still a valid contract between the manager and the team at the time of the succession, or (iii) the manager leaves the team and starts managing a less prestigious soccer team, for example, one in a lower division.
3.3
Sample Description
The total sample includes 2,376 manager turnovers. While in 425 of those turnovers the depart-ing manager is a caretaker, the other 1,951 cases involve a regular manager. Since caretakers are appointed to manage the team for a short period of time, often as the consequence of the sudden dismissal of a regular manager, we exclude them from the analysis. Out of the 1,951 turnovers of
8
For simplicity, this paper defines all turnovers that are not induced by an explicit decision of the board as voluntary turnovers. However, to be precise, some of these so-called voluntary turnovers may be due to circumstances unrelated to managers’ decisions, such as the death or illness of the manager or one of his relatives.
9
Since Wikipedia pages are likely to be subject to manipulation, we do not rely on them when searching for possible reasons to rule out a dismissal.
regular managers, 1,213 are classified as firings. As a matter of comparison, the manager succession samples studied in Engel, Hayes, and Wang (2003), Huson, Parrino, and Starks (2001), and Parrino (1997) include 171, 213, and 127 dismissals, respectively. Even in the field of sports economics, the analysis with the largest data sample is Audas, Dobson, and Goddard (1999), with 699 firings. In addition, the percentage of forced departures in our sample is, with 62.2%, much higher than the analogous percentages reported for corporations (between 12.8 and 16.2% in the papers mentioned) but lower than the 84.62% reported for English soccer teams by Audas, Dobson, and Goddard (1999) and the 79.31% reported for Bundesliga soccer teams by Frick, Barros, and Prinz (2009).
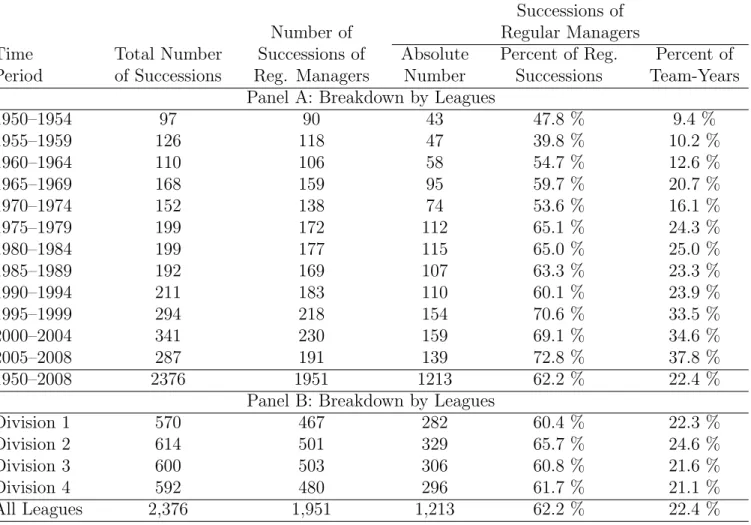
Table 3 presents statistics related to the turnovers in our sample. Overall, all four leagues con-sidered display a remarkably homogeneous picture with respect to the numbers of turnovers and dismissals. Based on the numbers reported in Panel B of Table 3, the unconditional probability of observing the dismissal of a regular manager during one season lies between 21% and 25% in any of the four leagues. However, Panel A of Table 3 shows that both the numbers of turnovers and dismissals have increased (although not monotonically) over the years. Moreover, the percentage of forced turnovers has risen significantly over time, which is in line with the findings of Huson, Par-rino, and Starks (2001) for corporations between 1971 and 1994 and the results of Audas, Dobson, and Goddard (1999) for soccer teams between 1972 and 1997. In the overall sample, the average seasonal probability of being fired is 22.4%, which translates to an average survivor time ofn = 2.73 seasons, where n solves (1−[1−0.224]n = 0.5).
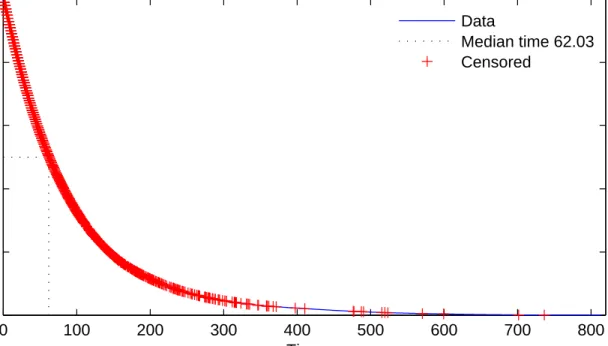
Figure 1 shows the fraction of managers (y-axis) that did not get fired before a given number of weeks (x-axis). It refers to complete manager spells, that is, regular managers that started managing a team after August 1949 and got fired before May 2008. As indicated in Figure 1, the median manager survived 62.2 weeks before being sacked, which corresponds to less than two (40-week) seasons and slightly more than one-and-a-half seasons (62.2/40 = 1.56). The fact that the median survivor time (1.56 seasons) is much shorter than the average survivor time (2.73 seasons) is due to the strong skew of spell durations (see Figure 2). For instance, Matt Busby was manager
Table 3: Statistics on Manager Turnover
This table reports statistics related to the turnover of managers in the four major English soccer leagues during the seasons from 1949/50 to 2007/08. ‘Total Number of Successions’ reports the total number of manager changes, which includes regular managers and caretakers. ‘Number of Successions of Reg. Managers’ reports solely the number of firings related to regular managers, that is, excluding caretaker managers. With respect to ‘Forced Successions of Regular Managers’, that is, firings (forced turnovers) of regular managers, this table provides three figures: (i) ‘Absolute Number’ indicates the number of firings of regular managers, (ii) ‘Percent of Reg. Successions’ indicates the percentage of firings of regular managers as a percentage of all turnovers of regular managers, and (iii) ‘Percent of Team– Years’ indicates the average frequency of a firing of a regular manager per team and per year.
Forced Successions of Number of Regular Managers
Time Total Number Successions of Absolute Percent of Reg. Percent of Period of Successions Reg. Managers Number Successions Team-Years
Panel A: Breakdown by Leagues
1950–1954 97 90 43 47.8 % 9.4 % 1955–1959 126 118 47 39.8 % 10.2 % 1960–1964 110 106 58 54.7 % 12.6 % 1965–1969 168 159 95 59.7 % 20.7 % 1970–1974 152 138 74 53.6 % 16.1 % 1975–1979 199 172 112 65.1 % 24.3 % 1980–1984 199 177 115 65.0 % 25.0 % 1985–1989 192 169 107 63.3 % 23.3 % 1990–1994 211 183 110 60.1 % 23.9 % 1995–1999 294 218 154 70.6 % 33.5 % 2000–2004 341 230 159 69.1 % 34.6 % 2005–2008 287 191 139 72.8 % 37.8 % 1950–2008 2376 1951 1213 62.2 % 22.4 %
Panel B: Breakdown by Leagues
Division 1 570 467 282 60.4 % 22.3 %
Division 2 614 501 329 65.7 % 24.6 %
Division 3 600 503 306 60.8 % 21.6 %
Division 4 592 480 296 61.7 % 21.1 %
All Leagues 2,376 1,951 1,213 62.2 % 22.4 %
of Manchester United for more than 24 years. On the other extreme, Kevin Cullis was appointed manager of Swansea on February 8, 1996, but was fired only six days later.
Figure 1: Kaplan–Meier Survival Function
This figure shows the Kaplan–Meier survival function estimated on all 1,173 forced turnovers of regular managers in the four major
English soccer leagues during the seasons from 1949/50 to 2007/08.
0 100 200 300 400 500 600 700 800 0 0.2 0.4 0.6 0.8 1
Estimated Survival Function
Time
Data
Median time 62.03 Censored
3.4
Explanatory Variables
According to economic theory, the most important variable in explaining firing decisions should be the manager’s performance. In this paper, we construct two measures of managerial performance that have been widely used in the related literature (see, e.g., Audas, Dobson, and Goddard, 1999). The variable PERFSHORT captures the short-term performance of a manager and focuses on the most recent history of match outcomes. It measures the ratio of points obtained out of all points attainable in a certain period. To calculate PERFSHORT, we attribute a value of 0, 12, or 1 to each match, depending on whether the match result was a loss, draw, or win, respectively. PERFSHORT represents the average of those values for all matches played in a two-week window10
10
The two-week window is chosen arbitrarily to capture the impact of recent match results on the turnover prob-ability. However, the main results of the paper do not change qualitatively if shorter or longer time periods are considered. In particular, tests conducted on one- and four-week event windows do not alter the main findings.
Figure 2: Distribution of Spell Durations: Forced Turnovers
This figure shows the distribution of spell durations in weeks of all 1,173 complete spells of regular managers ended by a forced turnover
in the four major English soccer leagues during the seasons from 1949/50 to 2007/08.
0 20 40 60 80 100 120 140 160 0 20 40 60 80 100 120 Duration
Frequency of Forced Turnovers
preceding the current week. To cope with the rules of three points for a win11 (three and not two
points for a victory, one point for a draw, and no points for a loss) and work with a consistent performance measure (percentage of points obtained by the team in a given period), starting from the 1982 season we attribute to each match a value of 1
3 (and not 1
2) for a draw. While we prefer
this solution, attributing a value of 1
2 to all draws in the sample (as done in Audas, Dobson, and
Goddard, 1999) does not alter our findings.
Table 4 reports descriptive statistics of the variables characterizing managers. Its three panels differ with respect to the time (frame) considered: At the beginning of the spell (Panel A), during the spell (Panel B), and at its end (Panel C). To make the interpretation easier, the descriptive statistics of PERFSHORT refer to the two points for a win version of this variable applied to the whole sample. Not surprisingly, the average performance across all managers and weeks (Panel A)
11
The purpose of the three points for a win rule was to increase the incentives of a victory and thereby encourage more spectacular attacking play.
is very close to 0.5. While at the beginning of a manager’s spell PERFSHORT is not meaningful (and thus not reported), at the end of the spell (Panel C) it has an average value of 0.369, which indicates below-average performance before a turnover.
The variable PERFLONG captures a manager’s long-term performance. It counts the number of positions won (or lost) by the current manager since he12 took the lead of the team. Following
Audas, Dobson, and Goddard (1999), to account for promotions and relegations, team positions are defined across all four leagues, thus assuming values from one to 92.13 Positive integers for
PERFLONG indicate an improvement of the initial position, and negative integers a deterioration. The fact that the frequency of turnovers may differ across leagues is captured by three dummy variables that indicate participation to The Championship (DDIV2), League One (DDIV3), and League Two (DDIV4). The Premier League represents the reference category.14
Clearly, the decision to fire a manager may be related to individual characteristics. The following describes a set of individual variables used as regression covariates. The variable AGE measures the age of a manager (in years) at the time of appointment. The average age of a manager in the sample is 43.8 years (Table 4, Panel A). On average, a manager begins his spell at the age of 42.4 years (Table 4, Panel B) and ends it at 44.8 (Table 4, Panel C). Clearly, the age difference roughly reflects the average duration of a managerial spell. The youngest manager ever appointed was Billy Gray, who started as player-manager of Millwall when he was 25 years old. In our sample, the oldest manager ever appointed was Frank Buckley, who started as manager of Walsall at the age of 70. The number of data points is lower than 1,951 because it was not possible to obtain the birth dates for some managers.
The variable EXP measures the years of prior managerial experience at the beginning of the spell in English soccer teams. Thus, EXP does not increase as the spell duration of a manager
12
By using male pronouns, we do not intend to discriminate against possible female managers; however, all man-agerial spells analyzed in this paper refer to male managers.
13
The only season in which 91 and not 92 teams participated in the four major leagues was 1961/62, because Accrington Stanley did not complete the season due to financial difficulties.
14
The categorization into four divisions is kept throughout the sample, although the names of the four divisions as well as the number of teams playing in each of them have changed on several occasions. Currently, the Premier League has 20 teams and The Championship, League One, and League Two have 24 teams each.
increases. Since we only measure experience in the English soccer leagues, EXP may not capture important manager experience gained in foreign leagues. EXP varies widely from zero (no prior experience) to 24.65.
The terms DIN and DNTL indicate two dummy variables that measure the experience and merits of a manager as former soccer player, respectively. The variable DNTL indicates whether a manager has experience as a soccer player in a national soccer team and DIN indicates whether he has played as a soccer player in the same team he is now managing. In our sample, approximately 34% of all appointed managers have prior experience as soccer players in a national team and 33.5% played in the team they now manage. One would expect that, in both cases, higher credits are given to such managers, which would result, all else being equal, in a lower probability of being sacked.
In England, supporters’ trusts are characterized by an interesting governance structure. A supporter trust is a not-for-profit organization of fans who attempt to strengthen their influence over the running of the club they support through democratic supporter ownership. To test whether supporters’ trusts influence firing behavior, we consider as an explanatory variable of turnover decisions the dummy variable DTRUST.
The variable DRELEG is a dummy variable that assumes a value of one if a club is in a relegation position, and zero otherwise. Since relegation is a particularly adverse outcome, firing decisions in relegation-threatened teams may be more or less frequent. In constructing DRELEG, we make sure to account for the exact relegation rules of each league each season.
Finally, DSUB1 to DSUB5 are dummy variables that identify five equally spaced sub-periods within each season. Including these time period variables as regressors accounts for the fact that manager turnover decisions may be more or less likely depending on the remaining duration of the season.
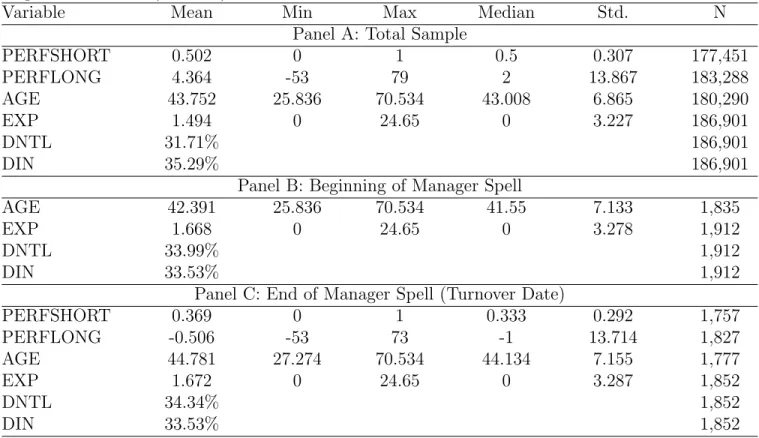
Table 4: Descriptive Statistics of Manager-Related Variables
This table reports descriptive statistics of manager-related variables used to explain turnover. These variables include performance variables (PERFSHORT, PERFLONG) and individual manager characteristics (AGE, EXP, DNTL, DIN). Panels A through Panel C differ with respect to the time (frame) considered. Panel A considers all team–weeks in the sample. Panel B measures the variables at the beginning of the manager spell and Panel C considers the variables at the end of the spell (turnover date). The variable AGE measures the age of the manager (in years) at the beginning of his appointment; TENURE measures the total duration of the appointment; DNTL is a dummy variable that assumes a value of one if the manager has played as a soccer player in a national soccer team, and zero otherwise; and DIN is a dummy variable that assumes a value of one if the manager has played as a soccer player in the team he is now managing, and zero otherwise. The data used in this table refer to the turnover of managers in the four major English soccer leagues during the seasons from 1949/50 to 2007/08.
Variable Mean Min Max Median Std. N
Panel A: Total Sample
PERFSHORT 0.502 0 1 0.5 0.307 177,451 PERFLONG 4.364 -53 79 2 13.867 183,288 AGE 43.752 25.836 70.534 43.008 6.865 180,290 EXP 1.494 0 24.65 0 3.227 186,901 DNTL 31.71% 186,901 DIN 35.29% 186,901
Panel B: Beginning of Manager Spell
AGE 42.391 25.836 70.534 41.55 7.133 1,835
EXP 1.668 0 24.65 0 3.278 1,912
DNTL 33.99% 1,912
DIN 33.53% 1,912
Panel C: End of Manager Spell (Turnover Date)
PERFSHORT 0.369 0 1 0.333 0.292 1,757 PERFLONG -0.506 -53 73 -1 13.714 1,827 AGE 44.781 27.274 70.534 44.134 7.155 1,777 EXP 1.672 0 24.65 0 3.287 1,852 DNTL 34.34% 1,852 DIN 33.53% 1,852
4
Results
4.1
Explaining Manager Turnovers
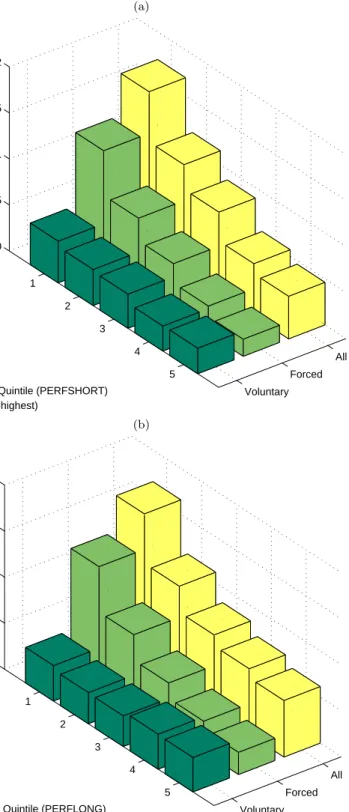
To get a first flavor of the performance sensitivity of firing decisions, we graph in Figure 3 the annu-alized weekly frequency of firings, unforced turnovers, and all manager turnovers in dependence of short-term performance, PERFSHORT (Figure 3a) and long-term performance, PERFLONG (Fig-ure 3a). The negative relation between both short-term and long-term performance and turnover
frequency is evident and particularly pronounced for firing decisions. This first result is consistent with economic theory and findings in the empirical corporate governance literature (see Coughlan and Schmidt, 1985; Huson, Parrino, and Starks, 2001; Warner, Watts, and Wruck, 1988; Weisbach, 1988, and others), as well as established papers in sports economics (see Allen, Panian, and Lotz, 1979; Audas, Dobson, and Goddard, 1999; Barros, Frick, and Passos, 2008; Kahn, 2004; Salomo and Teichmann, 2000).
To model managerial turnovers, we adopt three models: (i) a logit model with fixed effects, (ii) a logit model with random effects, and (iii) a duration model with a time-varying baseline hazard rate. The parallel estimation of three models ensures the robustness of the results. The first two models assume that the probability of a manager change can be expressed as a logistic function of a set of covariates: prob(yi,t = 1) = exp (β′ xi,t+α′zi,t) 1 + exp (β′ xi,t+α′zi,t) , (1)
where yi,t assumes a value of one if a given manager i leaves a club in a given time period t,
and zero otherwise; xi,t is a vector of explanatory variables with corresponding coefficients β; and
zi,t is a vector containing a constant term and a set of (unobserved) group-specific effects with
corresponding coefficientsα.
To estimate the above model, we employ two empirical counterparts. The first one is a fixed-effects model (LOGIT Fixed Effects), in which the group-specific fixed-effects are assumed to be correlated with the explanatory variables:
d prob(yi,t = 1) = exp (β′ xi,t +αi) 1 + exp (β′x i,t+αi) +ǫi,t, (2)
where αi =α′zi,t collects all the groups-specific effects in a constant term and ǫ is an independent
and identically distributed normal error term, ǫ∼N(0, σǫ2).
The second empirical counterpart of Equation 1 is a random-effects model (LOGIT Random Effects): d prob(yi,t = 1) = exp (β′ xi,t+α+ui) 1 + exp (β′x i,t+α+ui) +ǫi,t. (3)
Figure 3: Turnover Frequency and Performance
This figure shows three histograms, of weekly frequency, of voluntary, forced, and total turnovers in different (a) short-term and (b) long-term performance quintiles. The data used in this figure refer to the turnover of managers in the four major English soccer leagues during the seasons from 1949/50 to 2007/08.
(a) Voluntary Forced All 1 2 3 4 5 0 0.5 1 1.5 2
Performance Quintile (PERFSHORT) (1=lowest, 5=highest)
Frequency of Turnovers (in %)
(b) Voluntary Forced All 1 2 3 4 5 0 0.5 1 1.5 2
Performance Quintile (PERFLONG) (1=lowest)
This model assumes zero correlation between the group-specific effects and the covariates, where
ui ∼N(0, σu2i) is a group-specific random element andǫi,t ∼N(0, σ 2
ǫ) is an independent and
identi-cally distributed normal error term.
As pointed out by Jones and Branton (2005), logit models can lead to potential biases derived from the specific parametric assumption needed. To overcome this problem, we also use the propor-tional hazard model (HAZARD) introduced by Cox (1972), which is a semi-parametric specification within the family of duration models.15 The hazard rate16 is defined as
λ(ti) = exp (−x
′
iβ)λ0(ti), (4)
whereλ0(ti) is the baseline hazard function that collects the group-specific heterogeneity and xi is
a vector of explanatory variables.
The estimation of the three models is conducted using weekly data. Every season is subdivided into the number of weeks from the beginning to the end of the season, thus from 37 to 42 weeks, with an average of 39.7 weeks in our sample.17 All three models only use the weekly data points of
managers who start coaching a team within the sample period (1950–2008). For the proportional hazard model, this choice is naturally dictated by the need to observe the overall length of the managerial spell. In the two logit models, the use of managerial spells starting after the beginning of the sample derives from the inclusion of the long-term variable PERFLONG, which is not available for managers starting their spell before the 1950 season. A first upward-biased estimate of the total number of data points N used in the estimations results from the total number of team×week observations: 92 (# of teams per season) × 59 (# of seasons) × (40+1) (# of periods per year). Deviations from this number are due to incomplete manager spells (spells beginning before the 1950 season or spells not ended as of August 1, 2008) or missing values of any of the dependent variables,
15
A review of duration models and related estimation techniques is provided in Kiefer (1988) and Chapter 22 of Greene (2002).
16
In this class of models the hazard rate is defined as the rate at which spells are completed after durationt, given that they last at least untilt.
17
The summer break is considered an additional period. The fact that the number of manager turnovers is likely to be higher during the summer break is accounted for by the presence of the dummy variable DSUMMER.
for example, if no game was played during a certain week.
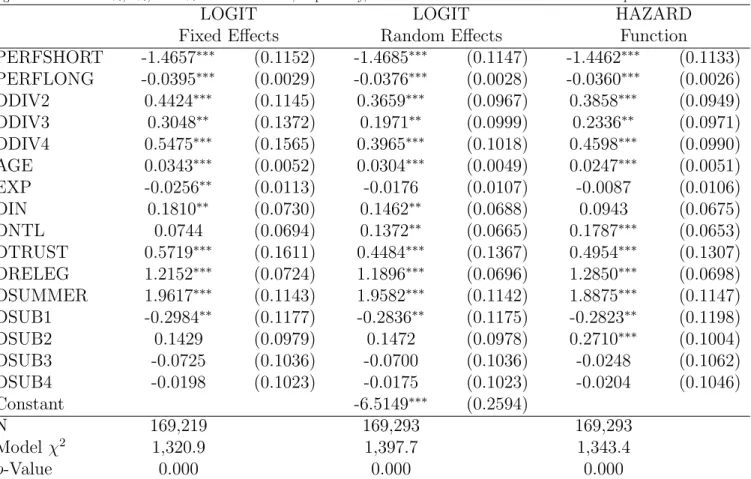
Table 5 shows the regression results of the three models used to explain the probability of forced manager turnovers. In general, the χ2 test statistics are highly significant and indicate that the
regressions are well specified when compared to the simple benchmark of a constant-probability model.
The probability of a manager being fired is negatively related to both short-term and long-term managerial performance. This result is highly significant for all three model specifications and reinforces existing evidence obtained in the same soccer leagues by Audas, Dobson, and Goddard (1999). To put the results into perspective, we report in Table 6 the estimated firing probabilities for selected quantiles of PERFSHORT (highest decile, median, and lowest decile) of an average manager, that is, a manager with average characteristics with respect to the remaining explanatory variables.
Annual turnover probabilities are obtained from the estimated weekly turnover probability, PE,
as follows:
PA= 1−(1−PE)n, (5)
where n is the average number of weeks in one season, that is, about 40. The annual turnover probability is calculated as one minus the annual survivor probability. On average, a manager in the top performance decile faces a 6.8% probability of being fired during a given season. However, the firing probability rises to 26.2% if his performance is in the bottom decile. While this figure is comparable with the results of other studies on soccer, it contrasts with evidence from corpo-rations. In an interesting survey article Brickley (2003) notes that the probability difference of replacing a corporate manager between the top and bottom performance deciles is typically around 4 percentage points per year, which is quite different from the 19.4 percentage points found in this study. One possible explanation for this discrepancy is the strength of the performance signal in the soccer industry: The performance of a manager can readily be measured at a high frequency by the team’s match outcome and there are very limited information asymmetries between the principal (the president of the team, investors, or supporters) and the agent (the manager), since the match
outcomes are readily observable and represent common knowledge. Finally, there is no need to adjust the performance measure for market-wide or industry-wide effects.
According to Table 5, divisions 2, 3, and 4 have significantly higher baseline firing rates than division 1. For instance, the annualized firing probability of a manager in the fourth division is 5.5 percentage points higher than that of a manager in the first division. Here and elsewhere in the paper, annualized probability differences are obtained by annualizing (see Equation 5) both the turnover probability of an average manager (predicted probability with all variables set equal to their average values) and the turnover probability of a manager with all average characteristics expect one (in this case DDIV = 1).
All else being equal, older managers are fired with a slightly higher probability: With every additional year the firing probability rises, on average, by 0.39 percentage points.
The sign of the coefficients related to the experience variables EXP, DIN, and DNTL are iden-tical across models, even though statisiden-tical significance is not always given.
According to the logit model with fixed effects18, the more experienced a manager, the lower
his dismissal probability. Economically, this may indicate that managers with longer prior expe-rience can maintain the trust given to them for a longer period. This result (although not valid for the hazard model) is interesting because no earlier study (e.g., Audas, Dobson, and Goddard, 1999; Barros, Frick, and Passos, 2008) reports evidence of a significant impact of prior managerial experience on dismissal probabilities.
The two variables measuring prior experience as a player in the national team (DNTL) and in the team currently coached (DIN) are always associated with positive coefficients (although not always statistically significant). In other words, it seems that prior experience as a player tends to decrease job security, while prior experience as a manager has the opposite effect.
All three estimations show statistical evidence that the organizational form of supporters’ trusts (DTRUST) is associated with higher dismissal rates. For example, clubs organized as supporters’ trusts have weekly (annual) dismissal probabilities that are 0.2 (6.8) percentage points higher than
18
The Hausman test rejects the null hypothesis that the difference in coefficients is not systematic. Thus, the logit estimation with fixed effects is preferable to the logit estimation with random effects.
for other clubs. Thus, from this analysis, clubs organized as supporters’ trusts seem to be fiercer in monitoring their managers.
Manager of teams in relegation positions (DRELEG) get fired during a season with a probability that is 22.4 percentage points higher than equal managers in better positions. This result reinforces the findings of higher dismissal frequencies in relegation zones presented by Bachan, Reilly, and Witt (2008) and offers a reconciliation argument between the empirical evidence (provided, e.g., by Audas, Dobson, and Goddard, 2002) that firing a manager deteriorates team performance and the rationality of firing decisions: While firing a manager may deteriorate a team’s expected perfor-mance, it can still lower the probability of being relegated via an increase in performance volatility. Such firing strategies can be pertinently referred to as gambling for resurrection.
Finally, firings are, all else being equal, significantly less likely at the beginning of a season (DSUB1) than toward its end (DSUB5, reference category). The fact that the dummy variable DSUMMER is positive and strongly significant is not very surprising, since the summer break has a much longer duration than the other weekly time periods.
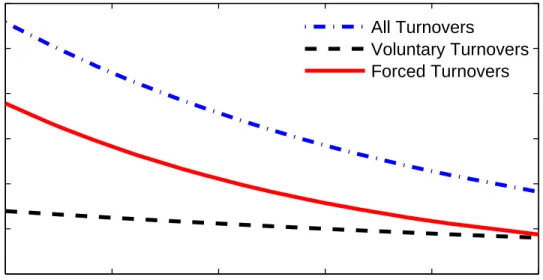
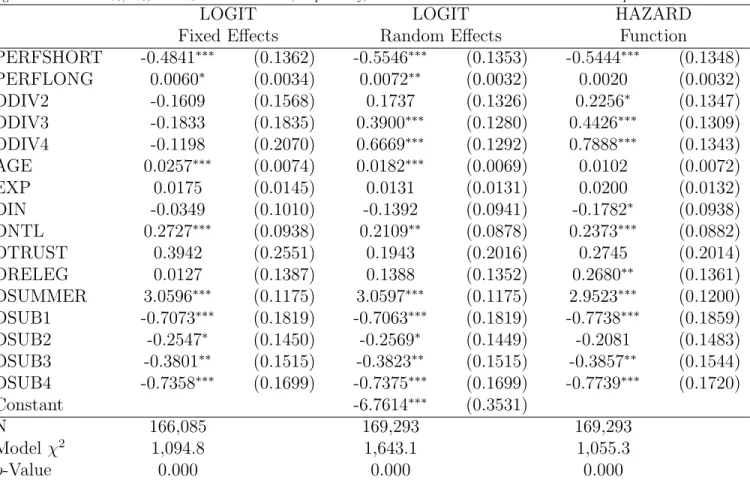
In Table 7, the same three regression models are used to explain managers’voluntary departures. In this case, managers tend to leave a team after poor short-term performance (PERFSHORT). However, the absolute magnitude of the PERFSHORT coefficient is significantly smaller than in the case of firings. This is also shown in Figure 4, where the turnover probability of managers (as estimated using the fixed-effects logit model) is plotted as a function of short-term performance. Es-timated turnover probabilities refer to average managers, that is, managers with average attributes. From Figure 4, it is evident how the performance sensitivity of forced turnovers (solid line) is much more pronounced than that of voluntary turnovers (dashed line), although both are statistically significant.
Interestingly, managers with a player background in a national team (DNTL) are significantly more likely to leave a team on a voluntary basis. The same effect does not exist for managers with prior experience as a player in the team currently managed (DIN).
Table 5: Forced Turnovers
This table shows the estimation results of three regressions: (i) a logit regression with team fixed effects, (ii) a logit regression with team random effects, and (iii) a hazard function regression. All three relate the probability of a forced manager turnover to a set of explanatory variables. The variable PERFSHORT is the win ratio in the period preceding the firing (it assumes values between zero and one), PERFLONG is the number of positions gained (lost) by a manager since the beginning of his spell, DDIV1 to ‘DDIV4’ (reference category DDIV1) are dummy variables that indicate the division in which a team is playing, AGE is the age of a manager in years, EXP measures the prior experience of a manager in the four major English soccer leagues, DIN is a dummy variable that indicates prior experience as a player in the team currently managed, DNTL is a dummy variable that identifies prior experience as a player in a national team, DTRUST is a dummy variable for managers coaching teams organized as a supporters’ trust, DRELEG is a dummy variable that indicates a relegation position, DSUMMER is a dummy variable that indicates the summer break, and DSUB1 to DSUB5 (reference category DSUB5) are dummy variables that identify five equally spaced sub-periods within a season, with DSUB1 referring to the beginning of a season and ‘DSUB5’ to its end. In all regressions, one data point corresponds to one manager of a given team in a
certain week. Here N is the total number of manager×period observations, and ‘Modelχ2’ is the test statistic for the log-likelihood ratio
test between the full-fledged model and a constant-probability model. The data used in this table refer to forced turnovers of managers in the four major English soccer leagues during the seasons from 1949/50 to 2007/08. The superscripts *, **, and *** indicate statistical significance at the 10%, 5%, and 1% confidence levels, respectively, for a two-sided t-test. Standard errors are in parentheses.
LOGIT LOGIT HAZARD
Fixed Effects Random Effects Function PERFSHORT -1.4657∗∗∗ (0.1152) -1.4685∗∗∗ (0.1147) -1.4462∗∗∗ (0.1133) PERFLONG -0.0395∗∗∗ (0.0029) -0.0376∗∗∗ (0.0028) -0.0360∗∗∗ (0.0026) DDIV2 0.4424∗∗∗ (0.1145) 0.3659∗∗∗ (0.0967) 0.3858∗∗∗ (0.0949) DDIV3 0.3048∗∗ (0.1372) 0.1971∗∗ (0.0999) 0.2336∗∗ (0.0971) DDIV4 0.5475∗∗∗ (0.1565) 0.3965∗∗∗ (0.1018) 0.4598∗∗∗ (0.0990) AGE 0.0343∗∗∗ (0.0052) 0.0304∗∗∗ (0.0049) 0.0247∗∗∗ (0.0051) EXP -0.0256∗∗ (0.0113) -0.0176 (0.0107) -0.0087 (0.0106) DIN 0.1810∗∗ (0.0730) 0.1462∗∗ (0.0688) 0.0943 (0.0675) DNTL 0.0744 (0.0694) 0.1372∗∗ (0.0665) 0.1787∗∗∗ (0.0653) DTRUST 0.5719∗∗∗ (0.1611) 0.4484∗∗∗ (0.1367) 0.4954∗∗∗ (0.1307) DRELEG 1.2152∗∗∗ (0.0724) 1.1896∗∗∗ (0.0696) 1.2850∗∗∗ (0.0698) DSUMMER 1.9617∗∗∗ (0.1143) 1.9582∗∗∗ (0.1142) 1.8875∗∗∗ (0.1147) DSUB1 -0.2984∗∗ (0.1177) -0.2836∗∗ (0.1175) -0.2823∗∗ (0.1198) DSUB2 0.1429 (0.0979) 0.1472 (0.0978) 0.2710∗∗∗ (0.1004) DSUB3 -0.0725 (0.1036) -0.0700 (0.1036) -0.0248 (0.1062) DSUB4 -0.0198 (0.1023) -0.0175 (0.1023) -0.0204 (0.1046) Constant -6.5149∗∗∗ (0.2594) N 169,219 169,293 169,293 Modelχ2 1,320.9 1,397.7 1,343.4 p-Value 0.000 0.000 0.000
Table 6: Estimated Turnover Probabilities and Performance Deciles
This table reports turnover probabilities (and probability differences) relative to different performance quantiles: the median and the lowest and highest performance deciles. The estimated probabilities result from the fixed-effect logit regression presented in Tables 5 and 7. While the probabilities relative to the three quantiles refer to weekly periods, the probability difference ‘Diff. (Annual.)’ is an annualized figure. The data used in this table refer to the turnover of managers in the four major English soccer leagues during the seasons from 1949/50 to 2007/08.
Deciles All Turnovers Voluntary Turnovers Forced Turnovers
Median 0.226 0.081 0.136
Lowest Decile 0.361 0.106 0.262
Highest Decile 0.136 0.062 0.068
Diff. (Annual.) 22.6 p.p. 4.4 p.p. 19.4 p.p.
Figure 4: Estimated Probabilities
This figure shows the development of the estimated probability of manager turnover with average characteristics in dependence of short-term performance (PERFSHORT). The graph shows the estimated probability for all turnovers (dot-dashed line) and the subsamples of voluntary turnovers (dashed line) and forced turnovers (solid line). The graph reflects the output of the regressions presented in Tables 5 and 7. The data used in this figure refer to the turnover of managers in the four major English soccer leagues during the seasons from 1949/50 to 2007/08.
0 0.2 0.4 0.6 0.8 1 0 0.002 0.004 0.006 0.008 0.01 0.012 Estimated Probability Performance All Turnovers Voluntary Turnovers Forced Turnovers
Table 7: Voluntary Turnovers
This table shows the estimation results of three regressions: (i) a logit regression with team fixed effects, (ii) a logit regression with team random effects, and (iii) a hazard function regression. They all relate the probability of a voluntary manager turnover to a set of explanatory variables. The variable PERFSHORT is the win ratio in the period preceding the firing (it assumes values between zero and one), PERFLONG is the number of positions gained (lost) by a manager since the beginning of his spell, DDIV1 to DDIV4 (reference category DDIV1) are dummy variables that indicate the division in which a team is playing, AGE is the age of a manager in years, EXP measures the prior experience of a manager in the four major English soccer leagues, DIN is a dummy variable that indicates prior experience as a player in the team currently managed, DNTL is a dummy variable that identifies prior experience as a player in a national team, DTRUST is a dummy variable for managers coaching teams organized as a supporters’ trust, DRELEG is a dummy variable that indicates a relegation position, DSUMMER is a dummy variable that indicates the summer break, and DSUB1 to DSUB5 (reference category DSUB5) are dummy variables that identify five equally spaced sub-periods within a season, with DSUB1 referring to the beginning of a season and DSUB5 to its end. In all regressions, one data point corresponds to one manager of a given team in a certain
week. The term N is the total number of manager×period observations, and ‘Modelχ2’ is the test statistic for the log-likelihood ratio
test between the full-fledged model and a constant-probability model. The data used in this table refer to forced turnovers of managers in the four major English soccer leagues during the seasons from 1949/50 to 2007/08. The superscripts *, **, and *** indicate statistical
significance at the 10%, 5%, and 1% confidence levels, respectively, for a two-sidedt-test. Standard errors are in parentheses.
LOGIT LOGIT HAZARD
Fixed Effects Random Effects Function PERFSHORT -0.4841∗∗∗ (0.1362) -0.5546∗∗∗ (0.1353) -0.5444∗∗∗ (0.1348) PERFLONG 0.0060∗ (0.0034) 0.0072∗∗ (0.0032) 0.0020 (0.0032) DDIV2 -0.1609 (0.1568) 0.1737 (0.1326) 0.2256∗ (0.1347) DDIV3 -0.1833 (0.1835) 0.3900∗∗∗ (0.1280) 0.4426∗∗∗ (0.1309) DDIV4 -0.1198 (0.2070) 0.6669∗∗∗ (0.1292) 0.7888∗∗∗ (0.1343) AGE 0.0257∗∗∗ (0.0074) 0.0182∗∗∗ (0.0069) 0.0102 (0.0072) EXP 0.0175 (0.0145) 0.0131 (0.0131) 0.0200 (0.0132) DIN -0.0349 (0.1010) -0.1392 (0.0941) -0.1782∗ (0.0938) DNTL 0.2727∗∗∗ (0.0938) 0.2109∗∗ (0.0878) 0.2373∗∗∗ (0.0882) DTRUST 0.3942 (0.2551) 0.1943 (0.2016) 0.2745 (0.2014) DRELEG 0.0127 (0.1387) 0.1388 (0.1352) 0.2680∗∗ (0.1361) DSUMMER 3.0596∗∗∗ (0.1175) 3.0597∗∗∗ (0.1175) 2.9523∗∗∗ (0.1200) DSUB1 -0.7073∗∗∗ (0.1819) -0.7063∗∗∗ (0.1819) -0.7738∗∗∗ (0.1859) DSUB2 -0.2547∗ (0.1450) -0.2569∗ (0.1449) -0.2081 (0.1483) DSUB3 -0.3801∗∗ (0.1515) -0.3823∗∗ (0.1515) -0.3857∗∗ (0.1544) DSUB4 -0.7358∗∗∗ (0.1699) -0.7375∗∗∗ (0.1699) -0.7739∗∗∗ (0.1720) Constant -6.7614∗∗∗ (0.3531) N 166,085 169,293 169,293 Modelχ2 1,094.8 1,643.1 1,055.3 p-Value 0.000 0.000 0.000
4.2
Performance Sensitivity of Firing Decisions: A Long-Term
Per-spective
After having established the importance of (short-term and long-term) team performance in man-ager turnover decisions, we focus on the development of this relation over time. Figure 5 shows forced turnover frequencies in dependence of prior performance quintiles and time. While in Fig-ure 5a performance refers to the outcome of most recent matches (PERFSHORT), in FigFig-ure 5b it captures changes in position since the beginning of the manager spell (PERFLONG). As expected, both graphs show evidence that forced turnovers are negatively correlated with performance. Inter-estingly, both graphs seem to suggest that forced turnovers have become more frequent over time and that the firing–performance relation is more pronounced in recent decades than it was at the beginning of the sample.
To test whether this visual impression holds after accounting for different control variables, the regressions presented in Table 5 are rerun in Table 8 by including a time trend (TREND) and in-teractions of short-term and long-term performance with this time trend (PERFSHORT*TREND and PERFLONG*TREND).
The results presented in Table 8 show clear patterns with respect to the evolution of forced turnovers. The positive and significant coefficient of TREND confirms that forced turnovers have significantly increased over time. Furthermore, the negative link between short-term performance and manager firings has become significantly stronger over time. Interestingly, there are no signifi-cant changes in the relation between long-term performance and firing probabilities, which rectifies the visual impression obtained from Figure 5b.
In Table 9 the evolution of the link between short-term performance and firing decisions is further analyzed by means of dummy variables for each decade covered by the sample: D60-69, D70-79, D80-89, D90-99, D00-08.19 In addition, by interacting PERFSHORT with every decade
dummy variable, we obtain for each decade an autonomous estimate of the importance of
short-19
The dummy variable D50-59 is not included in the regression because the seasons 1949/50 through 1958/59 serve as a reference category.
term performance on the probability of a manager being fired. Strikingly, the probability of forced turnovers has increased almost monotonically over time. For example, for an average manager the probability of getting fired during one season is 30.0 percentage points higher in the 2000–2008 seasons than it was in the 1950s. Furthermore, the short-term performance sensitivity of firings has steadily decreased over time. While in the 1950–1959 seasons the link between short-term perfor-mance and firing probabilities is not significantly different from zero, in the 2000–2008 seasons it is significantly negative, with at-value of 7.5.
The magnitude of the change in the relation between short-term performance and firing decisions is made even clearer in Table 10. Table 10 reports for each decade (Panels A to E), the estimated annualized probabilities of (i) all turnovers, (ii) voluntary turnovers, and (iii) forced turnovers for average managers in three performance scenarios: median, lowest-decile, and highest-decile short-term performance. Consistent with economic theory and previous results, in every time subsample a manager in the lowest performance decile faces a higher probability of being fired than one with median or lowest-decile performance. However, the magnitude of this probability difference changes widely across decades, ranging from 11.6 percentage points in the 1960s to 48.1 percentage points in the 2000–2008 seasons. While the probability of an average manager being fired in the highest performance decile has not changed dramatically over time, the corresponding probability of a man-ager in the lowest performance decile being fired has increased from 21.1% in the 1950s to 64.9% in the 2000–2008 seasons. Interestingly, the same probability difference in connection with voluntary manager turnovers has remained remarkably constant over time.
The pattern according to which managers of English soccer teams get fired has dramatically changed over time. In particular, both the frequency of manager firings and the (negative) depen-dence on short-term performance have significantly increased over time. In other words, nowadays managers face a much higher probability of getting fired, and this probability depends to a larger extent on short-term rather than long-term performance. The increased performance dependence of manager firings is indicative of a more efficient and more competitive market for team managers. It suggests that the increased level of economic importance and competition in English soccer has
gone hand in hand with a fiercer governance mechanism of manager firings. In our opinion, the empirical fact that manager firings seem to have an adverse performance impact and trigger higher performance volatility, on average (see Audas, Dobson, and Goddard, 2002), does not alter this conclusion. First, the decision of firing poorly performing managers is not only dictated by the wish of substituting them with better ones. Economic theory recognizes that the threat of firing a manager also serves as an incentive to increase efforts. Consequently, for the firing threat to be credible, managers may be rationally dismissed in the presence of poor performance even in cases where the poor performance is simply the result of bad luck and no better successor is available. Second, since managers of teams in relegation positions are found to face a higher probability of getting fired, it is likely that owners of teams facing a high likelihood of being relegated tend to fire managers with the aim of inducing higher performancevolatility (even at the expense of lower
mean performance). Along this line of reasoning, team owners seem to play a gambling for resur-rection game that can very well be rational, even though firing decisions have a negative impact on performance on average.
Finally, while in Table 5 the coefficient of the variable DTRUST is positive and significant, in Tables 8 and 9 their significance vanishes in all three models considered. We attribute this to the fact that supporters’ trusts started to be established in 199220, that is, toward the end of the
sam-ple. It is likely that the absence of time trends or time period dummy variables in Table 5 turned DTRUST into a proxy for time and let it pick up the higher firing frequency in the last part of the sample. Once time trends are included into the regression, DTRUST ceases to have a significant impact on the probability of a manager being fired.
5
Conclusion
This paper investigates the determinants of (forced) manager turnovers in the four major English soccer leagues by using a large hand-collected data set of manager changes in the seasons from 1949/50 to 2007/08. As argued in the related literature (see, e.g., Audas, Dobson, and Goddard,
20
Figure 5: Firing Frequency and Performance across Decades
This figure shows frequencies of forced turnovers in different (a) short-term and (b) long-term performance quintiles and decades. The data used in this figure refer to the complete set of forced turnovers of regular managers in the four major English soccer leagues during the seasons from 1949/50 to 2007/08.
Fig(a) 1950s 1960s 1970s 1980s 1990s 2000s 1 2 3 4 5 0 0.5 1 1.5 2 2.5
Performance Quintile (PERFSHORT) (1=lowest, 5=highest)
Frequency of Firings (in %)
Fig(b) 1950s 1960s 1970s 1980s 1990s 2000s 1 2 3 4 5 0 0.5 1 1.5 2 2.5
Performance Quintile (PERFLONG)
Table 8: Performance Sensitivity of Forced Turnovers: Time Trend
This table shows the estimation results of three regressions: (i) a logit regression with team fixed effects, (ii) a logit regression with team random effects, and (iii) a hazard function regression. They all relate the probability of a forced turnover to a set of explanatory variables. The variable PERFSHORT is the win ratio in the period preceding the firing (it assumes values between zero and one), PERFLONG is the number of positions gained (lost) by a manager since the beginning of his spell, DDIV1 to DDIV4 (reference category DDIV1) are dummy variables that indicate the division in which a team is playing, AGE is the age of a manager in years, EXP measures the prior experience of a manager in the four major English soccer leagues, DIN is a dummy variable that indicates prior experience as a player in the team currently managed, DNTL is a dummy variable that identifies prior experience as a player in a national team, DTRUST is a dummy variable for managers coaching teams organized as a supporters’ trust, DRELEG is a dummy variable that indicates a relegation position, DSUMMER is a dummy variable that indicates the summer break, DSUB1 to DSUB5 (reference category DSUB5) are dummy variables that identify five equally spaced sub-periods within a season (where DSUB1 refers to the beginning of a season and DSUB5 to its end), and TREND is a variable that assumes values from one (corresponding to the season 1949/50) to 59 (corresponding to the season 2007/08). In all regressions, one data point corresponds to one manager of a given team in a certain week. The term N is the
total number of manager×period observations, and Modelχ2is the test statistic for the log-likelihood ratio test between the full-fledged
model and a constant-probability model. The data used in this table refer to forced turnovers of managers in the four major English soccer leagues during the seasons from 1949/50 to 2007/08. The superscripts *, **, and *** indicate statistical significance at the 10%, 5%, and 1% confidence levels, respectively, for a two-sided t-test. Standard errors are in parentheses.
LOGIT LOGIT HAZARD
Fixed Effects Random Effects Function
PERFSHORT -0.4968∗ (0.2909) -0.5263∗ (0.2897) -0.5432∗ (0.2890) PERFLONG -0.0403∗∗∗ (0.0077) -0.0367∗∗∗ (0.0074) -0.0336∗∗∗ (0.0069) DDIV2 0.4137∗∗∗ (0.1161) 0.3249∗∗∗ (0.0966) 0.3641∗∗∗ (0.0954) DDIV3 0.2853∗∗ (0.1402) 0.1491 (0.0994) 0.1976∗∗ (0.0974) DDIV4 0.5048∗∗∗ (0.1593) 0.3365∗∗∗ (0.1010) 0.4308∗∗∗ (0.0997) AGE 0.0333∗∗∗ (0.0053) 0.0297∗∗∗ (0.0051) 0.0230∗∗∗ (0.0053) EXP -0.0373∗∗∗ (0.0115) -0.0311∗∗∗ (0.0108) -0.0223∗∗ (0.0107) DIN 0.1326∗ (0.0739) 0.1019 (0.0694) 0.0377 (0.0681) DNTL 0.0365 (0.0702) 0.1138∗ (0.0670) 0.1641∗∗ (0.0656) DTRUST 0.0428 (0.1680) 0.0442 (0.1377) 0.0923 (0.1335) DRELEG 1.2168∗∗∗ (0.0724) 1.1896∗∗∗ (0.0695) 1.3047∗∗∗ (0.0697) DSUMMER 1.9683∗∗∗ (0.1147) 1.9632∗∗∗ (0.1147) 1.8916∗∗∗ (0.1152) DSUB1 -0.3680∗∗∗ (0.1180) -0.3563∗∗∗ (0.1178) -0.3490∗∗∗ (0.1201) DSUB2 0.1233 (0.0981) 0.1286 (0.0979) 0.2465∗∗ (0.1003) DSUB3 -0.0786 (0.1037) -0.0736 (0.1036) -0.0230 (0.1060) DSUB4 -0.0224 (0.1024) -0.0187 (0.1023) -0.0072 (0.1045) TREND 0.0341∗∗∗ (0.0034) 0.0329∗∗∗ (0.0033) 0.0345∗∗∗ (0.0033) PERFSHORT*TREND -0.0231∗∗∗ (0.0073) -0.0223∗∗∗ (0.0073) -0.0209∗∗∗ (0.0073) PERFLONG*TREND -0.0001 (0.0002) -0.0001 (0.0002) -0.0002 (0.0002) Constant -7.5790∗∗∗ (0.2913) N 169,219 169,293 169,293 Modelχ2 1,478.8 1,553.1 1,533.1 p-Value 0.000 0.000 0.000