Open Government Data
Completed Research Paper
Thorhildur Jetzek
Copenhagen Business School
Copenhagen, Denmark
[email protected]
Michel Avital
Copenhagen Business School
Copenhagen, Denmark
[email protected]
Niels Bjørn-Andersen
Copenhagen Business School
Copenhagen, Denmark
[email protected]
Abstract
A driving force for change in society is the trend towards Open Government Data (OGD). While the value generated by OGD has been widely discussed by public bodies and other stakeholders, little attention has been paid to this phenomenon in the academic literature. Hence, we developed a conceptual model portraying how data as a resource can be transformed to value. We show the causal relationships between four contextual, enabling factors, four types of value generation mechanisms and value. We use empirical data from 61 countries to test these relationships, using the PLS method. The results mostly support the hypothesized relationships. Our conclusion is that if openness is complemented with resource governance, capabilities in society and technical connectivity, use of OGD will stimulate the generation of economic and social value through four different archetypical mechanisms: Efficiency, Innovation, Transparency and Participation.
Keywords: Open government data, Public sector information, Value generating mechanisms, Openness, Social value, Economic value.
Introduction
Today, we generate and store more data than at any other time in history. Computing and networking capabilities combined with openness enhance the potential impact of the accumulated data, offering society an opportunity to drive massive social, political and economic change (Kundra, 2012). Thus far, there has been apparent tension between the social value driven networks of data, information and knowledge sharing, on the one hand, and the economic value driven products and services markets of ownership and exchange, on the other. However, the current trend towards openness and sharing has led to a cognitive reframing of the roles of, and relationships between, sectors, as well as a blurring of the boundaries between economic markets and social networks. These complex interdependencies are forcing us to re-think the concepts of economic and social value in a world moving towards digital interoperability, information sharing, co-creation and collaborative networks (Avital et al., 2007; Hess and Ostrom, 2006).
Having Open Government Data (OGD) implies that the public sector relinquishes its role as information gatekeeper in lieu of a new role as information provider (Davies, 2010). The number of OGD initiatives has grown from two to over three hundred in the period 2009-2013, and membership in the Open Government Partnership (OGP) has gone from eight to fifty-nine countries in just under two years. Over 280 government data catalogs have been published and over a million datasets have been released by governments around the world, spawning new businesses and social projects. OGD is commonly seen as a driver of efficiency and a vehicle for increasing transparency, citizen participation and innovation in society. Despite the potential significance of OGD, emphasized by an abundance of anecdotal evidence, we could not identify many studies on how OGD will contribute to value generations. To-date, the economic and social impact of open-data policies remains largely unclear, and there are scant empirical data available on the effects of the various policy approaches, thus leaving policy makers without the facts they need to assess and improve these policies (Huijboom and Van den Broek, 2011; Zuiderwijk et al., 2012). Accordingly, this paper addresses the question: How can use of OGD stimulate value generation?
Building on a synthesis of the OGD literature and established theories of value generation, we have developed a conceptual model that portrays the role of the value generation mechanisms for the generation of value from OGD. In this paper we suggest a nomological network of constructs that together can explain how OGD as a resource can be transformed to value. The model shows how four enabling factors: Openness, Data governance, Capabilities and Technical connectivity positively affect four value generation mechanisms: Efficiency, Innovation, Participation and Transparency, all of which possess the ability to generate economic and social value, however differently. We conduct a macro level analysis on the impacts of nationwide OGD initiatives. We use empirical data from 61 countries collected from several respectable open data-sources to test these relationships, using the partial least squares (pls) method. The results mostly support our hypotheses on the relationships between the enabling factors, value generation mechanisms and resulting value; however, we did not find significant impacts from openness on efficiency and transparency mechanisms.
Our research has both theoretical and practical implications. The identified constructs and relationships in our conceptual model can be further used to theorize on the implications from the use of OGD in theoretical and practical contexts. We propose that OGD is a common resource, governed by the public sector. As such, it needs to be managed, monitored and protected as any other resource, with the aim of maximizing the potential value generation possibilities now and in the future. Our contribution to practice is the identification of the constructs and items that have the ability to stimulate value generation and the description of the causal relationships between these factors, the different value generation mechanisms and value.
Theoretical background and model development
Open Government Data
Open data can be defined as data that are freely accessible online, available without technical restrictions to re-use, and provided under open access license that allows the data to be re-used without limitation, including across different ‘fields of endeavor’ (e.g., commercial and non-commercial alike) (OKF, 2012). The concept of Open Government Data (OGD) refers to government data defined as "data and information produced or commissioned by government or government controlled entities" (OKF, 2012) that are opened up for use and re-use by public and private agents alike. In the currently used terminology, OGD does not include data that are subject to valid privacy, security or privilege limitations, as governed by other statutes. Government data sets are an interesting subset of open data because such subsets have already been collected for specific use, have been paid for by taxpayers, are relevant and offer value beyond what is captured from the originally intended use. When opened up, government data become a common, shared resource (i.e., public good) that is provided by the government. Building on Nilsen (2010) and Shapiro and Varian (1999), the typical features of OGD as a resource are as follows: 1) It is non-rivalrous; 2) It is not excludable; 3) It has high fixed costs; 4) It has (almost) zero marginal cost; 5) It offers valuable information and has high potential for re-use.
Two distinct ideologies seem to drive most of the OGD initiatives today: the ‘re-use of data’ perspective and the ‘Open Government’ perspective. We thus reviewed the respective tensions and contributions of
these two unique streams. The literature on re-use of OGD is mostly focused on the economic value of government data, while the literature on Open Government is in a higher grade directed towards government policy and centered on how use of OGD can contribute to the generation of social value in collaborative settings. One of the most disruptive aspects of OGD is the transformation from a largely closed world to an open, interconnected world. In a closed world, private companies and public organizations each exist within their own administrative boundaries, and relations between them are based on traditional market behavior, rules and regulations. When governments become open, the mechanisms that affect value generation and appropriation move beyond the traditional buyer-seller relationships; thus connections between the public and the private, as well as the social and the economic dimensions begin to emerge.
Ultimately, we could identify four archetypical generative mechanisms. Two of them originate from the Open Government literature: transparency of government and citizen participation/collaboration (Bertot et al., 2010, 2012; Harrison et al., 2011; Linders and Wilson, 2012) and two from the re-use literature: efficiency and innovation (Gigler et al, 2011; Halonen, 2012; Janssen, 2011). We also identified a number of barriers to value generation and appropriation: 1) closed or inaccessible datasets, 2) lack of comprehensive data policies, 3) lack of validity, completeness and exhaustiveness of datasets, 4) insufficient metadata, as well as lack of technical and semantic interoperability, 5) lack of consistency in cross-border access regimes, 6) lack of motivation within the public sector, 7) lack of technical skills within the public sector, 8) lack of data literacy and technical ability and 9) too fragmented and disparate open data community (Bertot et al. 2010; Davies, 2010; Dawes, 2012; Halonen, 2012; Jansen, 2011; Janssen et al. 2012; Lee and Kwak, 2011; Mayer-Schönberger and Zappia, 2011; Zuiderwijk et al., 2012). In order to overcome these barriers, we propose that governments should focus on four enabling factors: Openness, resource governance, capabilities and technical connectivity.
The multifaceted nature of value
The conceptual distinction between value generation and value appropriation has been growing in importance with the trend towards openness, technical connectivity and collaborative ventures. Value generation materializes when the utility of society´s members increases after accounting for the resources used in that activity. Value appropriation materializes when an actor is able to capture a portion of the value created by an activity (Bowman and Ambrosini, 2000). The relationship between the generation and appropriation of value for multiple stakeholders in the context of alliances is increasingly being viewed to be multifaceted in nature (Sarker et al., 2012). Gil-Saura et al. (2009) suggest that value is a subjective, multidimensional construct; accordingly, it is only through a multidimensional view that we get a true picture of the value generated within alliance relationships. However, despite the recent focus on the creation of value in collaborative settings, little is known about the underlying mechanisms (Sarker et al., 2012).
Two types of value are frequently discussed: economic value, defined as the worth of a good or service as determined by the market, and social value, which is created when resources, inputs, processes or policies are combined to generate improvements in the lives of individuals or society as a whole (Emerson et al., 2001). However, the shifts toward an economy centered on information and the move to a networked Internet-based environment have caused significant attenuation of the limitations that market-based production places on the pursuit of value (Benkler, 2006). Due to these trends, the perceived divergence between the generation of social and economic value is becoming increasingly contested. In a recent attempt to amalgamate the concepts of social and economic value generation, Porter and Kramer (2011) introduced the term shared value. Shared value is based on the idea that societal needs, not only economic needs, define markets. It also recognizes that social harms frequently create internal costs for companies, such as wasted energy, health problems and/or the need for remedial training to compensate for inadequacies in education (Porter and Kramer, 2011). The generation of shared value is essentially about expanding the total pool of economic and social value.
In welfare economics, the term social welfare is used to describe a construct that reaches further than the commonly used measure of Gross Domestic Product (GDP) as an indicator of value. As GDP mainly measures market production, it ignores many of the determinants of social value such as the environment, freedom, health and education (Fleurbaey, 2009; Michaelson et al., 2009). For example, traffic jams may increase GDP as a result of the increased use of gasoline, but obviously do not improve the quality of life.
Moreover, if citizens are concerned about the quality of air, and air pollution is increasing, then statistical measures which ignore air pollution will provide an inaccurate estimate of what is happening to citizens’ well-being (Stiglitz et al., 2009). Many have attempted to construct an aggregate measure of social welfare by using social indicators (Fleurbaey, 2009); however, there is still no general consensus on which indicators give the most reliable evidence.
Another value concept often seen in the e-government literature is public value. The central proposition in Moore´s (1995) public value framework is that public resources should be used to increase value, not only in an economic sense but also more broadly in terms of what is valued by citizens and communities. Benington (2011) further extends Moore´s (1995) definition of public value and adds the dimension of “What adds value to the public sphere” (Benington, 2011, p. 31), where the public sphere includes state, market and civil society. The dimensions of public value include: 1) economic value – adding value to the public realm through the generation of economic activity, 2) social and cultural value – adding value to the public realm by contributing to social cohesion and well-being, 3) political value – adding value to the public realm by stimulating and supporting democratic dialogue and active public participation, as well as citizen engagement and 4) ecological value – adding value to the public realm by actively promoting sustainable development and reducing pollution, waste, and global warming (Benington, 2011).
This leads us to the question of how we can specify the relationship between use of OGD as a resource and the generation of value. This is not necessarily a direct relationship. Value is produced by value generating mechanisms which reveal the instrumental pathways by which OGD is transformed to value. An identification of these mechanisms allows us to specify how and what value can be generated from OGD (Harrison et al., 2011). Moreover, as OGD is a strategic, open resource, it holds great potential for a number of stakeholders, including public sector agencies, private businesses, academia, citizens and civic organizations (Ubaldi, 2013). All of these might be able to co-create value or simultaneously appropriate the generated value. Therefore, we will view the relationship between OGD and value from a societal standpoint, where different mechanisms have the ability to generate outcomes that positively affect the latent concept of social and economic value, reflected by social welfare indicators like higher income, better health or increased wellbeing.
Conceptual model
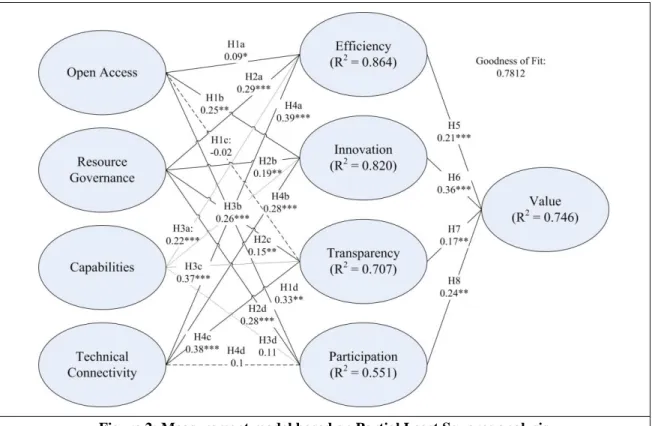
The conceptual model in Figure 1 illustrates the constructs and relationships that are the basis for the nomological network of OGD value generation. In the next subsections, we explain the individual constructs, and present our hypotheses regarding these relationships.
Openness
Opening access to government data implies that public organizations participate in a process which has to consider influences, discourses and exchanges to be constructive; further, it welcomes opposing views and inputs, consequently giving up control, at least to some extent (Janssen et al., 2012). This transformation from a closed system to an open system reframes the whole context of government, having potentially far-reaching effects on both the public and the private sector. Publishing various policy documents online for increased transparency and accountability, using openness and interoperability of data to increase efficiency, enabling citizens to participate in the data generating and reviewing process and enabling access to commercially valuable information for innovation purposes are the key objectives of OGD initiatives (Davies, 2010; Karunasena et al., 2011; Vickery, 2011). Providing OGD can be seen a matter of availability, format, accessibility and license (Davies, 2010). We conceptualize openness as a construct that has four components: 1) use of open licenses that allow for commercial re-use, 2) extent of the OGD initiative 3) availability of various types of data, and 4) usability and accessibility of available data-sources. This leads to the first hypothesis:
H1:Openness positively affects the ability of society to generate value from data through the four value generation mechanisms (H1a: Efficiency, H1b: Innovation, H1c: Transparency and H1d: Participation).
Figure 1. A conceptual model of OGD value generation
Resource governance
Policies, governance mechanisms and a variety of skills and capabilities within government are needed to reap the maximum benefits from open data initiatives (Dawes, 2012). Once government has opened up, OGD become a common, shared resource, available for use within an open network of public and private stakeholders. However, this resource is still governed by the public sector as the main creator of the data. In order to ensure the equitable, efficient and sustainable use of any resource, it needs to be managed, monitored and protected (Hess and Ostrom, 2006). We conceptualize resource governance as a multi-dimensional construct that encompasses all aspects of data management, as well as the leadership and skills needed to ensure the sustainable and equitable use of the resource.
Data management must ensure that the data are of sufficient quality. Data quality can be defined as a multi-facetted term comprising utility, objectivity and integrity (Batini and Scannapieco, 2006). Unknown, inconsistent or unsatisfactory quality of OGD leads to substantial risks for validity and relevance. As errors in data become most evident when the data are used, governments could utilize the power of the network to get feedback for improvement of data, thus saving internal costs while improving the quality of the resource. It is important to give the correct context to the data, as government data are in many cases collected or created for specific purposes, and thus could be misleading if taken out of that context (Dawes, 2012). Accordingly, use could be stimulated if more information about the way open data are collected and processed were to be provided by including metadata (Zuiderwijk et al., 2012). The security of information must also be considered. A holistic approach to data management begins with an understanding of the information life cycle—the collection, updating, processing, and eventual deletion of personal information—and the adoption of a technology framework that enables governments to set controls which safeguard individuals’ privacy (Lampri, 2012).
Governance must ensure the sustainability of the resource and the initiative (Hess and Ostrom, 2006). Sustainable systems are those that meet current needs of many individuals involved in producing, deciding and using a common resource without compromising the ability of future generations utilizing the resource (Hess and Ostrom, 2006). Ongoing analysis of more than 900 major change initiatives in the public sector indicates that 61 percent of those initiatives do not yield the hoped-for impact, and that a major factor in such cases is a lack of the skills, mind-sets and behaviors critical to sustaining change (McKinsey, 2012). Developing and maintaining e-Government projects is a continuous process of policy
development, investment planning, innovation, learning and change management. This process must fit with, and respond to, a dynamic development strategy that supports evolving national goals and creates sustained institutional reforms. Key to further benefits, whether economic or social, is managerial leadership and political support (Bertot et al., 2010, Heeks, 2003; McKinsey, 2012). Releasing OGD requires a certain level of information and ICT capabilities by civil servants (Gigler et al., 2011). Therefore, an emphasis on public officials’ data literacy and technological skills is highly relevant for efficient dissemination of OGD data.
H2:Resource governance increases the long term intrinsic value of OGD and therefore positively affects the ability of society to generate value from OGD through the four value generation mechanisms (H2a: Efficiency, H2b: Innovation, H2c Transparency, H2d: Participation).
Capabilities
As OGD is a common, shared resource, the generative ability of the value generation mechanisms is dependent on certain capabilities in society. A capability can be defined as a measure of the ability of an entity to achieve an objective. In our case it is the collective ability of individuals and organizations to use and re-use OGD. Following Hess and Ostrom (2006) we emphasize the need for equitable use of the data resource. Citizen’s access to the Internet and their ability to utilize the provided information are considered important for ensuring equitable dissemination (Bertot et al., 2010; Gurstein, 2011; Halonen, 2012). The digital divide can be broadly defined as the gap between those who have access to technologies and those who do not; however, there are in fact multiple divides that can exist, of which access to the ICTs is but one. Those issues include technology literacy as the ability to understand and use technology and the ability of persons with disabilities to access the content through adaptive technologies (Bertot et al., 2010). Without the capabilities to access, use and make sense of data, the generative ability of the transparency and participation mechanisms becomes limited, and innovation opportunities and efficiency gains might be forgone. We conceptualize capabilities as a multi-dimensional construct that encompasses equitable access opportunities as well as technology and data literacy.
H3:Capabilities positively affect the ability of society to generate value from OGD through the four value generation mechanisms (H3a: Efficiency, H3b: Innovation, H3c: Transparency, H3d: Participation).
Technical connectivity
The technological backbone of any OGD initiative is an infrastructure that facilitates data exchange between government agencies and the public (Gigler et al., 2011; McKinsey, 2011). Furthermore, in order to enable effective data use, accessibility of the infrastructure is important (Gurstein, 2011). The ability to store and aggregate data and then use the derived data sets to perform analysis has increased in conjunction with recent technical developments (McKinsey, 2011). To enable value generation from OGD, public and private organizations will have to deploy technologies that can help them integrate, analyze, visualize and consume the growing torrent of available data (McKinsey, 2011). For instance, schematic heterogeneity and lack of consistency can hinder value generation by decreasing usability and complicating access as well as integration of the data. Due to the decoupling of data from its original creation context and the increasing need to simultaneously analyze structured, semi-structured and unstructured data, semantic interoperability, identity resolution and ontologies are becoming central methodologies to ensure consistency and meaningful results while allowing third parties the ability to connect different data-sources (Alani et al., 2007). While the diffusion of these technologies is in early stages, Gartner has named semantic technologies as one of the top technology trends impacting information infrastructure in 2013.
Technical connectivity is conceptualized as a construct that describes the availability of technologies that allow users to store, access, combine and analyze the data. This includes availability of the infrastructure and use of semantic technologies, as well as data management; analytics and discovery software, plus the use of multiple platforms to enable general access to content. We propose that technological connectivity positively influences efficiency through increased interoperability and innovation by introducing new ways to transform data. Furthermore we propose that technical connectivity has the ability to influence
transparency by enabling accessibility and sense-making. Finally, it facilitates e-participation by offering new channels for participation.
H4: Technical connectivity positively affects the ability of society to generate value from OGD through the four value generation mechanisms (H4a: Efficiency, H4b: Innovation, H4c: Transparency, H4d: Participation).
Efficiency
The importance of the efficient use of public resources for economic growth and stability, as well as for general well-being has been brought to the forefront by a number of developments over the past decades (Afonso et al., 2010). As a consequence of increasing government intervention in affairs such as child care, education, and health services, public sectors have faced mounting difficulties in managing efficiently the administrative bureaucracy. Increasing cross-boundary interactions and higher levels of information exchange between citizens and government have increased the total amount of government data collected and stored. These trends call for more efficient processing of data in order to provide the expected services (Cordella, 2007). The two main goals of digitization in government are to increase agency efficiency and offer benefits to citizens (Axelsson et al., 2013). Efficiency of public sector organizations can be gained by cutting processing costs, making strategic connections between and among government agencies, and creating empowerment (European Commission, 2006). We propose that the public sector can use openness, for instance by allowing citizens to access and manage their own data, to deliver public services more efficiently while safeguarding the quality of services. As a result, resources can be moved from non-value adding tasks to value-adding tasks, positively affecting the generation of value.
The aim of efficiency is to improve resource allocation so that waste is minimized and the outcome value is maximized, given the same amount of resources. Efficiency gains can be the result of a decrease in transaction costs. Transaction costs are a part of the administrative burden of regulation for the private sector and are often consequences of the complexity and the uncertainty of the economic system. Different types of transaction costs include search and information costs, bargaining costs, monitoring costs and enforcement costs. Use of technology, standardized work procedures and free flow of information has been shown to reduce the need for normative, rule-based mechanisms of coordination (Cordella, 2007). Following this rationale, e-government is often described as the right move to implement the changes that are needed to increase the efficiency of public organizations’ performance (Cordella, 2007). Openly sharing data can reduce search costs and make bargaining and monitoring easier, as well as enable faster and easier access to information, increased automation, standardization and interoperability.
An example case where OGD is used to increase efficiency is the Danish Basic Data Program (Digitaliseringsstyrelsen, 2012). The aim is to improve the quality of all basic data registers, create a common data model for all the basic registers in Denmark and implement a common platform where both public and private users can get access to the data. As a result of these changes, coordination should get easier and the possibility for automated business processes across authorities should be increased. Furthermore, as data will be freely available online, transaction costs related to user support and billing will be diminished. The total annual savings for the public sector are projected to be around €35 million (Digitaliseringsstyrelsen, 2012). Moreover, integrated government data of better quality will also benefit private industries, such as real estate dealers, insurance companies, the financial sector and the telecom industry, which previously had to spend significant resources on creating usable information from heterogeneous data-sources. The cost-savings for the private industry are estimated to be around €65 million per annum when the program is fully implemented.
H5: Efficiency positively affects value through decreased transaction costs, enabling better resource allocation and increased quality of public services.
Innovation
The Oslo Manual defines innovation as the implementation of a new or significantly improved product (good or service), or process, a new marketing method, or a new organizational method in business practices, workplace organization or external relations (OECD, 2005). Recent technological developments
have provided firms with the ability to collect, manage and use different types of data in multiple ways to innovate, and subsequently create value (Koski, 2013). By 2015, innovation around data is projected to help create 4.4 million IT jobs globally (Gartner, 2011). We define data-driven innovation as an iterative process initiated by the perception of new markets and/or new service opportunities for a technology based invention, based solely or in part on OGD, thus leading to the development, production, and marketing of the process, product or service and the creation of new businesses. We propose that the recent developments in technical connectivity as well as in data analytics technologies and the increasing wealth of OGD available are the foundation for innovation from OGD. Moreover, the governance of the data and user´s capabilities to access and transform the data is proposed to be influencing factors. Following Schumpeter (1934), we assume that innovation can have economy-wide effects. Innovation is the source of value creation in Schumpeter’s economic theory, bringing about novel combinations of resources, new production methods, as well as new products and services, which, in turn, lead to the transformation of markets and industries, thus increasing value. Numerous studies have confirmed the relationship between macro-level business innovation and economic value (most often conceptualized as economic growth). The social impacts of new innovations have, however, been much less discussed and analyzed, with the possible exception of Simon Kuznets (1974), who separated economic and non-economic consequences of technological innovations. Pol and Ville (2009) discuss the concept of social innovation which in their definition is generally directed at improving the quality and/or quantity of life. Social and business innovation can overlap as business innovation, while mostly dealing with profitable new ideas, can also result in social value generation. Going forward, we conceptualize data-driven innovation as business innovation capable of positive economic and social impacts.
H6: Data-driven innovation positively affects value through generation of new knowledge, new processes, services and products, and new businesses.
Transparency
Most definitions of transparency recognize the extent to which an entity reveals relevant information about its own decision processes, procedures, functioning and performance. However, opening access to chosen public documents does not necessarily contribute to a transparent government (Gurstein, 2011; Yu and Robinson, 2012). A government can provide open data on politically neutral topics, even as it remains deeply opaque and unaccountable (Yu and Robinson, 2012). Accordingly, we cannot conclude that open access to government data is in itself a comprehensive measure of transparency. Rather, we propose that transparency is dependent on four enabling factors: openness (quantity of disclosed data, accessibility and ease of access), resource governance (through trustworthiness of data), capabilities (the general degree to which citizens are capable of accessing and interpreting the data) and technical connectivity (access to technologies used to disseminate and make sense of data).
In order to explain how the generative mechanism of transparency enables value generation, we can utilize the concept of Information Asymmetry. Information Asymmetry describes situations where one party has more or better information than another while participating in transactions, negotiations or communications. Information asymmetry can cause all sorts of sub-optimal results and behaviors, such as Moral Hazard, where the more informed make decisions to their own benefit, with the cost falling on others. Corruption (defined in the context of government as misuse of public power for private benefits) has long been seen as a hindrance to socio-economic development. Corruption has been shown to have negative effects on GDP growth, poverty, human development and health outcomes. It seems that corruption destroys a society’s social capital and has a very negative impact on people’s life satisfaction (see overview in Holmberg et al., 2009 and Rothstein, 2011). This is particularly true in developing, resource rich countries, where the politically elite often has control of resources and resource rents, as well as control over patronage and the distribution of resources, a situation known as the “resource curse” (Kolstad and Wiig, 2009).
A transparency agenda for tackling illicit financial flows (the hidden company ownership that makes such flows possible, land grabs, and the secrecy by which big oil, gas and mining corporations are doing business) was presented by the British Prime Minister, David Cameron, in the G8 meeting at the World Economic Forum held in Davos in January, 2012. The claim is that citizens in developing countries are regularly robbed of the benefits of their countries’ mineral wealth through poorly negotiated or corrupt
backroom deals. The G8 is leading efforts to require oil, gas and mining companies to publish key financial information for each country and project they work on. The aim is to ensure that revenues from oil, gas and mining can help developing countries to forge a path to sustainable growth, instead of fuelling conflict and corruption.
H7: Transparency positively affects value through decreased information asymmetry and less corruption.
Participation
Public participation allows members of the public to contribute ideas and expertise so that their government can make policies with the benefit of information that is widely dispersed in society. By this definition, participation provides citizens with a voice in government (Linders and Wilson, 2011). Public participation can take two discrete forms: 1) collecting opinions (citizen engagement) and 2) collecting ideas and solutions through crowdsourcing (Linders and Wilson, 2011). It has been argued that more involved democratic participation is likely to lead to superior social outcomes because of participation’s role in aggregating information and preferences (see for instance Barber, 1984). The relationship between participation and OGD is essentially twofold: In order for citizens to participate, either by voicing their opinions towards policy making or by participating directly in public projects, they must first learn about the particular issue that is being addressed, assimilating the facts and arguments. Second, they need a platform where they can make their contributions available. The evolution of citizen participation in public administration decision-making has been facing a new phase, as many government agencies have taken advantage of internet-based applications to communicate with constituents in order to provide online application services (Kim and Lee, 2012). The idea is to lower the barriers to participation for those willing-but-unable, and to make participation more attractive to those able-but-unwilling (Axelsson et al., 2010).
Participation mechanisms generate value through the synergies created from openness and sharing, allowing the public sector to draw from a larger pool of resources and to improve its ability to solve difficult social problems. The theory of collaborative advantage proposes that the real advantage from collaboration comes from something being achieved that could not have been achieved by any one of the participating stakeholders acting alone (Vangen and Huxham, 2010). A similar theoretical argument is used in the literature on Open Innovation (Chesbrough et al., 2006) where the principal idea is that an open approach to sharing knowledge across boundaries expands the firm’s innovative potential, as the firm is able to tap into a much larger pool of ideas and find such ideas faster. Therefore, collecting ideas and crowdsourcing difficult tasks should lead to improved ability to solve difficult social problems such as environmental degradation or disaster management.
A good example of citizen collaboration around the generation of data is the crowdsourcing activities that have been immensely helpful in a natural disaster such as the 2010 earthquake in Haiti (Lee and Kwak, 2011). Just a few hours after the earthquake, the OpenStreetMap (OSM) Community began tracing roads from imagery that was previously available from Yahoo, and within 48 hours, high resolution imagery taken post-earthquake became available from volunteers. Over the course of the next month, over 600 people contributed information to the OSM. OSM communities have continued to work with the Government of Haiti to further develop the OSM data.
H8: Participation positively affects value through improved problem solving resulting from participation and collaboration of citizens with government.
Measurements and data collection
We used several open secondary data sources for the variables in our study, described in the following subsection. All data were collected for the year 2011, except for the indicators from the United Nations E-Government Survey 2012 (E-Government online services index and Infrastructure index) which are from 2012. The sample collected included 61 observations from 61 countries, limited by the number of countries represented in the Open Data Index from the World Wide Web foundation (Farhan et al., 2012). All measures, sources and item wordings or descriptions of data can be provided if requested.
Operationalization of research variables
Providing OGD is a matter of availability, accessibility, format and license (Davies, 2010). We conceptualize openness as a formative construct that has four components: use of open licenses, extent of OGD initiative, availability of data, and accessibility of data. All measurements come from the Web Index survey (Farhan et al., 2012). The survey consists of a detailed questionnaire submitted to experts/professionals from 61 countries worldwide and assessed by national and regional peer reviewers (Annoni et al., 2012). The indicators are: Government use of open licenses, Extent of OGD initiative, Ease of access of government data, and Availability of government data, calculated from the scores of different questions determining the online availability of different types of government data. When testing the research model, we received some insignificant and even negative (Ease of access) weights for the formative indicators. We were interested in keeping all indicators, as they represent different dimensions of openness and, from a content validity perspective, it did not seem appropriate to eliminate any of them. Thus, we constructed a composite index from the average score of all indicators (see Cenfetelli and Basselier, 2009; Petter et al., 2007).
The Data governance construct is a formative variable with three dimensions that reflect: a) data management policies that affect the quality, relevance and usefulness of presented information, b) leadership within public sector and c) relevant skill-sets within the public sector. For the first indicator, we used the level-II sub-index from the United Nations Government Online services index, which reflects the general level of the quality, relevance and usefulness of online information (UN, 2012). In order to measure government leadership and motivation for using OGD and technology to initiate the mechanisms discussed earlier, we used three measures. The first two, Importance of ICTto government vision of the future and Government prioritization of ICT from the World Economic Forum (WEF) (see Schwab et al., 2011), are used to indicate whether the government in question has a clear e-Government strategy and is committed to keep using information and communication technologies to improve the overall competitiveness of a country. The third measure is Participation in Open Government Partnership (from the OGP website), a dummy variable used to indicate the government´s commitment to open government. Finally, to measure the technical skills within the public sector, we used an indicator from the World Wide Foundation that indicates the extent to which Government programs specifically focus on funding ICT training for their staff.
The Capabilities formative construct is based on three dimensions: equitable access opportunities, affordability and training. In order to measure attention to equitable dissemination of the resource, we created a measure based on data from World Wide Web Foundation which we call Web use by disabled people. This is based on the average score from seven different questions measuring the extent of effective and useful access to the web for people with different types of disability. To measure affordability, we use the indicator Affordability of web access (World Wide Web Foundation). In order to capture any kind of value from data, a measure of data related skills is needed (data management, data literacy, etc.). Therefore, we take the Extent of staff training (World Economic Forum) in different countries into consideration, reflecting the importance of vocational and continuous on-the-job training for ensuring a constant upgrading of workers’ skills.
Technical connectivity is a reflective construct that is composed of three dimensions: a) the availability of technical and telecommunications infrastructure in the country in question b) use of different platforms to disseminate and access data and c) the firm level availability of recent technologies. The indicators used are: 1) The United Nations Telecommunications Infrastructure Index; which is a composite weighted average index based on six basic infrastructural indicators that define a country’s ICT infrastructure capacity. These are: PC’s/1000 persons; Internet users/1000 persons; Telephone Lines/1000 persons; Online population; Mobile phones/1000 persons; and TV’s/1000 persons. 2) Accessibility of digital content, measuring accessibility of digital content via multiple platforms 3) Firm level Technology absorption (both from World Economic Forum´s Executive Opinion Survey, 2011-2012).
The adequate measurement of public sector efficiency is a difficult empirical issue, and there is scarce literature on the subject. However, some progress has been made by shifting the focus of analysis from the number of resources used by ministry to the services delivered or outputs achieved (Afonso et al., 2010). Quality adjustments do also present a challenge; if quality of outputs is not properly taken into account when measuring efficiency, an underestimation may result. We measure the efficiency construct based on
three different indicators, all reflecting some aspect of public sector efficiency and effectiveness of output. Our first indicator is ICT use and government efficiency from the World Economic Forum´s Global Competitiveness Report (Schwab et al., 2011). This indicator shows citizen’s perceptions of government efficiency as a result of digitization. The second indicator is the World Bank’s governance indicator
Government Effectiveness. This indicator aims to measure the quality of public service delivery by covering a broad range of related concepts: red tape, quality of public schools, government stability, bureaucrats’ expertise, policy consistency and ability to deliver basic infrastructure (Van de Walle, 2006). The third indicator is World Bank´s Ease of doing business index (International Bank for Reconstruction and Development). This indicator documents various efficiency and effectiveness impacts connected to the life cycle of business, such as the number of procedures to start a business, the time and cost of achieving a regulatory goal or complying with regulation and disclosure.
We model Innovation as a reflective variable with two indicators. For the first one, we used a measure from the World Wide Web Foundation that measures the direct effects of OGD on the creation of new products and services: Creation of new applications and services based on government data. However, anecdotal evidence shows how government data and other data are combined and analyzed, resulting in insight and knowledge that may lead to new technology-based innovations further down the value ecosystem (McKinsey, 2011). Therefore, we added a measure that reflects the development of new businesses: Business development based on the Web from World Wide Web Foundation.
The lack of shared meaning and understanding of the transparency concept has made it difficult to operationalize (Relly et al., 2009). A transparent government should be committed to disclosure, thus that there should be low levels of information asymmetry and corruption, and citizens should have the means to act upon corrupt behavior. For disclosure, we used Transparency of government policymaking from World Economic Forum (Schwab et al., 2011) combined with the existence of Freedom of Information Laws (dummy variable). To measure information asymmetry and corruption, we used Level of undocumented extra payments or bribes, based on the average score across five components of the following World Economic Forum´s Executive Opinion Survey questions: In your country, how common is it for firms to make undocumented extra payments or bribes connected with (a) imports and exports, (b) public utilities, (c) annual tax payments, (d) awarding of public contracts and licenses and (e) obtaining favorable judicial decisions. Finally, to measure citizen´s ability to act upon corrupt behavior, we used the indicator judicial independence from World Economic Forum.
Participation is a reflective construct, but we used only one indicator, the United Nations e-Participation Index, which measures 1) the use of the Internet to facilitate provision of information by governments to citizens, 2) interaction with stakeholders and 3) engagement in decision-making processes (UN, 2012). A country’s e-participation index value reflects how useful these features are and how well they have been deployed by the government, compared to all other countries. The reason is that other measures of participation are typically measures of democracy and therefore too broad to capture the type of participation that is derived from the combined effects of data, openness and use of technology.
Value (or social welfare) is conceptualized as an aggregate measure of social and economic value. The challenges of constructing a global measure of welfare by using composite indicators are a much-discussed theme (Eisler, 2007; Stiglitz et al., 2009). In particular, we need to identify the key indicators and then determine the way in which these indicators can be brought together to make a coherent system. Structural Equation Models and specifically the PLS has been recommended as a means to model the statistical relations between such indicators (Trinchera and Russolillo, 2012). We follow Stiglitz et al. (2009) who recommended the following sub-indicators to measure total welfare: i. Material living standards; ii. Health; iii. Education; iv. Personal activities including work v. Political voice and governance; vi. Social connections and relationships; vii. Environment; and viii. Insecurity of an economic, as well as a physical, nature. We follow these recommendations with one exception: As our construct is reflective and as we assume that our indicators reflect the existence of a certain level of aggregate welfare or value, we do not use political voice and governance, which indicate means rather than ends. Moreover, as Gallup´s Global Wellbeing index (Gallup, 2011) measures daily experiences (well-rested, shown respect, smiling/laughter, learning/interest, enjoyment, physical pain, worry, sadness, stress, and anger). We use it to reflect three of the dimensions: personal activities, social connections and relationships, and insecurity. Other reflective indicators are: 1) for economic performance, GDP/capita from the World Bank; 2) for health: UN´s Human Development Index, health sub-index; 3) for education, UN´s Human
Development Index, education sub-index and 4) for environment, the natural resource management index (Center for International Earth Science Information Network, 2011).
Analysis and findings
We used the plspm-package for the open-source software R (Sanchez, 2013). The method chosen was partial least squares (PLS), as our research is exploratory due to the emergent state of the phenomenon and we have no prior models to confirm or test. Other reasons for using the PLS-method are the use of formative constructs, the small sample size, the complexity of the structural model and the wish to identify key drivers (Hair et al., 2011; Hair et al., 2012, Ringle et al., 2012). Since PLS is based on a series of OLS regressions, it has minimum demands regarding sample size, and generally achieves high levels of statistical power (Hair et al., 2011). A common rule of thumb regarding sample size in PLS is to use ten observations per predictor, where the sample size is the largest of two possibilities: 1) the block with the largest number of indicators or 2) the dependent variable with the largest number of independent variables impacting it (Chin, 1998; Hair et al., 2011; Marcoulides and Saunders, 2006). In our case, constructs are made from a maximum of five indicators, and value has the largest structural equation with four direct paths pointing towards it.
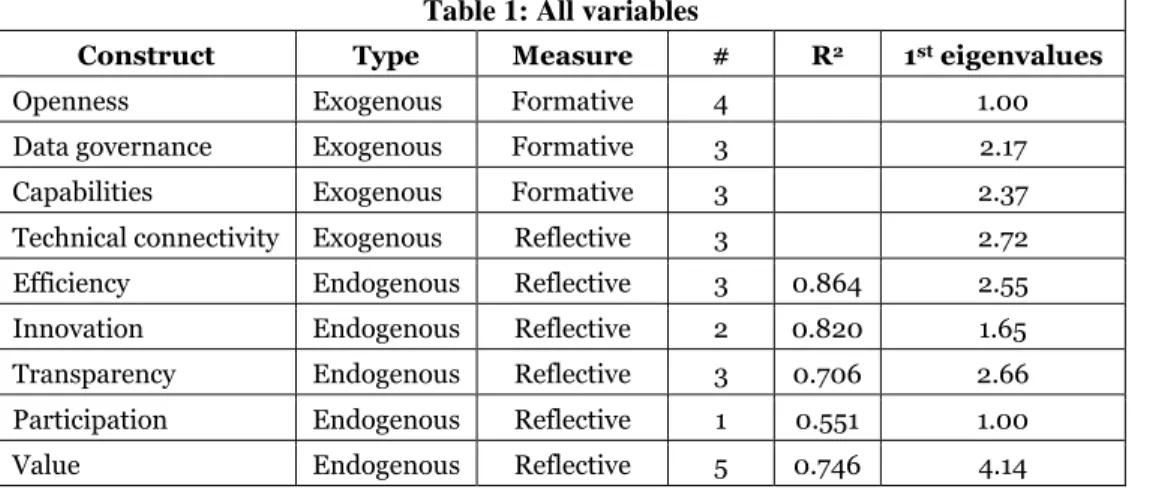
Table 1: All variables
Construct Type Measure # R2 1st eigenvalues
Openness Exogenous Formative 4 1.00 Data governance Exogenous Formative 3 2.17 Capabilities Exogenous Formative 3 2.37 Technical connectivity Exogenous Reflective 3 2.72 Efficiency Endogenous Reflective 3 0.864 2.55 Innovation Endogenous Reflective 2 0.820 1.65 Transparency Endogenous Reflective 3 0.706 2.66 Participation Endogenous Reflective 1 0.551 1.00 Value Endogenous Reflective 5 0.746 4.14
However, as Marcoulides and Saunders (2006) point out, it is necessary to consider other characteristics of the data and model in order to ensure sufficient sample size to achieve adequate statistical power. First, we built the research model according to the current knowledge, and then collected data to test the model. Next, we performed data screening. All sources had a good reputation, and the same methodology was applied to all countries for each indicator. Missing data or departures from normality influence sample size requirements of a study and potentially deteriorate power (Marcoulides and Saunders, 2006). There were no missing data and all rows showed a reasonable degree of normality (kurtosis < |1.5|, skewness <|1| except for GDP pr. capita where it was 1.22, which we solved by converting GDP to a logarithmic scale. Based on Marcoulides and Saunders (2006), it seems that a sample size of 61 gives adequate power to draw inferences for this particular model, as both factor intercorrelations and factor loadings are high; however, we have to consider that the small sample size might affect the results. More countries will be included in the next version of the Web Index (2012), and when this version becomes available, we can retest the model with a bigger sample.
We used bootstrap validation for loadings, weights and paths with 500 bootstrap samples, for which the number of cases was 100, approximately equal to the number of observations (Hair et al., 2011). All measures were standardized before running the algorithms. One of the concerns with formatively measured constructs is multicollinearity across the indicators of each constructs. High first eigenvalues can be an indicator of multicollinearity; however, all formative variable´s first eigenvalues are lower than three. All Variance Inflation Factors (VIFs) were below the recommended 5.00 value (Hair et al., 2011). We checked for insignificant or negative weights (Centefelli and Bassellier, 2009; Petter et al., 2007), but all weights were significant and positive.
Table 2: Loadings, weights and significance and VIF´s for formative constructs
Construct Item Loading Weight t-value VIFs
Openness Summated scale 1.000 1.000 Resource governance Data governance 0.903 0.518 6.34*** 1.80 Leadership 0.847 0.369 4.87*** 1.82 Skills 0.783 0.281 2.79*** 1.66 Capabilities Equitability 0.855 0.219 3.15*** 2.65 Affordability 0.910 0.454 4.61*** 2.64 Training 0.884 0.452 6.45*** 1.87 *p<0.1, **p<0.05, ***p<0.01
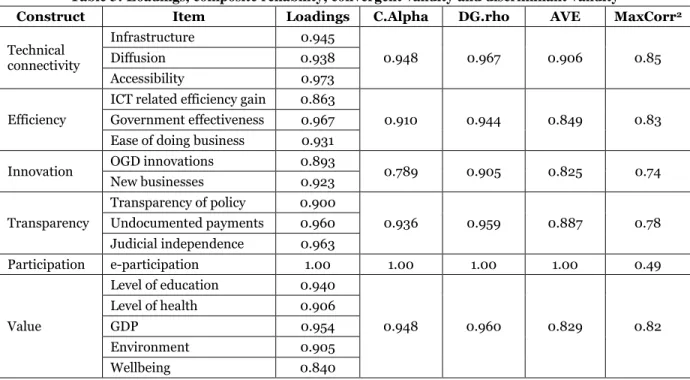
To evaluate the reflective measures in our model, we followed the recommendations of Hair et al. (2011). Table 3 presents the results of these quality measures. Hair et al.’s advice regarding internal consistency reliability is that composite reliability should be higher than 0.70 (in exploratory research, 0.60 to 0.70 is considered acceptable). For indicator reliability, they recommend that indicator loadings be higher than 0.70. For convergent validity, the rule of thumb is that the average variance extracted (AVE) should be higher than 0.50. Finally, for discriminant validity, two different test are recommended: 1) the AVE of each latent construct should be higher than the construct’s highest squared correlation with any other latent construct (Fornell–Larcker criterion) and 2) an indicator’s loadings should be higher than all of its cross loadings, which is valid for all items.
Table 3: Loadings, composite reliability, convergent validity and discriminant validity
Construct Item Loadings C.Alpha DG.rho AVE MaxCorr2
Technical connectivity Infrastructure 0.945 0.948 0.967 0.906 0.85 Diffusion 0.938 Accessibility 0.973 Efficiency
ICT related efficiency gain 0.863
0.910 0.944 0.849 0.83 Government effectiveness 0.967
Ease of doing business 0.931
Innovation OGD innovations 0.893 0.789 0.905 0.825 0.74 New businesses 0.923 Transparency Transparency of policy 0.900 0.936 0.959 0.887 0.78 Undocumented payments 0.960 Judicial independence 0.963 Participation e-participation 1.00 1.00 1.00 1.00 0.49 Value Level of education 0.940 0.948 0.960 0.829 0.82 Level of health 0.906 GDP 0.954 Environment 0.905 Wellbeing 0.840
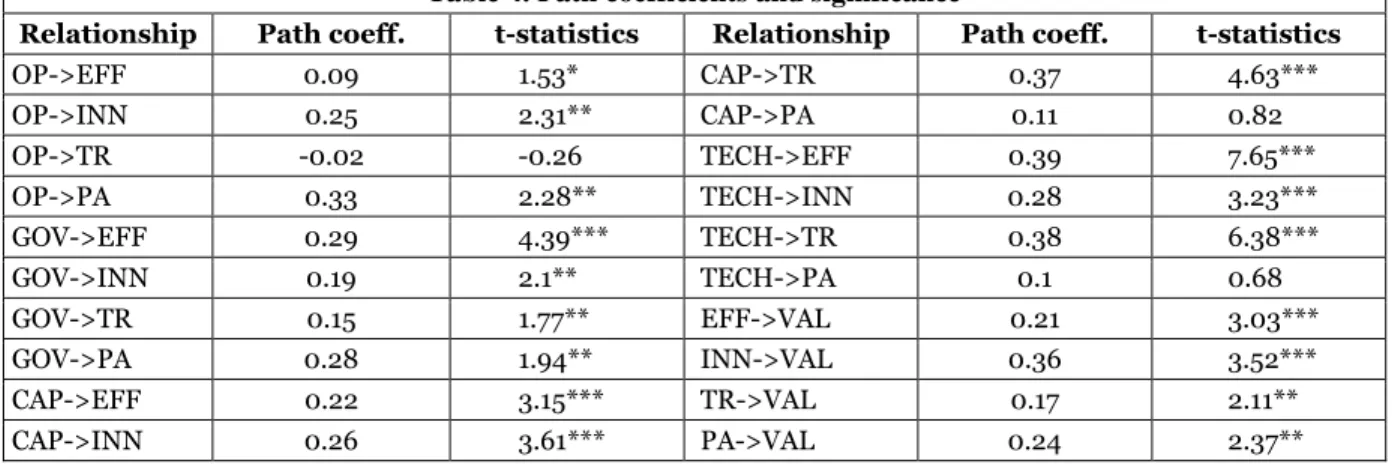
The results from the pls-analysis are presented in Table 4 and Figure 2. We cannot conclude that openness positively influences efficiency of government (H1a), as the path is only significant at p < .1. While we see a reason for concern regarding the existence of this relationship, more evidence is needed before we conclude that there is no relationship between openness and efficiency and effectiveness of government. There are four alternative explanations for the insignificance of this relationship: 1) Data related issues: The indicators we used for openness are from the first issue of the Open Data Index (World Wide Web Foundation), and data collection methods are currently being reviewed (Annoni et al., 2012). The model will be re-tested when new data become available. 2) Sample size: With only 61 countries to test, the small sample size can lead to low accuracy of estimates and decreased statistical power. Low statistical power increases the probability of a Type II error and could lead to us failing to reject a false null hypothesis, falsely concluding that there is no relationship between openness and government
efficiency. Again, the model will be retested when data for more countries become available. 3) Misspecification: Misspecification of the model can also lead to a Type II error. 4) Time effect: Due to the embryonic state of most OGD initiatives and lack of anecdotal evidence on efficiency gains from OGD, the effects from openness might not yet have materialized.
Table 4. Path coefficients and significance
Relationship Path coeff. t-statistics Relationship Path coeff. t-statistics OP->EFF 0.09 1.53* CAP->TR 0.37 4.63*** OP->INN 0.25 2.31** CAP->PA 0.11 0.82 OP->TR -0.02 -0.26 TECH->EFF 0.39 7.65*** OP->PA 0.33 2.28** TECH->INN 0.28 3.23*** GOV->EFF 0.29 4.39*** TECH->TR 0.38 6.38*** GOV->INN 0.19 2.1** TECH->PA 0.1 0.68 GOV->TR 0.15 1.77** EFF->VAL 0.21 3.03*** GOV->PA 0.28 1.94** INN->VAL 0.36 3.52*** CAP->EFF 0.22 3.15*** TR->VAL 0.17 2.11** CAP->INN 0.26 3.61*** PA->VAL 0.24 2.37** *p<0.1, **p<0.05, ***p<0.01
We can support the hypothesis that openness positively influences innovation mechanisms (H1b). If we look at the responses from the Creation of new services based on government data survey question (World Wide Web Foundation), we can see that many countries already report that there has been extensive development of new web applications and services based on government data. Surprisingly, we cannot support the hypothesis that openness positively influences transparency mechanisms (H1c). This result gives an indication that opening access to data has not (yet) helped governments to become more transparent. Rather, citizens might object to what they consider to be a cosmetic appearance to transparency. Other actions have to follow to convince citizens that transparency is really a priority of the government in question. Finally, we can support the hypothesis that openness positively influences participation mechanisms (H1d). The relationship is strong and significant, remaining robust against changes in the model during the testing phase. Thus, we can support the sentiment that citizens in countries with openness participate more, especially through government websites.
All value generation mechanisms are positively influenced by resource governance (H2a-H2d). This indicates how important it is that the public sector enjoys leadership and is highly motivated by openness. Furthermore data management policies and the necessary technical skills are important. The quality of the data is of course extremely relevant, as can be seen from the high absolute weight this indicator receives. Capabilities positively influence efficiency, innovation and transparency, but we cannot support H3d, namely, that capabilities positively affect participation. This lack of relationship is surprising, but remained robust to changes in the model in the analysis phase. The most likely explanation is that we used only one measure for participation, and UN´s e-Participation index has been subject to some criticism for being too supplier oriented in the past.
All generative mechanisms except one, are positively influenced by technical connectivity (H4a, H4b and H4c). We could, however, not accept H3d. This again is surprising, given that e-Participation is defined as participation via government websites, indicating a dependency both on technical availability and capabilities. However, openness and resource governance both have a strong positive relationship with participation. Currently, only 40 per cent of 193 UN member states are leveraging social media for the benefit of e-service uptake, indicating a lack of use of pervasive technologies for participation purposes (UN, 2012). This might explain why the results indicate that the variance in public participation between countries is not explained by the general availability of technology nor the general capabilities in society to use technology. Rather, the willingness of the public sector to be open might indicate a more positive attitude towards participation and thereby encourage people to use whatever participation options there are to make their views and opinions available. As noted earlier, to increase participation, societies need to attend not only to those willing-but-unable but also to those able-but- unwilling.
Figure 2: Measurement model based on Partial Least Squares analysis
*p<0.1, **p<0.05, ***p<0.01
The path from efficiency mechanisms to value (H5) shows the expected positive and significant coefficient. Innovation mechanisms also positively affect value (H6), where the path has both high absolute value and is highly significant. This supports earlier findings showing the general importance of innovation for societies and more specifically highlights the importance of data-driven innovation for generating value from OGD. As expected, transparency positively influences value, supporting earlier research that shows the disruptive effects of information asymmetry and resulting corruption. Participation mechanisms also positively influence value (H8). Currently, one quarter of all UN member countries publicly commit to considering the results of e-participation in the policy-making process (UN, 2012), indicating a growing focus on the value generation possibilities of participation.
Table 5: Effect sizes
Efficiency Innovation Participation Transparency 0.006 (weak) 0.146 (moderate) 0.111 (moderate) 0.028 (weak)
We checked the effect of each of the value generation mechanisms on Value by comparing the R2 for the
value construct with, and without, the variable in question, using Cohen´s f2 measure (Polites and
Karahanna, 2012). While participation and innovation show moderate effect sizes, efficiency and transparency both have a weak effect on Value. However, while the effect size is small, the total effect of each of the measure's efficiency and transparency is moderate, indicating that these are still important variables to consider in predicting value generation from OGD. These results indicate that efficiency and transparency in some way substitute each other as the effect size when both variables are removed is 0.15 (moderate). In a way, both efficiency and transparency have the ability to improve the public sector´s resource allocation, the first through reduced transaction costs and the second through reduced information asymmetry.
Discussion
resource that offers the ability to increase social welfare through the generation of economic and social value. This value generation happens through a complicated network of mechanisms where the public sector, private companies, civil society and citizens all contribute to the transformation of OGD to value. While the mechanisms operate in very different ways, they are all dependent on certain factors that affect the use and usability of the data as a resource. Due to these common factors, certain synergies might arise between the mechanisms. We can support most of the hypotheses we set forth, indicating that openness, resource governance, capabilities and technical connectivity are all important enabling factors for the system of mechanisms, while not all of them have significant influence on all the mechanisms. We can also support that all four mechanisms of efficiency, innovation, transparency and participation positively affect value.
We find that OGD has the ability to increase efficiency through decreased transaction costs. For instance, offering citizens the ability to access information via web-platforms can reduce the administrative burden of Freedom of Information (FOI) enquiries (Halonen, 2012) and openly sharing information across levels of government reduces search costs and eventually the need to re-produce data. We can statistically verify this link as the path from the efficiency construct to the value construct is significant and moderately high in absolute terms (0.21). We have also seen evidence of companies using OGD for innovative purposes and generating value, not only in monetary terms but also social value. One example is the combination of open geographic data with open data on drug prescriptions in the UK (http://www.prescribinganalytics.com). The visualization created from these data revealed potential savings for the National Health Service in UK of around £200 million pounds per annum, if two thirds of proprietary (expensive) statins were substituted with generic (inexpensive) versions of the same drugs. Another example is OPower, a global company, specializing in energy efficiency. They have used open data on average energy consumption patterns and big data from smart meters in homes to generate reports intended to influence consumer´s energy use. Due to these reports, 15 million homes around the world have saved over 2.7 terawatt hours of energy over the last 6 years. Our statistical analysis supports the impact of data-driven innovation on value, the path coefficient was 0.36 and statistically significant. Our results indicate that open governments value the opinions of their citizens when planning policies that influence economic growth, wellbeing, health, education and the environment and that where citizens have the opportunity to participate, the impact of those policies are improved. There is a highly significant path from the openness construct to participation (0.33) and from participation to value (0.24), supporting this link. Finally, as transparency in government is often conceptualized as open access to government data, openness of data is generally assumed to bring transparency. However, as Yu and Robinson (2012) have pointed out, governments can remain opaque even if they drastically increase technical access to data, for instance if these data-sources are not relevant for policy analysis. We conceptualized transparency as a mechanism that reduces information asymmetry and therefore adverse selection, leading to less corruption. When conceptualized this way, we cannot confirm any link between openness and transparency. While it is too early to conclude that openness (conceptualized as increased access to government data) does not influence transparency at all, we can propose that increased openness does not automatically lead to increased transparency and there are other issues like governance, capabilities and technical connectivity that seem very relevant to the concept of transparency.
Limitations and implications
Our study is exploratory due to the embryonic state of OGD research, and our aim was theory generation rather theory testing or confirmation. Our results have various limitations for several reasons. The sample size is small, although we have reasonable evidence to believe that the model contains enough power to draw conclusions from results. However, a bigger sample would allow us to generate more accurate results. All data on openness were taken from the Open Data Index, which was constructed for the first time in 2012 (data representing 2011). The World Wide Web Foundation that collects the data is aware of some limitations regarding methodology and is working on an improved version, which will also include more countries (Annoni et al., 2012). Comparing impacts from OGD between countries, where in many cases OGD initiatives are in their infancy, might be premature; however, we feel that our research model gives a good indication of relationships, as a basis for future research. Furthermore, most of the constructs in the study are new and need to be further validated in the future. Many of the concepts discussed are highly complex, and there still has been no consensus on how to measure many of them.