Mining Pattern from Road Accident Data: Role of Road
User’s Behaviour and Implications for improving road
safety
Tibebe Beshah1, Dejene Ejigu1,Ajith Abraham2, Vaclav Snasel2, Pavel Kromer 2 1
IT Doctoral Program, Addis Ababa University Addis Ababa, Ethiopia.
[email protected]; [email protected]
2 Department of Computer Science, VSB-Technical University of Ostrava Ostrava, Czech Republic
[email protected], [email protected], [email protected]
ABSTRACT
At the heart of any strategic effort to address a nationwide problem there is data or information. This research tries to view accident data collection and analysis as a system that requires a special view towards understanding the whole and making sense out of it for improved decision making in the effort of reducing the problem of road safety. As part of an information architecture research for road safety data/information management in developing countries, the objective of this machine learning experimental research is to explore and predict the role of road users on possible injury risks. The research employed Classification and Adaptive Regression Trees (CART), TreeNet and RandomForest approaches. To identify relevant patterns and illustrate the performance of the techniques for the road safety domain, road accident data collected from Addis Ababa Traffic Office is used. After collecting the data and format it in the way suitable for the tool used model building and evaluation through prediction success and error rate were the major tasks. Interpretation of the result and recommendation was also made. Empirical results showed that the models could classify accidents with promising accuracy.
Keywords: Road Safety, Road Accident, RandomForest, CART, TreeNet
1. INTRODUCTION
A nation’s socio-economic development is highly dependent on the health status of its citizens. Road safety, which is mainly affected by road accidents, is said to be one of the major national health concerns. The burden of road accidents causalities and damage is much higher in developing countries than in developed nations. Ethiopia is one of the developing countries where road accidents are major problems of road safety. Road safety improvements can be achieved within the three components of the road safety system through changes in infrastructure design (which includes roads and road signs), vehicle safety, and road user behaviour (driver, pedestrian, passengers) [1]. This paper employed three machine learning methods and algorithms in road safety analysis which permits to identify patterns and factors to the three components and more particularly to the road user behaviours.
[Formerly known as “International Journal of Tomography & Statistics” (ISSN 0972-9976; 0973-7294)];
Copyright © 2013 by CESER PUBLICATIONS
www.ceser.in/ijts.html www.ceserp.com/cp-jour
Descriptive analysis of the magnitude and situation of road safety in general and road accidents in particular is important, but understanding of data quality, factors related to dangerous situations, and different interesting patterns in the data, is of even greater importance. This gives a big picture of the scenario instead of a fragmented effort to address an aspect of it. Our research is inspired by previous works on the domain and the versatile applicability of machine learning paradigm, which will add on the ongoing effort of reducing road safety problem.
Under the umbrella of information architecture research for road safety improvement in Ethiopia, the result of a situational analysis made in three selected regional administration, exhibited that accident analysis in general is at its immature level, which prohibits the effort of discovering relevant knowledge for decision making, from the accumulated data.
This paper reports on a part of a greater research project that aims to better understand data quality issues in general, road users factors, accident factors, accident types, vulnerable groups, vehicle role on accident, and injury risk. More specifically, the objective of this machine learning experimental research is to explore and predict the role of road users’ (pedestrians, drivers and victims) related factors on possible injury risks.
To the author’s knowledge, this work is unique in the machine learning approaches used, comprehensiveness with respect to road users, time coverage of the analyzed data set used and the actual observation of the road safety related issues. We believe that identifying and describing hidden patterns in accident data in form of innovative classification, visualization, and association rules is very understandable for road safety experts to make important sound decisions.
The remaining part of the paper is organized as follows. In Section two, review of literature pertinent to the central theme of the research is presented while the third Section provides details on the research process, approach and data set description. The experiments and output of the research are presented in the fourth Section, which is followed by a conclusion and indications of the future work.
2. BACKGROUND AND RELATED WORKS
In line with the scope of the research, attempt has been made to assess the existing accident analysis practice at the three selected regional administrations in Ethiopia. Generally the result revealed that currently no such analysis is actually being done at the Gambela region (South West part of Ethiopia) while limited descriptive analysis is practiced at Amhara (North West part of Ethiopia) and Addis Ababa (Central Part of Ethiopia) regions. However, though they lack systemic approach, there were some fragmented efforts to show the application of data mining techniques on road safety analysis domain. Tibebe, Abraham and Grosan [2] used adaptive regression trees in their rule mining and classification of road traffic accidents, which provides a foundational work on severity analysis in Ethiopian context. The results according to the authors, shows that the developed models could classify accidents severity within reasonable accuracy.
Zelalem [3] explored classification algorithms for the study of accident severity and driver characteristics. The study focused on predicting the degree of driver’s responsibility for car accidents. The research used WEKA data mining tool to build predictive models and identify important relationships between variables that influence driver’s degree of responsibility such as; age, license grade, level of education, driving experience, and other environmental factors. Accuracies of the models were 88.24% and 91.84%. In addition, the research reveals that, the decision tree model is found to be more appropriate for the problem type under consideration. With a different approach, Haleluya [4] explored the application of data mining to identify dangerous locations in Addis Ababa.
In another study, Getnet [5] demonstrated data mining models for accident severity analysis in support of reducing road traffic accidents by identifying and predicting the major vehicles and drivers’ determinant risk factors (attributes) that cause road traffic accidents. The research uses decision tree and rule induction techniques using WEKA. The result of the research proves that the performance of J48 algorithm is slightly better than PART algorithm and it identified LicenseGrade, VehicleServiceyear, Typeofvehicle and experience as most important variables to predict accident severity pattern.
Bayesian Network power predictor and constructor was employed by Alemayahu [6] for prediction and model construction purpose respectively in the process of two experiments which were made before and after the elicitation of the domain experiments. According to the first experiment, type of accident is directly influenced by four factors namely; license grade, time and cause of accident, and driver experience with the accuracy of 87.96%. In the second experiment (after elicitation of domain experts) the best accuracy was 80.28% and type of accident is highly influenced by weather condition, road joint and type of vehicles. Tibebe and Shawndra [7] utilized Decision Tree (J48), Naive Bayes and K-Nearest Neighbours algorithms to explain the role of road related factors for severity. The result shows that all the three classifiers perform well similarly with respect to correctly classified cases. A PART algorithm was also used to generate user understandable rule with the accuracy of 79.94%. The authors propose further investigation by combining different factors like road and driver related variables.
While the works mentioned above were specifically targeted on attempts in applying machine learning in a road safety domain in a local context, there are also other efforts in employing different methods and tools for better understanding of the domain and accuracy worldwide. Janecka and Hulova [8] conducted an experiment using spatial data mining to discover the hidden rules in the crime data collected in Czech Republic in the year 2008. Oracle data miner along with Apriori algorithm was used for identifying hidden relationship and association rules in the crime data in the form IF A AND B THEN C. The result shows that the situation about the crime perpetrated by youth differs from region to region.
Krishnaveni and Hemalatha [9] also conducted a perspective analysis of traffic accident data using data mining techniques. The study deals with some of classification models to predict the severity of injury that occurred during traffic accidents. Naive Bayes Bayesian classifier, AdaBoostM1, Meta classifier, PART Rule classifier, J48 Decision Tree classifier and Random Forest Tree classifier were compared for classifying the type of injury severity of various traffic accidents. According to the authors, the final result shows that the Random Forest outperforms than other four algorithms. An application of Factor Analysis on Road Traffic Accident was explored by Haixia and Zhihong [10]. The paper analyzes the causes of 372 traffic accidents that occurred in China by factor analysis. According to the authors, five main factors are extracted through the research process and corresponding explanations are given, which can provide not only strategic support for traffic control department, but also some warnings to perpetrators.
Saunier, Mourji and Agard [1] investigated collision factors by mining microscopic data (road user’s trajectories) about all traffic events with and without a collision. A free and open source tool, TANAGRA, was used to conduct the experiment on video recordings of traffic conflicts and collisions collected at one signalized intersection Decision tress, the K-means algorithms and hierarchical agglomerative clustering methods were employed to analyze the data. The research revealed that decision tree confirms the importance of the evasive action in interaction out comes.
Another study by Nayak et al [11] presented a data mining methodology using decision trees for modeling the crash proneness of road segments. The models quantify the concept of crash proneness and demonstrate that road segments with only a few crashes have more in common with non-crash roads than roads with higher crash counts. They also examine ways of dealing with highly unbalanced data sets encountered in the study. Pakgohar et al [12] explored the role of human factors on incidence and severity of road crashes in Iran. The study explains drivers’ responsibility on an occurrence of an accident. Accordingly, the result of the study indicates the important role of human factor such as “Driving License” and “Safety Belt” in severity of accidents in Iran. The study employed descriptive analysis from which Logistic Regression, Classification and Regression Tree were used.
Computational intelligence methods for information understanding and management were presented by Duch, Jankowski, and Grabczewski [13]. The major software tool used was DataMiner. In addition to that, a large library written in C++, called InfoSel++, implementing different methods for feature selection, has been developed. As reported by the authors, the methods are based on information theory, distance between probability distribution, and statistical approaches. The authors also indicated that, dimensionality reduction based on Multidimensional scaling (MDS) is another unexplored technique. It is an algorithm basically for data visualization.
Another worth mentioning work in the area was conducted by Pei Liu [14]. He studied a self-organizing feature maps and data mining based decision support system for liability authentications of traffic crashes in Taiwan. Through the study, the author develops a decision support tool for liability authentications of two-vehicle crashes based on generated self-organizing feature maps (SOM) and data mining (DM) models. According to the author, although with small data size, the decision support system was considered capable of giving reasonably good liability attributions and references on given cases.
Thus from the survey of literatures made and to the knowledge of researchers, there looks to be no other same research made to disclose the role of road user’s (drivers, pedestrians and victims) behaviour in accident severity in Ethiopia.
3. TOOLS, METHODS AND MATERIALS
This part of the paper discuses the data set, tool and algorithms used for attribute selection, dimensionality reduction, and classification.
3.1 The Data Set and Tools used
This study used data obtained from Road Traffic Office at Addis Ababa, Ethiopia. The total dataset for the study contains traffic accident records from 2004/5-2008/9. Based on the availability of data a total number of 14,254 accident cases described with 48 attributes were used. The dataset has information related to road users (drivers, pedestrians and passengers), vehicles and road.
The machine learning tool used is Salford Predictive Miner v.6.6 (SPM) a newly developed software suite by Salford Systems, which includes four major predictive model building methods called CART, RandomForest, MARS and TreeNet [16].
3.2 Methods
To conform - the industry-standard process, the machine learning methodology used was guided by the CRISP-DM (Cross-Industry Standard Process for Data Mining) process framework. Accordingly, based on situational analysis on the case study, business and data understanding were the first tasks. Then follows pre-processing and feature/attribute selection tasks relevant to the data mining goal identified. Model building and evaluation along with a possible recommendation to integrate the resulted pattern or knowledge with the existing one is the last stage. Accordingly the researcher’s previous experience in the area and onsite observations made helped to get the business and data understanding. Then the data in relational data format was formatted and used for the experiment. A number of experiments were conducted by focussing on the relevant attributes to the objective of the paper. Evaluation and interpretation of the results were also made.
With respect to the tool and techniques, as this is a report of an ongoing research project, an attempt has been made to use three of the available predictive modelling methods, CART, TreeNet and RandomForest, in the SPM suite. A brief description of the three methods is presented as follows. 3.2.1 CART Methodology
As explained by Gey and Nédélec [15] Classification and Regression Trees (CART) is a robust decision-tree tool for data mining, pre-processing and predictive modelling tasks. CART can analyze complex data for patterns and relationships and uncovering hidden structures. Moreover, CART is a nonparametric technique that can select variables from a large data set and their interactions that are very important in determining the outcome variable to be analyzed. Some of the major advantages of CART, as described by Salford Systems [16], includes faster training time, its ability to use raw data (no need to transform or prepare the data), automatic handling of missing values, automatic handling of categorical (nominal) predictors, handling very large numbers of predictors, and ability to handle very large training data files.
An important feature of a CART analysis include a set of rules for splitting each node in a tree; deciding when a tree is complete; and assigning each terminal node to a class outcome. CART always base on - questions that have a ‘yes’ or ‘no’ answer to split a node into two child nodes; the yesanswers to the left child node and the noanswers to the right child node to grow trees [17]. 3.2.2 RandomForest Method
As cited by Krishnaveni and Hemalatha [9], Miaou and Harry[18] described random forest consisting of a collection of tree structured classifiers (h(x, _k), k = 1…) where the _k are independent identically distributed random vectors and each tree casts a unit vote for the most popular class at input x. A Decision Tree Forest (DTF) is an ensemble (collection) of decision trees, which the combination of predictions contributes to the overall prediction for the forest. A decision tree forest grows a number of independent trees in parallel, and those trees do not interact until after all of them have been built. Decision tree forest models often have a degree of accuracy that cannot be obtained using a large, single-tree model [17]. Its ability to handle thousands of input variables with out variable deletion, along with quick learning process and its effective method for estimating missing data and maintains accuracy are major sited attributes of this algorithm.
3.2.2 TreeNet Method
TreeNet (TN) is a robust multi-tree technology for data processing and predictive data mining. Being a result of the implementation of Jerome Friedman’s MART methodology, TreeNet method offers very
good accuracy and speed, along with a high degree of fault tolerance for noisy and incomplete data [19].
A number of key features characterise TreeNet model. Some of the major features include automatic variable subset selection; ability to handle data without pre-processing; resistance to outliers; automatic handling of missing values; robustness to dirty and partially inaccurate data; high speed; and resistance to over-training [20]. A TreeNet model can be thought as a series expansion approximating the true functional relationship to increase accuracy progressively [16]. The expansion can be written as;
F (X) = F0+ 1 T1(X)+ 2 T2(X)+…+ M TM(X)
where Ti is a small tree. Each tree refines and improves its predecessors. TN models are typically composed of hundreds of small trees, each of which contributes a slight refinement to the overall model.
4. EXPERIMENTS AND RESULTS
Data preparation or pre-processing is always important in a machine learning and pattern recognition process. Though there are various types of pre-processing tasks like handling missing values, minimizing noises, dimensionality reductions, attribute aggregations, feature creation, discretization and binarization, attribute transformation, sampling and feature selection, given that this is a work in progress, the first attempt was to expose the data for pattern identification and knowledge discovery with a minimum pre-processing tasks.
Accordingly, the data which was in a relational database format is first exported in to a single table format of excel sheet. This is mainly because the SPM [16] tool supports a single table data format for processing. In addition, it was also necessary to translate the data from local language, Amharic, in to English for better readability using the filter facility of Ms-Excel application. Moreover, removal of some attributes for ethical reason and their unnecessary nature in the process of pattern identification and attribute creation through aggregation of attribute values of injury severity exposed a total of 45 features for many sided analysis.
4.1 Model Building
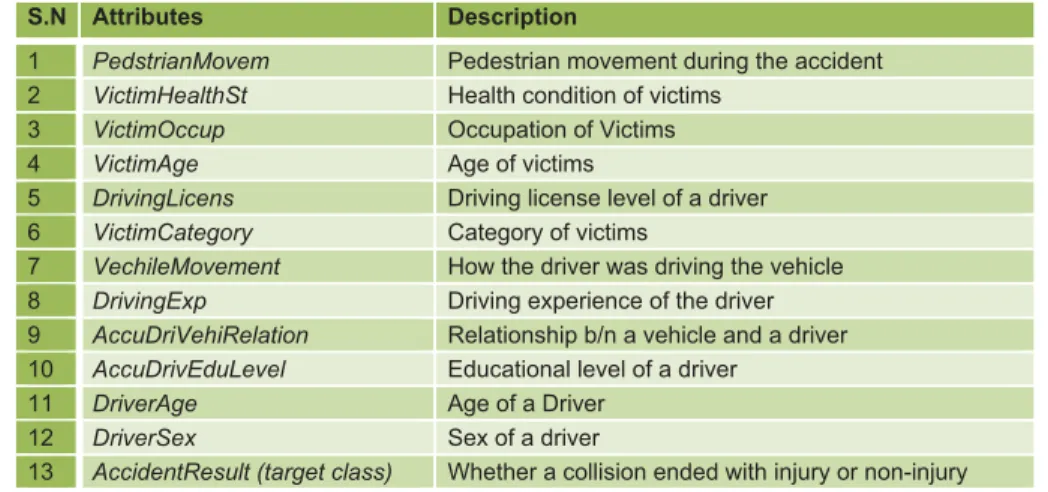
The first task of the experiment was to understand and heuristically identify attributes or features related to the goal of the machine learning task which will obviously be evaluated by the machine learning process through attribute selection. The best explanation of the data obviously depends on the type of the problem, intention of users, as well as the type of questions and explanations that are commonly accepted in a given domain [13]. Thus given the data mining task mentioned above, 12 road user-related attributes are selected initially as possible predictors, being accident collision result a target class. The target class has two possible values; Injury and Non-Injury. Descriptions of the attributes are presented in table I.
TABLE I. LIST AND DESCRIPTION OF POSSIBLE PREDICTORS
S.N Attributes Description
1 PedstrianMovem Pedestrian movement during the accident
2 VictimHealthSt Health condition of victims
3 VictimOccup Occupation of Victims
4 VictimAge Age of victims
5 DrivingLicens Driving license level of a driver
6 VictimCategory Category of victims
7 VechileMovement How the driver was driving the vehicle
8 DrivingExp Driving experience of the driver
9 AccuDriVehiRelation Relationship b/n a vehicle and a driver
10 AccuDrivEduLevel Educational level of a driver
11 DriverAge Age of a Driver
12 DriverSex Sex of a driver
13 AccidentResult (target class) Whether a collision ended with injury or non-injury
4.2 CART Analysis Result
While running the CART analysis, the attribute selector module identifies PedstrianMovem, VictimCategory, VehicleMovement, VictimOccup, VictimAge, DrivingLicense, DrivingExp and VictimHealSt variables as important predictors of the target class injury result (risk). With the intent of finding the best prediction, a number of experiments have been done by trying different constraints and parameters. Accordingly, given the purposeful low level of pre-processing done, using these variables with major model specification like 10 fold cross validations for testing, and automatic best predictor discovery, the accuracy of the predictive model is promising. As this experiment uses a real world data, where target class imbalance is common, a mechanism called PRIORS EQUAL is used in this specific experiment. This is a facility to provide equal probability for all categories. Road user factors like pedestrian movement, victim’s category and victim age are found to be determinant whether an accident ends with injury or not, and it can be seen from major splitters as illustrated in Figure 1 below.
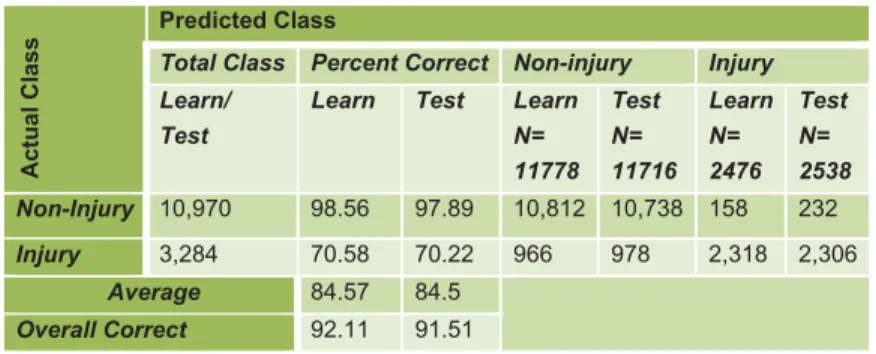
The overall prediction success, which is a percentage of correctly classified against the total data set, is 92.11% for learning set while 91.51% is for testing set. It is also visible that the prediction accuracy for non-injury class is better than the injury class in both learning and testing sets. The detail is shown in Table II. It is obvious that in such kind of experiment the accuracy of learning process is better, which also has been in this specific experiment reported here.
TABLE II. LEARNING AND TESTING PREDICTION SUCCESS TABLE (CART ANALAYSIS)
Actual Class
Predicted Class
Total Class Percent Correct Non-injury Injury Learn/
Test
Learn Test Learn N= 11778 Test N= 11716 Learn N= 2476 Test N= 2538 Non-Injury 10,970 98.56 97.89 10,812 10,738 158 232 Injury 3,284 70.58 70.22 966 978 2,318 2,306 Average 84.57 84.5 Overall Correct 92.11 91.51
However, accuracy alone does not completely describe the prediction efficiency, and hence other means of evaluating our predictive models are necessary. The receiver operating characteristics (ROC) curve, also known as the relative operating characteristic curve, is a comparison of two operating characteristics as the criterion changes [7]. The area under the ROC curve (AUC) quantifies the overall discriminative ability of a test. An entirely random test (i.e., no better at identifying true positives than flipping a coin) has an AUC of 0.5, while a perfect test (i.e., one with zero false positives or negatives) has an AUC of 1.00 [7].
Accordingly, with respect to the ROC in this specific experiment, it scored 0.8873 for training and
0.8827 for test scenario. ROC charts for both injury and non-injury are presented in Figure 2.
Figuer 2: ROC (injury and non-injury)
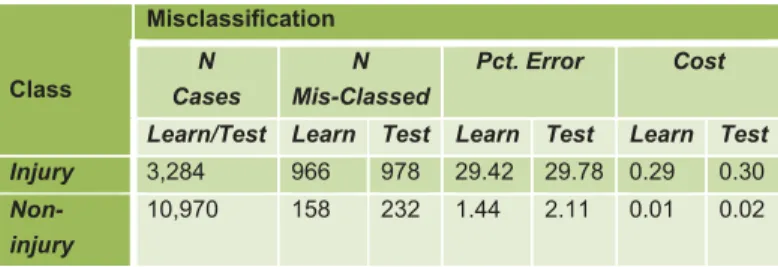
Another important concept regarding the performance of a predictive model is miss-classification rate in terms of error and cost. Misclassification cost is a fraction of cases misclassified, multiplied by cost
assigned for misclassification. While the default is one, it is also possible to vary the assignment based on the recommendation of the domain experts. As it can be seen from Table III below, the model is better in predicting non-injury results than injury.
TABLE III. MISCLASSIFICATION OF CART MODEL
Class Misclassification N Cases N Mis-Classed Pct. Error Cost
Learn/Test Learn Test Learn Test Learn Test Injury 3,284 966 978 29.42 29.78 0.29 0.30
Non-injury
10,970 158 232 1.44 2.11 0.01 0.02
4.3 RandomForest Analysis and Result
Similar to that of CART a model with 12 attributes selected was exposed to Random Forest analysis. In the process of model building, an attempt has been made to specify a balanced class weight option to control the data imbalance of the target class. The experiment identified 8 attributes namely; VictimAge, VictimOccup, VictimCategory, PedstrianMovem, DrivingLicense, DrivingExp, VictimHealthSt, VehicleMovement based on their predicting power in descending order. Thus, using these variables, a RandomForest analysis is done, which results in error rate of closer to 0 (zero) and 0.3 in case of non-injury and injury classes respectively. This implies that this method is better in classifying non- injury class than injury class. The performance of a predictive model error rate lies in between 0 and 1. The average error rate is presented in Figuer3.
Figuer 3: Error rate result (overall)
With respect to miss-classification, somehow similar to that of CART analysis result, random forest analysis is also less accurate in classifying injury category while the miss classification rate is by far less for non-injury category. This is shown with 26.55 % classification error for injury class while it is 0.26 % for non injury class. It is also worth mentioning that the cost, which is a fraction of cases misclassified, multiplied by cost assigned for misclassification in this case 1, is higher for injury class than non-injury. The detail is presented in Table IV.
TABLE IV. MISCLASSIFICATION RESULT OF RANDOMFOREST
Actual Class
Internal Test/Out of Bag N Cases N Mis-Classed Pct. Error Cost Injury 3,284 872 26.55 872.00 Non-injury 10,970 29 0.26 29.00
Prediction success and ROC results are also important indicators of a given predictive model. Accordingly, percentage of correctly prediction for non-injury case is 99.74% while 73.45% is for injury cases. The detail is presented in Table V. In the same token, the ROC integral indicates, 0.90070, which is closer to 1 and it indicates minimal zero positives and negatives, which entails good performance.
TABLE V. INTERNAL TEST/OUT OF BAGPREDICTION SUCCESS
Actual Class Predicted class Total Class Percent Correct Injury N=244 Non-Injury N=11813 Injury 3,284 73.45 98.81 7.38 Non-injury 10,970 99.74 1.19 92.62 4.4 TreeNet Analysis
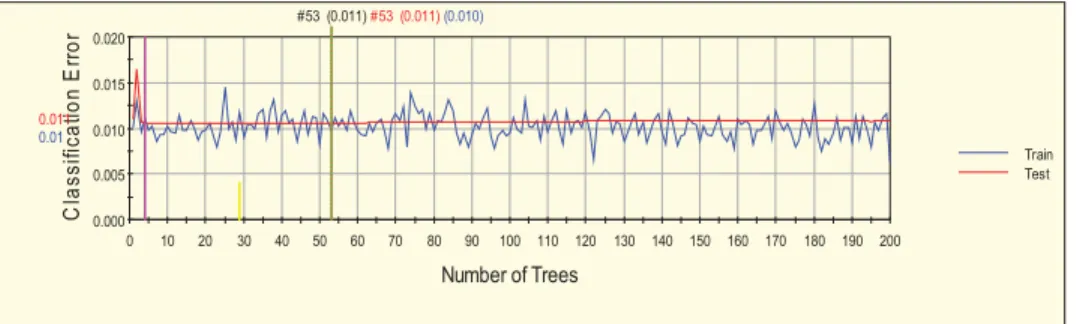
Similar to the above experiments 12 attributes was exposed to TreeNet analysis. In the process of model building, attempt has been made to specify a balanced class weight option to control the data imbalance of the target class. 10 fold cross validation was used as a test method. The experiment identified the following predictors ; VictimCategory, VictimOccup, VictimHealthSt, VehicleMovement, DrivingExp DrivingLicense, AccuDrivEduLevel, AccuDriVehiRelation, VictimAge, PedstrianMovem, VictimeAge based on their predicting power in descending order. Thus, using these variables, a TreeNet analysis is done, which results in error rate of 0.011 for testing and 0.010 for training. It is also noted that this method is better in classifying non- injury class than injury class. The performance of a predictive model error rate lies in between 0 and 1. The average error rate is presented in Figure4. 0.000 0.005 0.010 0.015 0.020 0 10 20 30 40 50 60 70 80 90 100 110 120 130 140 150 160 170 180 190 200 C la s s ifi c a ti o n E rr o r Number of Trees Train Test 0.011 0.01 #53 (0.011)#53 (0.011)(0.010)
Regarding miss-classification, TreeNet analysis is also less accurate in classifying injury category compared to non-injury category. This is shown with 1.95% classification error for injury class while it is 0.16 % for non injury class. It is also worth mentioning that the cost, which is a fraction of cases misclassified, multiplied by cost assigned for misclassification, in this case 1, is higher for injury class than non-injury. The detail is presented in Table VI.
TABLE VI. MISCLASSIFICATION RESULT OF TREENET
Class N Cases N Mis-Classed Pct. Error Cost Injury 3,284 64 1.95 64.00 Non-Injury 10,970 18 0.16 18.00
4.5 Discussion and Lessons learned
As mentioned in the previous sections the whole purpose of this experiment is to get an overall understanding of accident data and getting sense of data quality issues. In line with this, testing the data for identification of patterns without making significant pre-processing provides a good insight in to the nature of the data. This will guide the subsequent analyses and selection of better tools for this specific domain in a specific context. In connection to this, the role of various aspects of road accidents like vehicle status, time and environment, infrastructure which includes road and road signs, will still be explored to find empirical results that guides counter measures from the data point of view. In line with this, one of the patterns that require empirical investigation was the impact of road user’s related factors on accident injury risk. And it is learned that road user related factors need more investigation so as to guide proactive methods in reducing road accident and improving road safety in general. The subsequent experiments will result in more patterns. Making more and advanced pre processing will provide better accuracy and explanation about the case at hand. This especially is important in increasing accuracy.
As hypothesized by domain experts, pedestrian behaviour and victims features like their category and age tell significant information about the possible result of a given accident collision. This, along with the subsequent experiments, will be used in the design of education and enforcement measures in road safety domain. Enforcement should not only focus on drivers, rather policy direction should also consider enforcing pedestrians follow traffic rules. With respect to education, though attempt has been made to create awareness in general, road safety education should be part and parcel of general education at a lower educational level so as to increase awareness right from the childhood.
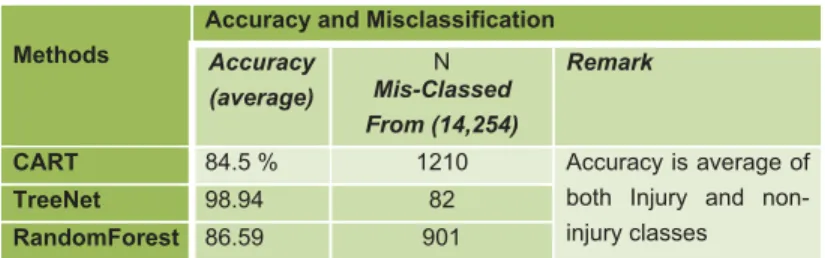
Moreover CART, TreeNet and RandomForest predictive miners are found to be promising in identification of patterns in a road safety domain. While comparing the three, they all perform less in case of injury class while their performance is very good in determining non-injury risk of an accident. However TreeNet predictive modelling technique followed by RandomForest performs better by exhibiting lower error rate, higher ROC score and grater prediction accuracy than CART. The detail of misclassification and accuracy level of the three techniques is presented in a table VII below.
TABLE VII. MISCLASSIFICATION AND ACCURACY RESULT OF THE THREE TECHNIQUES
Methods
Accuracy and Misclassification Accuracy (average) N Mis-Classed From (14,254) Remark
CART 84.5 % 1210 Accuracy is average of
both Injury and non-injury classes
TreeNet 98.94 82
RandomForest 86.59 901
Thus, from the experiments and discussion made, lessons learned and contributions of the current work can be summarised as follows:
x Survey of the literature in the area showed that accident severity analysis is one of the major research agenda in road safety studies.
x Human behaviour (road user’s behaviour) is the main aspect in accident severity analysis.
x Creating awareness not only on drivers but also on other road users like pedestrians needs more attention.
x CART, TreeNet and RandomForest are proved to be promising techniques in severity analysis.
5. CONCLUSION AND FUTURE WORK
Through this paper, an attempt has been made to explore CART, TreeNet and RandomForest for accident data understanding and analysis. A review of literature enabled to create a good understanding of state of the art techniques and attempts in a road safety domain. The main goal was to empirically explore the role of road user’s factors, which is said to be the major factor, on the risk of injury for a road traffic accident. It extends previous experiments [21] by including TreeNet analysis, comparison and more detailed discussions. Detection of accidents risks due to road users related factors could assist in designing appropriate counter measures in the effort of reducing the socio-economic impact of road accidents which ultimately improve road safety. Another advantage of this systemic view approach to road traffic accident data understanding and analysis through machine learning is that hypothesis can be easily be formulated for future trends.
With reference to the main objective, future work will focus on explaining the data quality problems and respective mitigations. Thus the experiment will continue through the use and comparison of different soft computing techniques on the test bed to uncover other aspect of road safety and get good understanding of the data in identifying patterns. In line with this, novel techniques and algorithms like non-negative matrix factorization and genetic algorithm will also be explored. We strongly believe that the result of these successive experiments will be major ingredient of the information architecture to be proposed for accident data collection and analysis in developing countries in general and for Ethiopia in particular.
Finally the result of this study can be used to support future research related to machine learning approach, especially in the context of road safety.
Acknowledgment
The authors are grateful to the national and regional road traffic and road safety departments of Ethiopia for letting the researchers get access to the road traffic data, VSB-Technical University of Ostrava, Faculty of Electrical Engineering and Computer Science, Czech Republic for providing computational resource and work environment throughout the research, Addis Ababa University, IT Doctoral Program, for providing fund for research visit.
6. REFERENCES
[1] N. Saunier, N. Mourji and B. Agard, “Investigating Collision factors by mining microscopic data of vehicle conflicts and collisions” 2010.
[2] Tibebe B. Tesema, Abraham A. And Grosan C. “Rule Mining and Classification of Road Traffic Accidents Using Adaptive Regression Trees”. International Journal of Simulation Vol. 6 No 10 and 11, 2005.
[3] Zelalem Regassa, “Determining the degree of driver’s responsibility for car accident: the case of Addis Ababa traffic office”. Master’s thesis, Addis Ababa University, 2009.
[4] Haleluya Kifle, “Application of data mining technology to support the prioritization of dangerous crash location: the case of Addis Ababa Traffic Office”. Master’s thesis, Addis Ababa University, 2009.
[5] Getnet Mossie, “Applying data mining with decision tree and rule induction techniques to identify determinant factors of drivers and vehicles in support of reducing and controlling road traffic accidents: the case of Addis Ababa city”. Master’s thesis, Addis Ababa University, 2009.
[6] Alemayahu Tabor (2009). Bayesian approach for analysis of road traffic accidents: the case of Addis Ababa. M.Sc. Thesis. AAU. Master’s thesis, Addis Ababa University.
[7] Tibebe B. and Shawndra H., “Mining road accidents data to improve safety: the role of road related factors on accident severity” Proceeding of AAAI Symposium on Artificial Intelligence for Development. Stanford University, 2010.
[8] K. Janecka and H. Hulova, “Using spatial data mining to discover the hidden rules in the crime data. GIS Ostrava”, 2011.
[9] S. Krishnaveni and M. Hemalatha, “A Perspective Analysis of Traffic Accident using Data Mining Techniques”. International Journal of Computer Applications (0975 – 8887). Volume 23– No.7, June 2011
[10]Yang Haixia and Nan Zhihong, “An Application of Factor Analysis on Road Traffic Accident”. The 5th International Conference on Computer Science & Education Hefei, China. August 24–27, 2010.
[11] R. Nayak, D, Emerson, J.Weligamage and N. Piyatrapoomi, “Road Crash Proneness Prediction using Data Mining” EDBT 2011, March 22--24, 2011, Uppsala, Sweden. Copyright 2011 ACM 978-1-4503-0528-0/11/0003\ ...\$10.00}
[12]A. Pakgohar, Reza S. Tabrizi, M. Khalili, and A. Esmaeili, “The role of human factor in incidence and severity of road crashes based on the CART and LR regression: a data mining approach”. Procedia Computer Science 3, 2011, 764–769
[13]W. Duch, N. Jankowski, and K. Grabczewski, “Computational intelligence methods for information understanding and information management”, 2006.
[14]Pei Liu,"A self-organizing feature maps and data mining based decision support system for liability authentications of traffic crashes”. Neurocomputing .Volume 72, Issue 13-15.2009.
[15]Gey S. and Nédélec E. “Model selection for CART regression trees”. IEEE Trans. Inf. Theory 51:658–670, 2005
[16]Salford Systems - Data Mining Solutions. 2011. Available from http://www.salford-systems.com/ [17]Sarina Sulaiman, Siti Mariyam Shamsuddin, Ajith Abraham, and Shahida Sulaiman “Intelligent
Web Caching Using Machiine Learning Methods, Neural Network World, 2011.[In press].
[18]Miaou, S.P. and Harry, L., “Modelling vehicle accidents and highway geometric design relationships”. Accidents Analysis and Prevention, (6), pp. 689–709.27, 1993. Desktop Reference for Crash Reduction Factors Report No. FHWA-SA-07-015, Federal Highway Administration September, 2007http://www.ite.org/safety/issuebriefs/Desktop%2.
[19]Friedman, J.H.:"Stochastic gradient boosting", Computational Statistics & Data Analysis, vol. 38, pp. 367-378, 2002.
[20]Friedman, J. and Meulman, J.: "Multiple additive regression trees with application in epidemiology," Statistics in Medicine, vol. 22, pp. 1365-1381, 2003.
[21]T. Beshah, A. Abraham, D. Ejigu, V. Snasel, and P. Kromer, “Pattern recognition and knowledge discovery from road traffic accident data in ethiopia: Implications for improving road safety,” in WICT 2011 Conference Proceedings. IEEE, Dec. 2011