THE DIFFUSION OF DIGITAL DASHBOARDS: AN EXAMINATION OF DASHBOARD UTILIZATION AND THE MANAGERIAL DECISION ENVIRONMENT
by
JEFF REINKING
B.S. Florida Southern College, 1990 M.B.A. Stetson University, 2008
A dissertation submitted in partial fulfillment of the requirements for the degree of Doctor of Philosophy
in the Kenneth G. Dixon School of Accounting in the College of Business Administration
at the University of Central Florida Orlando, Florida
Fall Term 2013
ii
iii ABSTRACT
This dissertation consists of three related studies examining the diffusion of digital dashboard technology throughout today’s organizations. Dashboards, once reserved for the executive level, are now available to managers at the lower levels of the organization. For these managers, dashboards have become an integral part of their work life to support their decision environment, to provide consistency in measures, to monitor performance, and to communicate information throughout the organization. Prior research in the practice literature has shown that dashboards improve managerial performance and organizational performance as well as communicate organizational goals and objectives; however, empirical research has not been conducted in this area to confirm this anecdotal evidence. Using three theories, the phenomenon surrounding the diffusion of dashboards to the lower levels of the organization are examined based on 1) dashboards as a source of interactive management control and strategy alignment, 2) the impact of dashboard quality on strategy alignment, decision environment, and performance, and 3) the impacts on dashboard utilization from the antecedents of information content and task uncertainty and the consequences of user satisfaction and managerial performance.
The first study investigates why dashboards have been diffused to the lowers levels of today’s organizations. The primary focus of this study is to develop an understanding about the extent of dashboard utilization by decision-makers and the antecedents and consequences of utilization that is responsible for the widespread acceptance of this technology. The data for this study is collected and analyzed through an explanatory cross-sectional field study utilizing a semi-structured questionnaire. Using data from interviews with 27 managers, a framework is developed that indicates strategy alignment and dashboards associated with interactive
iv
management control are the primary antecedents that drive dashboard diffusion. The dimensions of dashboard system quality and dashboard information quality mediate the relationship between an interactive dashboard and the extent of dashboard utilization, which leads to higher levels of managerial performance and organizational performance. This study contributes to the dashboard, strategy, and MCS literature by revealing that dashboards are not isolated technologies, rather they play an important role in the execution of strategy at the operational levels of an organization. In addition, dashboards can also function as an interactive management control, which leads to high levels of diffusion of dashboards throughout organizations. Prior strategy literature has examined strategy alignment at the higher levels and this study extends this research stream by investigating strategy alignment at the lower operational levels of the organization.
The second study utilizes the IS Success Model to explore the impacts of the antecedents of dashboard system quality and dashboard information quality on the managerial decision environment in addition to the resulting consequences or ‘net benefit’ of managerial performance and organizational performance. A field survey is used to collect data from 391 dashboard using managers to enable the analysis of the relationships predicted in the theoretical model. The theoretical model is analyzed utilizing PLS. The results show that two dimensions of dashboard quality, system flexibility and information currency, have a positive effect the managerial decision environment. The model indicates support for the consequences of managerial performance and organizational performance resulting from higher levels of decision quality in the managerial decision environment. The model also reveals that when the dashboard measures are strategy aligned, lower levels of dashboard system flexibility are associated with improved
v
managerial decision environment. Therefore, when organizations design their dashboard systems to support strategy alignment, managers should not be afforded high levels of system flexibility to maintain their attention on the key performance indicators selected to align with strategy. This result is a primary contribution to the strategy literature that reveals that strategy aligned dashboards are more effective in environments where the dashboard flexibility is lower. Additionally, study two also extends the strategy literature by examining strategy alignment at the lower levels of the organization, since prior research has concentrated on the higher level strategic outcomes.
As dashboards become highly diffused and more managers utilize the technology, the likelihood that dashboard designers cannot provide dashboard content that fits the tasks performed by managers is higher. The third study investigates this fit between dashboard information content and task uncertainty to understand if the fit between the technology and task impacts the extent of dashboard utilization by managers based on the theory of task-technology fit (TTF). TTF predicts higher levels of utilization will increase user satisfaction and managerial performance. Data is collected from 391 managers that utilize dashboards in their weekly work life to analyze the relationships predicted in the theoretical model. PLS is utilized to analyze the theoretical model and indicates weak support of TTF impacting the extent of dashboard utilization. The model supports the hypotheses for the links between the extent of dashboard utilization and user satisfaction and managerial performance. Based on the weak findings from this theoretical model, a second model is developed and analyzed. The second model measures TTF through the mediation of task uncertainty between dashboard information content and the extent of dashboard utilization, while the first model measured TTF through interacting task
vi
uncertainty and dashboard information content. The results of the second model show strong support that TTF, as measured through mediation, increases the extent of dashboard utilization. This study contributes to the literature by empirically showing that more extensive levels of dashboard utilization are achieved through the antecedent of TTF, resulting in increased managerial satisfaction and managerial performance.
vii
To my wife, Tammy
viii
ACKNOWLEDGMENTS
The completion of this dissertation would not have been possible without the help and support of many individuals. I am grateful to my dissertation committee, Steve Sutton, Robin Roberts, and Clark Hampton for their assistance, encouragement, and support. Most especially, I thank Vicky Arnold, my committee chair, for making all of this possible, and for always being available to me even during your incredibly busy schedule. I will always be indebted to you for your support, advice, and inspiration that made my dissertation possible. I thank you for all the knowledge I gained throughout my dissertation that I can now take with me as I begin this new journey in my academic career.
I thank my mother, Nancy Reinking, for her love and support throughout my life and academic career. She knew that I would be getting my Ph.D. long before I ever did. I know you are smiling from above. I thank my father, Jim Reinking, for his dedication, and for providing the opportunities to me early in life to help me succeed. I am also thankful to my children, Matthew and Molly, for their ‘help’ along the way and patience when I was not always available for them. I would also like to thank all of individuals who freely gave their time to support this research with their knowledge of dashboard use in practice. Last, and certainly not the least, for the generous financial support provided through the Institute of Management Accountants to provide the respondents for studies two and three.
ix
TABLE OF CONTENTS
LIST OF FIGURES ... xii
LIST OF TABLES ... xiii
GENERAL INTRODUCTION ... 1
Study One Digital dashboards: A source of interactive management control and strategy alignment ... 3
Study Two The impact of digital dashboard qualities and strategy alignment on the managerial decision environment and performance ... 5
Study Three The examination of dashboard utilization based on the antecedents of information content and task uncertainty and the consequences of user satisfaction and performance ... 6
Overall Contribution ... 8
References ... 9
STUDY ONE DIGITAL DASHBOARDS: A SOURCE OF INTERACTIVE MANAGEMENT CONTROL AND STRATEGY ALIGNMENT ... 11
Introduction ... 11
Background and Literature Review ... 15
Theory ... 17
Information Processing Theory... 18
The Theory of Attribute Substitution ... 19
Research Methods ... 20
Research Design... 20
Validity and Reliability ... 29
Collecting, Coding, and Analyzing Case Study Data ... 30
Case Study Findings ... 35
Dashboards Utilized in Practice ... 35
The Extent of Dashboard Utilization ... 37
The ‘Diffusion’ of Dashboards throughout Organizations ... 40
Dashboard System Flexibility ... 56
Conclusion ... 57
References ... 60
STUDY TWO THE IMPACT OF DIGITAL DASHBOARD QUALITIES AND STRATEGY ALIGNMENT ON THE MANAGERIAL DECISION ENVIRONMENT AND PERFORMANCE ... 65
Introduction ... 65
Theory, Background, & Hypotheses ... 69
Information Processing Theory... 69
Attribute Substitution Theory ... 71
Digital Dashboards... 73
IS Success Model ... 75
The Moderating Role of Strategy ... 88
Performance ... 93
x Respondents ... 95 Survey Development ... 99 Measurement of Variables ... 103 Control Variable... 106 Pilot Tests... 106 Moderator Variables ... 107
Data Analysis and Results ... 107
Individual Item Quality ... 108
Measurement Model ... 111
Structural Model Results... 114
Conclusion ... 118
References ... 121
STUDY THREE THE EXAMINATION OF DASHBOARD UTILIZATION BASED ON THE ANTECEDENTS OF INFORMATION CONTENT AND TASK UNCERTAINTY AND THE CONSEQUENCES OF USER SATISFACTION AND PERFORMANCE... 129
Introduction ... 129
Background, Theory & Hypotheses ... 133
Extent of Dashboard Utilization ... 135
Dashboard Information Content ... 136
Task Uncertainty ... 142
Measurement of TTF – Interaction between Dashboard Information Content and Task Uncertainty ... 144
User Satisfaction ... 145
Managerial Personal Performance ... 147
Research Methods ... 148 Respondents ... 148 Survey Development ... 152 Measurement of Variables ... 156 Control Variable... 158 Pilot Tests... 158 Interaction Variables ... 158
Data Analysis and Results ... 159
Individual Item Quality ... 160
Measurement Model ... 162
Structural Model Results... 165
Additional Analysis – TTF Operationalized Through Mediation... 168
Conclusion ... 172
References ... 175
GENERAL CONCLUSIONS ... 183
References ... 189
APPENDIX A: STUDY ONE CASE STUDY PROTOCOL ... 190
Purpose ... 191
Research Question ... 191
xi
Key Features of the Case Study ... 192
Type of Case Study ... 192
Propositions... 192
Unit of Analysis ... 193
Variables ... 193
Procedures ... 194
Initial Scheduling of Field Visits ... 194
Sources of Information ... 194
Analysis Plan and Case Study Reports ... 194
Protocol Questions ... 195
Initial set of semi-structured interview questions ... 195
Second set of Semi-structured Questions ... 198
APPENDIX B: SURVEY INSTRUMENT ... 200
Digital Dashboards Survey Data Collection April 2013... 201
APPENDIX C: IRB APPROVALS ... 228
IRB Approval for the Study One ... 229
xii LIST OF FIGURES
Figure 1: Organizational Design Strategies ... 18
Figure 2: IS Success Model ... 23
Figure 3: Framework for Dashboard Diffusion ... 41
Figure 4: Links between Strategy, BSC, and Dashboards ... 46
Figure 5: Organizational Design Strategies ... 70
Figure 6: IS Success Model ... 76
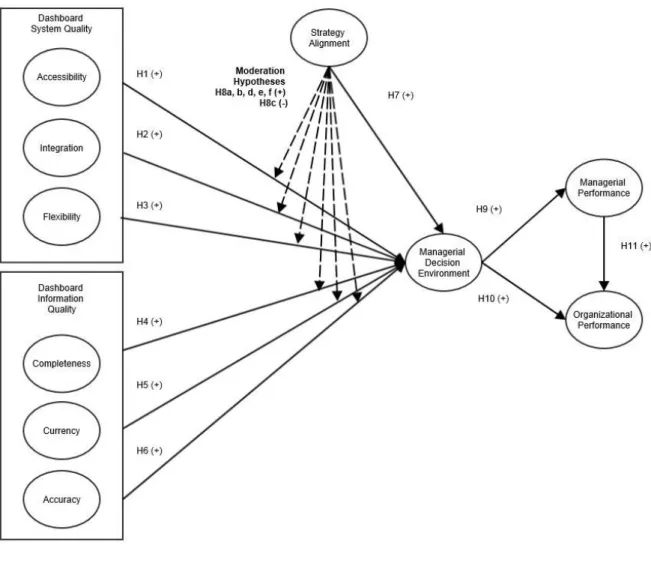
Figure 7: Theoretical Model – Study Two ... 77
Figure 8: Model Results - Study Two ... 115
Figure 9: Theoretical Model – Study Three ... 135
Figure 10: Model Results - Study Three ... 166
xiii LIST OF TABLES
Table 1: Informant Descriptive Statistics ... 27
Table 2: Categories Utilized for Coding Data ... 33
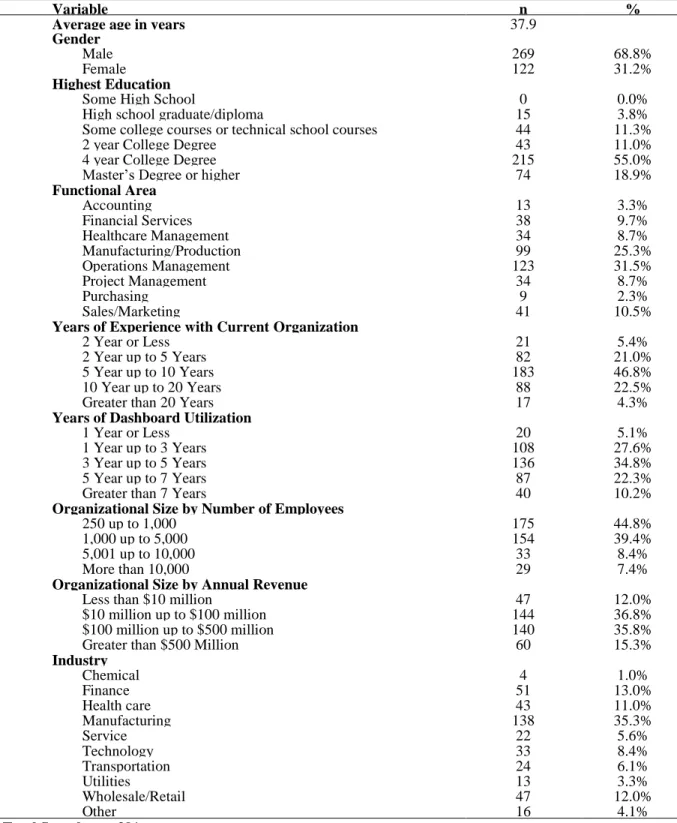
Table 3: Demographic Data – Study Two ... 98
Table 4: Item Measure Descriptions - Study Two ... 99
Table 5: PCA Factor Loadings – Study Two... 110
Table 6: Discriminant Validity – Study Two ... 112
Table 7: Measurement Model Cross Loadings - Study Two ... 113
Table 8: Demographic Data - Study Three... 151
Table 9: Item Measure Descriptions - Study Three ... 153
Table 10: PCA Factor Loadings - Study Three ... 161
Table 11: Discriminant Validity - Study Three ... 163
Table 12: Measurement Model Cross Loadings - Study Three ... 164
1
GENERAL INTRODUCTION
Twenty years ago, McKinnon and Bruns (1992) speculated what management accounting systems should provide to managers in the future to increase managerial effectiveness. Information should be provided continuously from a single real-time database. Access to the database should be provided in a manner that is user friendly so that managers can find the information they need and customize their own reports. Managers should be able to retrieve the information directly, without the assistance of the information technology (IT) department or accounting department. The presentation format of the information should be flexible to allow the manager to use either graphical or tabular displays. Additionally, “(o)nly when systems are designed with each manager’s needs and preferences in mind will every manager be well served by management accounting and the information mosaic be complete and effective” (McKinnon and Bruns, 1992: 194).
Two decades later, innovations in IT have allowed this continuous customized management accounting information (MAI) to be provided in real time from any location in the world through digital dashboards. Dashboards are a visual digital display containing key measures and information essential to the achievement of organizational goals and objectives, and are designed to be viewed in a glance (Few, 2005). Initially, when dashboards were introduced, they were primarily reserved for the executive suite and the marketing function of organizations; however, advances in technology have allowed for the diffusion of dashboards throughout todays’ organizations, and managers at all levels now have access to dashboards. As shown in study one, dashboards are now utilized by managers to perform one, some, or all of these various tasks: making decisions, verifying prior decisions, guiding activities, monitoring personal performance, managing overall work, achieving the goals and objectives of the
2
organization, managing subordinates, informing superiors, analyzing trends, and getting feedback on new initiatives.
Prior research examining the impacts of dashboards at the individual level as well as the organizational level has been limited to practice related articles examining the design and implementation of executive and marketing dashboards (Ballou et al., 2010; LaPointe, 2008; Few, 2005, 2006; Clark et al., 2006; Wind, 2005; Brath and Peter, 2005, Miller and Coiffi, 2004; DeBusk et al., 2003). Although dashboards are extensively utilized in todays’ organizations, empirical research has yet to examine what the extent of dashboard utilization is, why they are utilized by managers in multiple levels of the organization, how the managerial decision environment is impacted by dashboards, and what the antecedent and consequences of dashboard utilization are. Additionally, the practice related literature has examined dashboards as a technology in isolation (Cokins, 2010) and as an individual performance management tool (Velcu-Laitinen and Yigitbasioglu, 2012; Yigitasioglu and Velcu, 2012); however, no empirical research exists that indicates dashboards may actually be a part of the organization’s management control system (MCS: Yigitasioglu and Velcu, 2012) and/or utilized to execute and communicate strategy.
The three papers encompassing this dissertation provide empirical evidence to fill in the gaps in the dashboard literature as stated previously. Each study contributes a unique and separate investigation of the varying phenomenon surrounding the diffusion of dashboards, and together the studies provide a combined view of dashboard utilization and their impact on managers and the organization. Since the extant literature on dashboards is limited, a cross-sectional field study is conducted as the first study to gain an informed understanding of the constructs that are important to the diffusion of dashboard technology and to develop a
3
framework showing the relationships between these constructs. Specifically, study one examines dashboard system qualities, dashboard information qualities, dashboard utilization, interactive management control, strategy alignment, and performance. The second study is concerned with the impact dashboards make to the managerial decision environment, which is comprised of information needs, information delivery, and the resulting quality of decision-making. This study examines whether or not dashboards contribute to higher levels of decision quality based on the antecedents of dashboards systems and information quality. The net benefits of higher quality decisions are investigated based on the association with managerial performance and organizational performance. In addition, the second study explores how strategy aligned dashboards may affect the strength of the relationships between the dashboard qualities and the decision environment. The third study examines the impact of the task-technology fit antecedent upon the extent of dashboard utilization. Details for each study are presented in the three following subsections.
Study One
Digital dashboards: A source of interactive management control and strategy alignment The purpose of study one is to develop an understanding of why dashboards have been diffused throughout today’s organizations. The diffusion of technology can only occur through the utilization of that technology; consequently, in addition to examining the utilization of dashboards, this study also examines the antecedents and consequences to this dashboard utilization. Information processing theory (IPT; Galbraith, 1973), attribution substitution theory (Kahnemen and Frederick, 2002), and the information system (IS) Success Model (DeLone and McLean, 1992, 2003) are used to guide the inquiry for this study. An explanatory cross-sectional field study is utilized to provide an explanation about why dashboards have been diffused
4
throughout organizations. Twenty-seven managers are interviewed utilizing semi-structured questions to collect the data concerning the constructs of interest. These initial constructs of interest and their potential relationships are based on the IS Success Model: dashboard system quality, dashboard information quality, dashboard utilization, managerial performance, and organizational performance. Through the iterative process of data collection and analysis, causal links emerged from the data to allow relationships to be specified in a framework explaining dashboard diffusion.
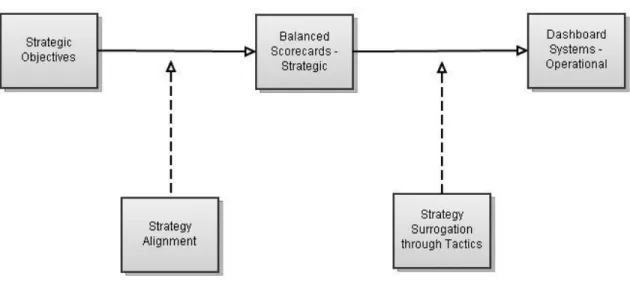
First, the framework indicates that dashboards designed to achieve strategy alignment are related to increased utilization when the dashboard is an interactive management control. The resulting increases to utilization cause the dashboards to become further diffused in the organization. The alignment of strategy at the lower levels of the organization is achieved through the phenomenon known as strategy surrogation, which is the process of managers substituting easily accessed heuristics attributes (operational strategic tactics) for the target attributes (strategic objectives) that are more difficult to access in order to perform a task (Choi et al., 2012, 2013; Kahnemen and Frederick, 2002). This study reveals that strategy surrogation is necessary for the diffusion of organizational strategy through lower levels of an organization. Next, the framework shows that both dashboard system quality and dashboard information quality mediate the link between dashboards associated with interactive management control and the extent of dashboard utilization. Lastly, more extensive dashboard utilization leads to improvements in managerial performance and organizational performance.
This study contributes to the literature on the use of technology as a management control by providing empirical evidence on why dashboards are diffused throughout today’s organizations through strategy alignment and interactive management control. This study makes
5
a second and equally important contribution to strategy and MCS literature by showing that dashboards do not operate in isolation and actually support the execution and communication of strategy while also operating within the organizations’ MCS. Lastly, strategy surrogation, which has been characterized as a negative impact to performance at the higher levels of an organization, is shown to be a positive influence on performance at the lower levels of the organization.
Study Two
The impact of digital dashboard qualities and strategy alignment on the managerial decision environment and performance
Study two examines the impact dashboards have on the decision environment of managers as well as the antecedents and consequences of this impact. DeLone and McLean’s (1992, 2003) IS Success Model is utilized as the framework to examine the antecedents of dashboard system quality and dashboard information quality as well as the ‘net benefits’ of managerial performance and organizational performance. Additionally, this study looks into whether strategy aligned dashboards may strengthen or weaken relationships between dashboard qualities (system and information) and the decision environment. IPT theory (Galbraith, 1973) and attribution substitution theory (Kahneman and Frederick, 2002) are utilized to develop the theoretical model for this study. A field survey is used to collect data from 391 middle to upper level managers located in the United States who use dashboards in their weekly work life. The theoretical model is tested using components based structural equation modeling.
The theoretical model indicates that only one dimension from each dashboard system quality (flexibility) and dashboard information quality (currency) are strong antecedents to the managerial decision environment. Additionally, the moderation hypotheses examining the effect
6
of strategy aligned dashboards are not supported, except for the relationship between dashboard system flexibility and the managerial decision environment. When dashboards are strategy aligned, higher levels of system flexibility lead to lower levels of decision quality since the managers may be able to change their dashboard content to information that does not align with strategy. The model confirms that higher quality decisions in the managerial decision environment lead to higher levels of both managerial performance and organizational performance.
Study two makes a key contribution to the strategy literature by showing decision quality declines when dashboards are allowed to be flexible in a strategy aligned environment. Consequently, allowing their managers a high level of flexibility to alter the information displayed on their dashboards may not be positive for organizations that use their dashboard systems to support strategy alignment. By limiting flexibility, managers’ attention may maintain focus on the specifically selected key performance indicators. Further, the examination of strategy alignment at the lower levels of the organization extends the strategy research, which has concentrated on high level strategic outcomes (Choi et al., 2012, 2013; Cheng and Humphreys, 2012; Humphreys and Trotman, 2011; Banker et al., 2011; Tayler, 2010; Banker et al., 2004).
Study Three
The examination of dashboard utilization based on the antecedents of information content and task uncertainty and the consequences of user satisfaction and performance
The purpose of this study is to examine the fit between dashboard information content and task uncertainty and the impact to the extent managers' utilize their dashboards. The antecedent of this ‘fit’ is studied through the lens of task-technology fit (TTF) theory. TTF
7
predicts a high level of user satisfaction and managerial performance based on the high level of fit between technology and tasks (Goodhue and Thompson, 1995; Lim and Benbasat, 2000). The theoretical model is developed through TTF theory and tested utilizing components based structural equation modeling. The data for this model is collected from 391 managers through a field survey. The results from the analysis of the theoretical model show that dashboard information content and task uncertainty both affect the extent of dashboard utilization directly; however, the model does not show support for the hypotheses of the ‘fit’ of the technology with the task as operationalized through interaction variables. However, the model still confirms that more extensive levels of utilization lead to improved user satisfaction and managerial performance. A second model is developed, again based on TTF theory, as additional analysis to investigate TTF through the mediation of dashboard information content and task uncertainty to measure the level of TTF. The results show strong support for the alternative model where TTF was operationalized as task uncertainty mediating the relationship between dashboard information content and the extent of utilization.
The key contribution of study three is to provide empirical evidence that higher levels of TTF are needed to increase dashboard utilization. This study extends the TTF research to incorporate the information ‘content’ construct as an important construct proxy for technology. Additionally, this research extends the prior practice related literature that indicate higher performance is achieved when dashboards contain performance indicators linked to organizational goals and objectives.
8
Overall Contribution
The three studies in this dissertation examine the diffusion of dashboards throughout today’s organizations. As a whole, these three studies advance our knowledge of how dashboards impact the individual and the organization. Our understanding of why dashboards are diffused throughout organizations has increased in addition to our understanding of the antecedents that improve dashboard utilization and the managerial decision environment.
Overall, this study contributes to the dashboard, strategy, and MCS literature in the following manners. These studies are the first to empirically model the antecedents of dashboard utilization and the managerial decision environment as well as the associated consequences. TTF, strategy alignment, and dashboards that provide interactive management control are shown to be important antecedents to dashboard utilization and diffusion throughout an organization. The results confirm that more extensive dashboard utilization leads to the net benefits of user satisfaction, managerial performance, and organizational performance. Additionally, based on dashboards associated with strategy alignment and interactive management control, these studies empirically place dashboards in both the strategy and MCS literature whereas, previously, the evidence that dashboards supported these activities was only anecdotal.
9
References
Ballou, B., Heitger, D. L., and Donnell, L. (2010). Creating effective dashboards. Strategic Finance, 91(9): 27-32.
Banker, R. D., Chang, H, and Pizzini, M.J. (2004). The balanced scorecard: Judgmental effects of performance measures linked to strategy. The Accounting Review 79(1): 1–23.
Banker, R. D., Chang, H, and Pizzini, M.J. (2011). The judgmental effects of strategy maps in balanced scorecard performance evaluations. International Journal of Accounting Information Systems, 12(4): 259-279.
Brath, R., and Peters, M. (2005). Past and future. DM Review, 15(1): 40-43.
Cheng, M. M., and Humphreys, K. A. (2012). The differential improvement effects of the strategy map and scorecard perspectives on managers' strategic judgments. The Accounting Review, 87(3): 899-924.
Choi, J., Hecht, G. W., and Tayler, W. B. (2013). Strategy selection, surrogation, and strategic performance measurement systems. Journal of Accounting Research, 51(1): 105-133. Choi, J., Hecht, G. W., and Tayler, W. B. (2012). Lost in translation: The effects of incentive
compensation on strategy surrogation. The Accounting Review, 87(4): 1135–1163.
Clark, B. H., Abela, A. V., and Ambler, T. (2006). Behind the wheel. Marketing Management, 15(3): 19-23.
Cokins, G. (2010). The promise and perils of the balanced scorecard. Journal of Corporate Accounting & Finance, 21(3): 19-28.
DeBusk, G. K., Brown, R. M, and Killough, L. N. (2003). Components and relative weights in utilization of dashboard measurement systems like the balanced scorecard. The British Accounting Review 35(3): 215-31.
DeLone, W. H., and McLean, E. R. (1992). Information systems success: The quest for the dependent variable. Information Systems Research, 3(1): 60-95.
DeLone, W. H., and McLean, E. R. (2003). The DeLone and McLean model of information systems success: A ten-year update. Journal of Management Information Systems, 19(4): 9-30.
Dishaw, M. T., and Strong, D. M. (1998). Supporting software maintenance with software engineering tools: a computed task-technology fit analysis. The Journal of Systems and Software, 44(2): 107-120.
Dishaw, M. T., and Strong, D. M. (2003). The effect of task and tool experience on maintenance case tool usage. Information Resources Management Journal, 16(3): 1-16.
10
Few, S. (2005). Intelligent dashboard design. DM Review, 15(9): 12-14.
Few, S. (2006). Information Dashboard Design: The Effective Visual Communication of Data. Beijing: O'Reilly.
Galbraith, J. (1973). Designing Complex Organizations. Reading, MA: Addison-Wesley.
Goodhue D. L. and Thompson R. L. (1995) Task-technology fit and individual performance. MIS Quarterly, 19(2): 213-236.
Humphreys, K. A., and Trotman, K. T. (2011). The balanced scorecard: The effect of strategy information on performance evaluation judgments. Journal of Management Accounting Research, 23(1): 81-98.
Kahneman, D., and Frederick, S. (2002). Representiveness revisited: Attribute substitution in intuitive judgment in Heuristics and Biases: The Psychology of Intuitive Judgment, edited by T. Gilovich, D. Griffin, and D. Kahneman. New York: Cambridge University Press, 49–81.
LaPointe, P., (2008). An anatomy of a dashboard failure (and pending resurrection). Marketing NPV, 4(4): 17-20.
Lim, K. H., and Benbasat, I. (2000). The effect of multimedia on perceived equivocality and perceived usefulness of information systems. MIS Quarterly, 24(3): 449-471.
McKinnon, S. M., and Bruns, W. J. (1992). The Information Mosaic. Boston: Harvard Business School Press.
Miller, A., and Cioffi, J. (2004). Measuring marketing effectiveness and value: The Unisys marketing dashboard. Journal of Advertising Research, 44(3): 237-243.
Tayler, W. B. (2010). The balanced scorecard as a strategy-evaluation tool: The effects of responsibility and causal-chain focus. The Accounting Review, 85(3): 1095–1117.
Velcu-Laitinen, A. and Yigitbasioglu, O. M. (2012). The use of dashboards in performance management: Evidence from sales managers. The International Journal of Digital Accounting Research, 12: 39-58.
Wind, Y. (2005). Marketing as an engine of business growth: A cross-functional perspective. Journal of Business Research, 58(7): 863-873.
Yigitbasioglu, O. M., and Velcu, O. (2012). A review of dashboards in performance management: Implications for design and research. International Journal of Accounting Information Systems, 13(1): 41-59.
11 STUDY ONE
DIGITAL DASHBOARDS: A SOURCE OF INTERACTIVE MANAGEMENT CONTROL AND STRATEGY ALIGNMENT
Introduction
“Dashboards: a solution in search of a problem?” (LaPointe, 2008: 17)
Innovations in information technologies (IT), such as digital dashboards (hereinafter referred to as dashboards), provide a great opportunity for the examination of the relationships between the management control system (MCS) and strategy execution (Henri, 2006; Kober et al., 2007; Tucker et al., 2009). Dashboards are defined as a “visual display of the most important information needed to achieve one or more objectives which fits entirely on a single computer screen so it can be monitored at a glance” (Few, 2006: 34). Further, dashboards provide managers with a common language to support the achievement of both short-term and long-term organizational objectives (Pauwels et al., 2009). Consequently, dashboards are a technological element of organizations’ overall MCS (Chapman and Kihn, 2009).
The primary purpose of this study is to examine why dashboards have been diffused throughout today’s organizations. The diffusion of technologies in organizations occurs through the utilization of the technology and higher levels of diffusion are achieved when a technology is utilized to accomplish differing types of activities and tasks. Therefore, the extent of dashboard utilization is the primary focus of the study to understand why dashboards have been diffused throughout organizations to decision-makers. Given that the extent of dashboard utilization is central to the diffusion of dashboards throughout the organization, understanding the antecedents and consequences of the extent of dashboard utilization is important. The antecedents examined include dashboard system quality and dashboard information quality (DM, 1992, 2003; Nelson et
12
al., 2005; Tucker et al., 2009). The consequences of the extent of dashboard utilization are managerial performance and organizational performance.
This study’s primary motivation is in response to the call for more research investigating the interfaces between modern information technology and the MCS, since this relationship is the foundation for the entire field of modern management control (Granlund, 2011). Specifically, there is a lack of empirical work examining the utilization of dashboards throughout the organization and the impact on the MCS (Yigitasioglu and Velcu, 2012). Another important area of dashboard utilization where our knowledge is limited is the implementation of the strategy process and communication of strategy in relation to MCS (Kober et al., 2007; Tucker et al., 2009).
This study utilizes an explanatory cross-sectional field study to understand why dashboards have been diffused throughout organizations. A cross-sectional field study is selected as the appropriate research method for this study since management control practices can only be understood within the context of where they occur, in the actual organization; therefore, the empirical work for this study is conducted inside the organizations of interest (Kaplan, 1986). Semi-structured questionnaires are utilized to interview managers from the following industrial sectors: manufacturing, financial services, IT, healthcare, consulting, and retail. In order to gain a wide perspective of dashboard utilization throughout organizations, all levels of management are included in the study including executive managers (Chief Executive Officer, Chief Financial Officer, Chief Information Officer, and Executive Vice President), operational managers, IT managers, finance directors, marketing managers, organizational trainers, and industry consultants. Twenty-seven interviews in total are conducted and a framework of dashboard diffusion is developed using Yin’s (2009) analytical process of explanation building. Explanation
13
building is the specification of a set of causal links in the emergent categories of field study data achieved through the iterative process of data collection and analysis (Yin 2009).
The key results of this study reveal that dashboards that are designed to support the execution of organizational strategy increases their utilization, which in turn increases diffusion throughout the organization. Subsequently, the dashboard develops into an interactive management control that directs organizational attention, induces vertical and horizontal communication, and assists with learning based on the messages created by the top management level (Simons, 1994). Because of the interactive nature of the dashboard, utilization increases throughout the organization, particularly when the quality of the system and the information are high. Dashboards assist in the execution of operational strategy throughout all levels of an organization through strategy surrogation. Strategy surrogation is the process by which managers substitute easily accessed heuristics attributes (operational strategic tactics) in lieu of the much more complex and difficult to access target attributes (strategic objectives) to perform a task, as predicted through the lens of attribution substitution theory (AST; Choi et al., 2012, 2013; Kahnemen and Frederick, 2002). Prior research views strategy surrogation as a negative impact to strategic level outcomes (Choi et al., 2012, 2013); however, this study reveals that strategy surrogation is necessary for the diffusion of organizational strategy through lower levels of an organizations.
The initial focus of this study was on the examination of dashboard system quality and dashboard information quality as antecedents to the diffusion and utilization of dashboards throughout organizations; however, the patterns that emerged in the data reveal that strategy alignment and dashboards as interactive MCS are the real antecedents that drive the diffusion of dashboards. The final results show that the dimensions of dashboard system quality and
14
dashboard information quality are not the primary antecedents to the diffusion of dashboards; rather, they mediate the relationship between the interactive dashboard and the extent of dashboard utilization.
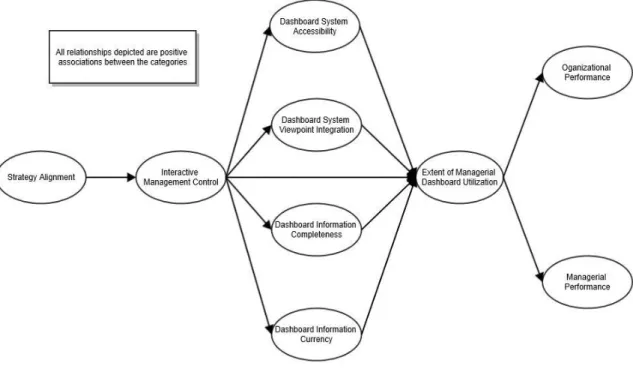
A framework displaying the categories and relationships that emerged from the patterns in the data is developed for this study. The framework shows that dashboards that are closely aligned with organizational strategy and objectives are also positively associated with interactive management control. Interestingly, the framework reveals that dashboards can be both strategically aligned and associated with the organization’s MCS if the dashboard is interactive. The interactive management control characteristic of dashboards leads to a higher extent of dashboard utilization. Dashboard accessibility, viewpoint integration1, dashboard information completeness, and dashboard information currency are important mediators between interactive dashboards and the extent of dashboard utilization. Higher levels of the extent of dashboard utilization lead to improved managerial performance and organizational performance. In addition to the framework, the data also reveals that strategy alignment is negatively associated with flexibility (level of user control) thus limiting managers’ ability to change the measures contained in their dashboard.
The primary contribution of this study is the provision of empirical evidence in the area of why dashboards are being diffused throughout today’s’ organizations. This study shows that dashboards play an important role in both the organization’s MCS as an interactive management control and the alignment of strategy at the operational level. These two primary constructs (interactive management control and strategy alignment) emerge as the most important
1
Viewpoint integration is achieved when information shared between managers and departments is presented in a common language and measured equally so that the information is viewed in the same light when dialogue occurs, even between disparate parts of the organization (Pauwels et al., 2009).
15
phenomenon impacting the extent of dashboard utilization; and consequently, the diffusion of dashboards throughout organizations. This study contributes to strategy research by examining strategy execution at the lower levels of the organization through strategy surrogation, whereas, prior research has investigated strategy in the context of executive level strategic outcomes: evaluations, changes, or initiative implementations. The results indicate that strategy surrogation has a positive impact at these levels.
The remainder of this paper is organized as follows: Section 2 presents the background and literature review. Section 3 discusses the theories utilized in this study. Section 4 discusses the research methods. Section 5 shows the findings of the cross-sectional field data collection. Section 6 provides a summary and concludes the paper.
Background and Literature Review
According to Few (2006), a properly designed dashboard should show diagnostic performance measures on a single computer screen that can be viewed and understood with a quick glance. The practice related literature has examined executive and marketing departmental dashboards regarding dashboard design and implementation (Ballou et al., 2010; LaPointe, 2008; Few, 2005, 2006; Clark et al., 2006; Wind, 2005; Brath and Peter, 2005, Miller and Coiffi, 2004; DeBusk et al., 2003); however, today’s’ dashboards are designed to be utilized by all levels of management within an organization. Empirical research examining dashboards is limited, and this line of literature has not examined dashboards functioning within the organizational MCS or in the operational execution of strategy. The practice related literature has concentrated in two primary areas: dashboard system design and dashboard system implementation. Anecdotal evidence suggests that the effective dashboards should link measures to organizational objectives
16
and goals and support the decision–making process. These streams of research are reviewed next.
The first stream of literature focuses on dashboard design and the best approach for data visualization (Yigitbasioglu and Velcu, 2012; Ballou et al., 2010; Few, 2005, 2006). The practice related literature suggests that when dashboards are designed effectively, important data can be viewed and understood quickly, and aid managers in the identification of visual trends, patterns, and variances for effective decision-making (Few, 2005; Brath and Peters, 2005). The second stream of literature examines the implementation processes utilized by organizations to understand what antecedents lead to successfully installed dashboards. This stream of literature initially focused on dashboards installed in the context of the corporate marketing department of organizations. Dashboards devoted to an organizations’ marketing function are usually the second phase of dashboard implementations, following the executive dashboards. An early practice related article examining the dashboard deployed at Unisys revealed that the success of the implementation is dependent on effectively tying the performance measures to the goals and objectives of the organization (Miller and Cioffi, 2004). Prior to the implementation of the Unisys dashboard, 25 executives invested considerable time and energy to determine which processes and outcomes needed to be measured to drive organizational strategies. These measures are then added to the dashboard to be utilized by the marketing managers. The successful implementation at Unisys showed that dashboards actually drive operational effectiveness through the more disciplined decision-making process (Miller and Cioffi, 2004).
The implementation literature also puts forward that successfully implementing a dashboard requires a significant investment of time on the front end to understand what processes or outcomes are linked to achieving organizational goals and objectives (Miller and
17
Cioffi, 2004; Wind, 2005; Clark et al., 2006; LaPointe, 2008). The key function of executive management is to invest the time to understand this process and select the right performance measures that drive processes or outcomes for their business before implementing the dashboard (Miller and Cioffi, 2004; Wind, 2005; Clark et al., 2006; LaPointe, 2008).
Overall, the literature from practice suggests that the measures included on a dashboard need to be linked to organizational goals and objectives and that effective dashboard design aids in managerial decision-making. The literature in this area examines dashboards implemented at the highest levels of the organization (i.e. executive or marketing dashboards) that are viewed in isolation and not part of the larger MCS of an organization or as a method to facilitate strategic objectives throughout the organization. An emerging line of practice related literature examines how dashboards may interact with organizational strategy and balanced scorecards (BSC; Cokins, 2010). Although there is no empirical research in this area yet, this area holds promise in that the dashboards are part of the overall MCS (Yigitasioglu and Velcu, 2012), and this study posits that they assist with the execution of strategy.
Theory
Two theories are utilized to guide the inquiry of this field study. The use of theoretical guidance in field studies is supported by Miles and Huberman (1994) since it provides an initial basis for the investigation (variables of interest) but still allows for empirical flexibility during data collection and analysis. The two theories used to inform this study are information processing theory (IPT; Galbraith, 1973) and AST (Kahneman and Frederick, 2002).
18
Information Processing Theory
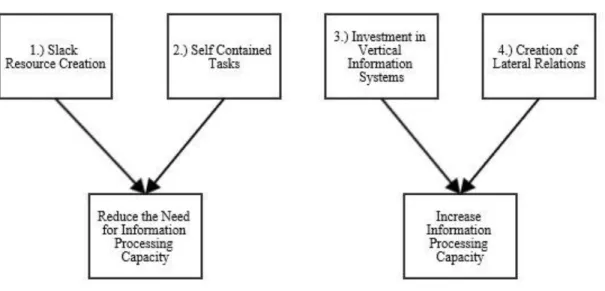
IPT developed by Galbraith (1973) is composed of three primary concepts: the information needs of an organization, the actual processing capacity of an organization, and the match between the needs and capacities (Ismail and King, 2005; Premkumar et al., 2005). The level of uncertainty encountered by an organization impacts this match between needs and capabilities. As an organization experiences higher levels of uncertainty, they need to either reduce their demand (need) for information or increase their ability to process information to maintain the specified level of performance (Galbraith, 1973). IPT puts forth four organizational design strategies that either reduces the demand for information or increases the information processing capability (Galbraith, 1973). See Figure 1.
Figure 1: Organizational Design Strategies
Source: Adapted from Galbraith (1973)
The two design strategies on the left of Figure 1 decrease an organization’s information need by increasing slack resources and/or the development of self-contained tasks. The second
19
set of design strategies on the right side of Figure 1 increase the processing capacity for an organization through higher levels of vertical integration and/or horizontal integration. Galbraith (1973) posits that these four design alternatives are an exhaustive set of options; therefore, organizational performance will suffer if uncertainty increases and none of these strategies are employed to counterbalance the increase in uncertainty.
An integrated information system (IIS), such as an enterprise resource planning (ERP) system, incorporates data across an organization and is the primary platform that provides higher levels of vertical and horizontal integration in today’s organizations, which leads to higher levels of information processing (Ghani, 1992; Premkumar et al., 2005). Organizations are utilizing IIS’s and supporting applications, such as dashboards, to increase their information processing capacity (Seddon et al., 2010).
This study utilizes IPT as the lens to understand why dashboards are being diffused throughout today’s’ organizations. According to IPT, organizations that invest in IT capabilities will increase information processing capabilities to the benefit of the organizational decision-making process (Ismail and King, 2005; Premkumar et al., 2005; Galbraith, 1973).
The Theory of Attribute Substitution
Attribute substitution occurs when a manager assesses a target attribute (strategy) through the mapping of the value of a heuristic attribute (tactics) on the target attribute (Kahneman and Frederick, 2002). Attribute substitution can occur when three conditions are satisfied: 1.) the target attribute is relatively inaccessible; 2.) an associative and semantic attribute (heuristic attribute) is very accessible; and 3.) the substitution of the heuristic attribute for the target attribute cannot be consciously rejected (Kahneman and Frederick, 2002: 54; Choi et al., 2012,
20
2013). In the context of dashboards used for the diffusion of strategy throughout an organization, the first of these conditions is satisfied due to the conceptual, ill-defined, and complex nature of strategic constructs. The second and third conditions are typically met at the lower levels of the organization where tactics are substituted for the strategic objectives.
Research Methods
“…[C]ontrol cannot be studied apart from technology and context because one will never get to understand the underlying ‘infrastructure’ — the meeting point of many technologies and many types of control” (Dechow and Mouritsen, 2005: 691).
This study utilizes a cross-sectional field study to examine the theoretical constructs associated with the diffusion of dashboards to the lower levels of the organization. A field study is the appropriate method for this type of study since the research questions ask “why” questions, the research examines contemporary issues, and the investigator exerts minute or no control over the events (Yin, 2009). While a single field study examines one organization in depth, a cross-sectional field study provides more breadth through the examination of multiple organizations. Since dashboard utilization can vary greatly between organizations, the choice of conducting this study in a cross-sectional format will deepen our understanding of the constructs and relationships through the analysis of cross-case patterns in the data (Lillis and Mundy, 2005).
Research Design
The research design for this study follows Lillis and Mundy’s (2005) four methodological components of research design: 1.) the research begins with the development of the research protocol to guide the research; 2.) a domain of concisely defined observables is established to constrain the research questions; 3.) a sampling strategy is employed to increase the expected
21
variance of the dimensions of the variables of interest; and 4.) the data is analyzed in a disciplined systematic manner to ensure that patterns are drawn out of the data across the cases and then linked back to theory. The research design relating to each of these four components of field study research design is reviewed in greater detail in the ensuing paragraphs.
1 - Research Protocol
The first component of the research design is the establishment of a protocol prior to any collection of data. A protocol is designed to help the researcher focus and guide the data collection and analysis (Lillis and Mundy, 2005; Yin, 2009). The protocol for this study is included for review in the Appendix. The protocol provides a consistent set of questions to each informant, provides propositions to guide the inquiry, and establishes the framework that is utilized to analyze the data from the interviews (Yin, 2009). Semi-structured questions are established in the protocol as a basis for conducting the interviews. The semi-structured questionnaire constrains data collection to the preconceived constructs and variables of interest; however, the questionnaire also allows the interviewer to deviate and delve deeper when new information is revealed (Lillis and Mundy, 2005). The semi-structured interviews increase consistency for the internal validity, but they do not preclude the ability to uncover new ideas and concepts in the field. Additionally, the interviews with managers who used digital dashboards are digitally recorded and transcribed.2
The next step is establishing propositions for the study protocol. The study’s propositions are designed to direct attention to phenomenon that will be examined within the scope of the
2 All of the interviews where the informant was utilizing a dashboard were digitally recorded and transcribed. The
interviews that occurred where no dashboard was available at the organization level or the manager was not utilizing a dashboard were not digitally recorded. In these latter instances, the researcher relied on written notes taken during the interview to construct interview related notes.
22
study and they begin to direct attention concerning where to look for the appropriate evidence (Yin, 2009). The propositions for this study are developed from the review of prior research in related literature streams. An example of a proposition for this study is “(d)ashboard system quality will be positively associated with dashboard utilization,” which is based on the DeLone and McLean (DM; 1992; 2003) information system (IS) Success Model and advanced in Nelson et al. (2005). The explanation building process in a cross-sectional field study does not set out to prove or disprove the propositions; rather the propositions help to guide the research data collection and analysis process to build categories and show the relationships that emerge from the data.
2 - Constructs of Interest
The constructs of interest for this study are defined in the research protocol so that the research questions guiding this inquiry are restrained. Defining the constructs of interest in field studies also increases construct validity (Lillis and Mundy, 2005). The initial constructs of interest for this study are based on prior literature in related fields. These constructs are dashboard quality, dashboard information quality, extent of dashboard utilization, managerial performance, and organizational performance based on the DM (1992, 2003) IS Success model.
IS Success Model Constructs
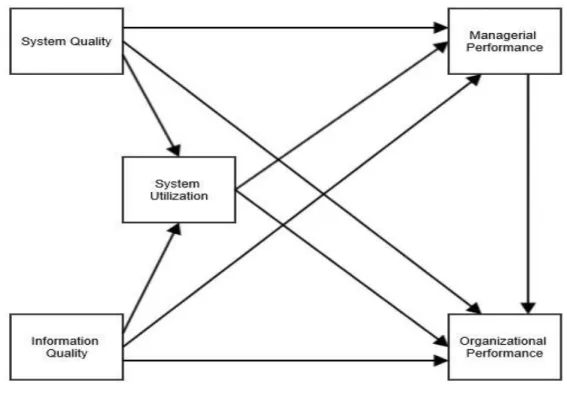
This study relies on DM (1992, 2003) IS Success model to identify the constructs that may be antecedents to dashboard utilization and the diffusion of dashboards throughout organizations. DM proposed an IS Success model that identifies six interrelated dimensions for IS Success: systems quality, information quality, utilization, user satisfaction, individual impact,
23
and organizational impact. DM’s model is the predominate model utilized in literature today to examine the components of successful systems. See Figure 2 below.
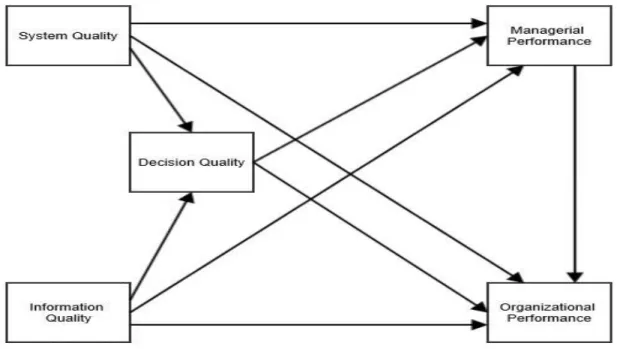
Figure 2: IS Success Model
Source: Adapted from DeLone and McLean (2003)
This study examines the systems quality, information quality, as antecedents to the extent of dashboard utilization, and managerial performance and organizational performance as the consequences of the extent of dashboard utilization. Dashboard system quality is comprised of dashboard system accessibility, data integration, and flexibility (DM, 1992, 2003; Nelson et al., 2005). Accessibility relates to the level of effort required to access the dashboard; integration relates to the extent that the dashboard system can combine information from various sources; and flexibility signifies the level of user control to select the information content (performance measures) and the display format (Nelson et al., 2005). The construct of information quality is comprised of completeness, currency, and accuracy. Information completeness is the degree that
24
all of the possible states applicable to a particular manager are displayed on the dashboard or available through drill down capabilities; currency reflects how well the information represents the current state of the world that the information represents; and accuracy is the extent to which information is correct, unequivocal, believable, and consistent (Nelson et al., 2005).
Dashboard utilization by managers is primarily voluntary; consequently, dashboard utilization is investigated based on the extent of dashboard utilization. The extent of utilization examines the quantity of different tasks and types of uses (i.e. coaching employees, trend analysis, personal performance tracking, or feedback on new initiatives) for which the dashboard is utilized by the end user. The net benefits shown in the IS Success model link success to both managerial performance and organizational performance. This study examines both of these constructs to understand if the diffusion of dashboards has benefited organizations in either of these areas: managerial performance and/or organizational performance. Prior research shows positive associations between managerial/organizational performance and the dimensions of systems and information quality as well as utilization (LaValle et al., 2011; Chapman and Kihn, 2009; Teo and Wong, 1998; Goodhue and Thompson, 1995). Additional research has positively linked strategy aligned performance measures to managerial performance (Burney et al., 2009).
3 - Sampling Strategy
The third component of research design prescribed by Lillis and Mundy (2005) is establishing a sampling strategy to increase the expected variance of the variables of interest. However, the selection of organizations for inclusion in field studies is typically not random (Kaplan, 1986); rather, it is viewed as sampling by convenience. As noted by Bruns and McKinnon (1993: 90) who openly admit that they ‘‘selected on the basis of location and
25
accessibility, personal contacts, and expected willingness to help with the research process’’, researchers sometimes experience difficulties gaining access to organizations. In the beginning of this study, access to informants is obtained through convenience so that the range of dashboard utilization could be understood from multiple angles. Once the initial data is collected and analyzed, the sampling strategy is redirected toward informants who could provide the data needed to further saturate the categories emerging from the data.
The suitable context for examining management controls is the through their utilization and level of importance to decision-makers (Langfield-Smith, 1997). Consequently, the unit of analysis for this study is upper level to mid-level operations managers. The majority of the previous research in the area of providing information to managers concentrates on the manufacturing sector (Johnson and Kaplan, 1987; McKinnon and Bruns, 1992) since this industry requires a high level of information processing and relies heavily on the vertical integration of the IT system to provide the information processing capacity (Raymond and Magnenat-Thalman, 1982; Ismail, Abdullah, and Tayib, 2003). This study includes more sectors than manufacturing in order to observe greater variation in dashboard utilization. The following industry sectors are included in the study: manufacturing, financial, IT, healthcare, consulting, and retail. A cross-section of executives and managers are interviewed to gauge the impact of the diffusion of dashboards from multiple perspectives. Consequently, in addition to interviewing upper level and mid-level managers in operational positions, executive managers, IT managers, finance directors, marketing managers, organizational trainers, and industry consultants are also interviewed.
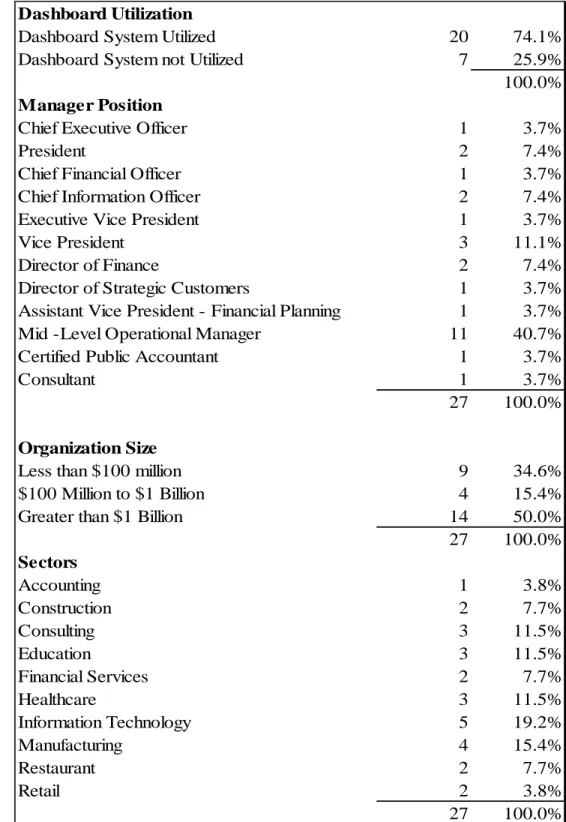
In total, 27 interviews are conducted for this study. Out of the 27 interviews conducted, 20 interviews focus on managers that utilize, service, or design dashboards in their daily work
26
life. The remaining 7 interviews are conducted with individuals that are not currently utilizing dashboards in their daily work life, and these interviews are used to gain perspective on why dashboards are not utilized by the individual or organization. For example, the chief financial officer at a Fortune 500 restaurant conglomerate states that their organization is still at least two years away from implementing any kind of dashboard system based on poor data integration and legacy system issues. The reasons of poor data integration and the coordination of old legacy systems is a consistent for the organizations that have yet to implement dashboards in their organizations. Table 1 shows the descriptive statistics for the informants and their organizations.
27 Table 1: Informant Descriptive Statistics
Dashboard Utilization
Dashboard System Utilized 20 74.1%
Dashboard System not Utilized 7 25.9%
100.0%
Manager Position
Chief Executive Officer 1 3.7%
President 2 7.4%
Chief Financial Officer 1 3.7%
Chief Information Officer 2 7.4%
Executive Vice President 1 3.7%
Vice President 3 11.1%
Director of Finance 2 7.4%
Director of Strategic Customers 1 3.7%
Assistant Vice President - Financial Planning 1 3.7%
Mid -Level Operational Manager 11 40.7%
Certified Public Accountant 1 3.7%
Consultant 1 3.7%
27 100.0%
Organization Size
Less than $100 million 9 34.6%
$100 Million to $1 Billion 4 15.4%
Greater than $1 Billion 14 50.0%
27 100.0% Sectors Accounting 1 3.8% Construction 2 7.7% Consulting 3 11.5% Education 3 11.5% Financial Services 2 7.7% Healthcare 3 11.5% Information Technology 5 19.2% Manufacturing 4 15.4% Restaurant 2 7.7% Retail 2 3.8% 27 100.0%
28
The majority of the managers interviewed utilize dashboards (73 percent) and hold positions ranging from the chief executive officer to consultants. The largest quantity of interviews took place with mid-level managers (38 percent). The size of the organizations participating in this study ranged from young internet start-ups (less than $10 million in annual revenue) to large multi-national financial institutions. One half of the managers worked for large organization with annual revenue in excess of $1 billion. The interviews are spread over 10 general industry sectors ranging from IT firms (software, internet sales, and internet marketing) to healthcare. The highest concentration of interviews occurs in the IT and manufacturing sectors. These two industry sectors account for 35 percent of the interviews.
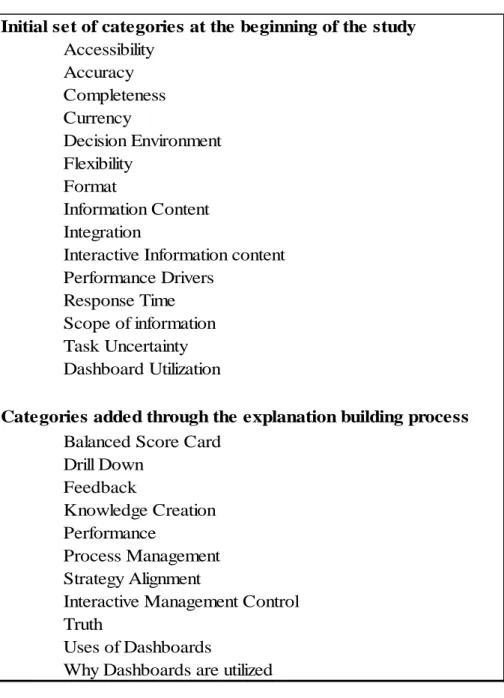
4 - Systematic Analysis
Lastly, Lillis and Mundy (2005) recommend that the data analysis take place in a disciplined, systematic manner to assure that patterns in the data are drawn out across the multiple cases and then linked back to theory. This systematic analysis of the data is modeled after Yin’s (2009) explanation building process. Explanation building is the stipulation of a set of causal links between categories. The explanation building process is iterative, starting with the establishment of the initial propositions and then comparing the initial cases against the propositions. Next, the propositions are revised as needed based on the emerging patterns found in the data to guide the additional data collection. In order to collect the data in relation to revised propositions, semi-structured interview questions are updated to include coverage of any new emerging categories. Next, additional data is collected and compared to the propositions again. This process is repeated as many times as needed until data saturation is achieved. Data saturation is achieved when the interview process does not yield any new data and only confirms
29
the patterns emerging from the previous interviews (Sutton et al., 2012; Yin, 2009). After saturation is achieved, relationships between the categories are then proposed based on the patterns revealed in the cross-section of data (Yin, 2009; Lillis and Mundy, 2005).
Validity and Reliability
In addition to the four components of research design specified by Lillis and Mundy (2005), the research design for this study is established to increase the study’s level of validity and reliability. Based on the inherent design of field studies, achieving acceptable levels of construct validity, internal validity, external validity, and reliability is always a concern that is addressed in the research design. The first type of validity addressed is construct validity, which is the successful operationalization of the theoretical constructs. In order to attain a high level of construct validity, four processes need to occur. First, the specific types of changes to phenomenon to be studied are clearly identified (Yin, 2009). For this study, the changes to phenomenon are in the context of the diffusion of dashboards throughout the organization and the impact on utilization. Second, clear construct definitions are defined in the research protocol (Lillis, 2006). Third, multiple sources of evidence and the creation of a study database increase construct validity as well (Yin, 2009). Multiple sources of evidence are obtained as outlined in the protocol; however, archival data surrounding the dashboard proved difficult to collect. The actual dashboard content is observed and described in the interview notes. Fourth, a study database is created for each organization containing the interview transcripts, interview notes, and any additional reports or documents collected at the interview.
Internal validity is the proper conclusion of the effect of independent variables on dependent variables (Yin, 2009; Lillis, 2006). Internal validity is addressed in this study through
30
seeking common patterns across the data in a disciplined, systematic manner until the evidence converges and the analysis reaches saturation.In addition, the analysis process is open to rival or alternative explanations for the data that do not match the propositions (Yin, 2009; Lillis, 2006). In order to achieve external validity, the contribution from the field research should be potentially generalizable; and, cross-sectional field research has an advantage in establishing this potential generalizability over single field studies (Lillis, 2006, emphasis added).
Attaining reliability in field studies is difficult, since no statistical test can be employed to verify the level of reliability in the data. The potential for bias in observation and data collection is always a concern for this type of research (Lillis, 2006). Therefore, two strategies are utilized to increase reliability: preparing a study protocol and increasing the researcher’s knowledge of effective interview techniques. The research protocol is discussed in the previous section. The researcher studied literature on interviewing techniques in order to increase knowledge in this specialized area (Gordon, 1987; Patton, 1987).
Collecting, Coding, and Analyzing Case Study Data
The following discourse outlines the actual steps involved in collecting and analyzing the data from this cross-sectional case study. Before each interview is conducted, the informants are provided a copy of the semi-structured questions to prepare for the interview and follow along with the questions as the interview progresses. The interviews are digitally recorded. At the beginning of each of the interviews, a brief overview of the study’s research purpose is reviewed with the informant to help the informant understand the context of the research. After each interview is completed, ‘interview notes’ are written down by the researcher. The interview notes contain the following types of items: the researcher’s initial thoughts about the