S183
[Journal of Legal Studies, vol. 36 (June 2007)]
䉷2007 by The University of Chicago. All rights reserved. 0047-2530/2007/360S2-0007$10.00
An Empirical Study of the Impact of Tort
Reforms on Medical Malpractice Settlement
Payments
Ronen Avraham
A B S T R A C T
This paper evaluates the impact of six different types of tort reforms on the frequency, size, and number of total annual settlements in medical malpractice cases between 1991 and 1998. Medical malpractice data come from the National Practitioner Data Bank, which contains more than 100,000 malpractice settlement payments in the study time frame. Of the six tort reforms examined, two reforms (caps on pain and suffering damages and limitations on joint and several liability) reduced the number of annual payments, and two reforms (caps on pain and suffering damages and the periodic-payment reform) reduced average awards. Caps on non-economic damages had an effect on total annual payments, although the statistical signifi-cance of that effect was weak. The joint effect of enacting all six reforms was statistically significant for reducing the number of cases but not the state-level average award or total payments.
1 . I N T R O D U C T I O N
Legislative alterations to common-law tort doctrines—otherwise known as “tort reform”1—have been a hot political issue for at least 3 decades. 1. Some object to the term “tort reform,” as it suggests modifications to something that is clearly defective. Whether the tort system is broken is a complicated question that touches upon both philosophical and economic questions; these will not be dealt with in this paper. However, this term will be used throughout this paper as it is a well-entrenched term referring to the host of alternatives to tort law doctrine addressed here.
RONEN AVRAHAM is Associate Professor of Law at Northwestern University School of Law. David Lee, Feng Lu, and Xun Tang provided excellent research assistance. I also thank Jennifer Arlen, Dan Carvell, Issa Kohler-Hausmann, Keith Hylton, Bentley MacLeod, Larry Mohr, Max Schanzenbach, Eric Talley, and Kathy Zeiler for their careful reading of
In particular, reforms of medical malpractice law have held a central place on many state legislative agendas. Dozens of different reforms have been enacted, struck down, or reenacted in the recent decades (Avraham 2006b). Even at the national level, tort reform has made an appearance. Indeed, no fewer than 16 bills to federalize the various aspects of medical malpractice law (currently governed by state common law) have been debated in the U.S. Congress over the last decade.2Most recently, a bill directed at limiting defendants’ liability in medical malpractice lawsuits was passed by the Senate on May 6, 2006 (S. 22, 109th Cong., 2d Sess. [2006]).
Medical malpractice law is clearly an issue of great concern not only to the public at large but also to many influential organized political and professional associations. Interest groups such as the American As-sociation of Justice, American Tort Reform AsAs-sociation, America’s Health Insurance Plans, American Medical Association, and Pharma-ceutical Research and Manufacturers of America, to name a few, spend hundreds of million of dollars each year in the battle over tort reform.3 These high stakes make the accurate understanding of the effects of tort reform important. The extent to which certain reforms are or are not effective can shed light on the strategic behavior of health care providers, medical liability insurers, and litigants facing a changed legal
previous drafts and David Dausey, Jonathan Klick, and Catherine Sharkey for sharing some of their data. The paper benefited from comments received at the 2005 American Law and Economics Association annual meeting, the 2005 Stanford/Yale Junior Faculty Forum, the 2005 Tel Aviv Law and Economics workshop, the 2005 Hebrew University Law and Eco-nomics workshop, the 2006 American Association of Law Schools annual meeting, the 2006 Berkeley Law and Economics workshop, the 2006 Rand Institute medical malpractice conference, the 2006 Texas Law and Economics workshop, the 2006 Georgetown Law and Economics workshop, the 2006 University of Toronto Law and Economics workshop, and the 2006 Columbia Law and Economics workshop. I also thank an anonymous referee for helpful comments.
2. H.R. 3103, 104th Cong., 2d Sess. (1996); H.R. 956, 104th Cong., 2d Sess. (1996); H.R. 1091, 105th Cong., 1st Sess. (1997); H.R. 2242, 106th Cong., 1st Sess. (1999); H.R. 2563, 107th Cong., 1st Sess. (2002); S. 812, 107th Cong., 2d Sess. (2002); H.R. 4600, 107th Cong., 2d Sess. (2002); H.R. 5, 108th Cong., 1st Sess. (2003); S. 2061, 108th Cong., 1st Sess. (2003); S. 11, 108th Cong., 1st Sess. (2003); S. 2207, 108th Cong., 2d Sess. (2004); H.R. 4280, 108th Cong., 2d Sess. (2004); H.R. 534, 109th Cong., 1st Sess. (2005); S. 366, 109th Cong., 1st Sess. (2005); S. 367, 109th Cong., 1st Sess. (2005); S. 354, 109th Cong., 1st Sess. (2005); H.R. 5, 109th Cong., 1st Sess. (2005); S. 22, 109th Cong., 2d Sess. (2006).
3. The data are available at the Center for Public Integrity, Lobbywatch: Top 100 Companies and Organizations (http://www.publicintegrity.org/lobby/top.aspx?actp
T O R T R E F O R M S A N D S E T T L E M E N T P A Y M E N T S / S185
regime. Understanding the effects of tort reform is also important for policy makers in their attempts to change the legal, health care, and insurance markets. Moreover, the actual impact of tort reforms is an important component for courts in reviewing the constitutionality of tort reforms. For example, the Supreme Court of Wisconsin recently invalidated a statute placing a cap on noneconomic damages in medical
malpractice actions (Ferdon v. Wisconsin Patients Comp. Fund, 701
N.W.2d 440 [Wis. 2005]). Applying the rational basis test, the court held that the statute was not rationally related to the legislative objective of lowering malpractice insurance premiums and reducing overall health care costs only after examining various empirical studies on the impact of tort reform.4In contrast, the Supreme Court of Utah recently upheld such caps on the basis of the perceived reasonableness of the empirical studies relied on by the Utah legislature (Judd v. Drezga, 103 P.3d 135 [Utah 2004]). Thus, careful analysis of the effects of different tort re-forms may help determine the constitutionality of these laws.
Given the political (not to mention public health) import of these issues, it is surprising that academic scholarship on the effect of these reforms on litigation outcomes has found such mixed results. In fact, many studies have failed to detect any impact of these hotly debated reforms on either settlement practices or damage awards. However, as this paper demonstrates, previous studies faced significant data limita-tions and involved misguided methodological assumplimita-tions. Some of the methodological problems that may have limited the ability of previous studies to detect effects include failure to properly reflect substantive changes in the law in the data, a focus on litigated as opposed to settled cases, small sample size, and inadequate model specification.
However, the most frequent methodological mistake in past studies was the failure to properly link cases to applicable law. Specifically, cases were coded as subject to reforms when in fact they were not, for several reasons. First, cases were often miscoded as subject to reforms because scholars believed that the relevant date was the filing of the case, whereas in most cases the relevant date is the injury date. Second, cases were
4. The Alabama Supreme Court previously reached the same conclusion after reviewing empirical studies (Moore v. Mobile Infirmary Ass’n, 592 So.2d 156 [Ala. 1991]). But even before the growth in empirical work, courts were involved in their own back-of-the-envelope estimates of whether caps (and other reforms) can achieve a legislature’s goal of reducing costs. See, for example,Arneson v. Olson, 270 N.W.2d 125 (N.D. 1978), and
Carson v. Maurer, 424 A.2d 825 (N.H. 1980). Both North Dakota and New Hampshire have struck down caps on pain and suffering damages.
often miscoded because of misunderstandings regarding the retroactivity of constitutionally invalidated laws. Striking down a reform means that not only future cases but also pending cases will not be subject to it. The latter point has escaped previous scholars’ attention. Yet properly linking cases to applicable law is essential to accurately estimating the effect of reforms on litigation outcomes.
In this study, I examine the effect of various reforms on the frequency, average size, and total annual payments of medical malpractice settle-ments between 1991 and 1998. Specifically, the study tracks the effect of six types of reform: caps on noneconomic damages, caps on punitive damages, higher evidentiary requirements for punitive damages, limi-tations on joint and several liability, limilimi-tations on the collateral source rule, and periodic payments of awards. These six reforms were chosen because they are the most prevalent reforms that states have enacted in the last decades5and because they all appear in the federal bills debated in Congress.6
Most previous studies employing state-level data estimated little or no impact of reforms on case outcomes. The only exception to this overall pattern is a reform that caps pain and suffering damages; this reform appears sometimes to decrease the number of positive payments and at other times to decrease the magnitude of payments. The key results of this study show some evidence in support of the conclusions of past research, while other results provide striking new evidence con-trary to the conclusions of previous research. The state-level results (number of cases and total payments) are consistent with some past research indicating that a cap on noneconomic damages is the only reform that produces moderate effects on aggregate state-level variables (although I also find some evidence that limitation of joint and several liability and the periodic-payment reforms have some effect). The results
5. See Table 1, which shows the prevalence of six reforms.
6. Nine reforms are found in the latest federal bill (S. 22, 109th Cong., 2d Sess., May 3, 2006 [http://www.govtrack.us/congress/billtext.xpd?billps109-22]): limitation of 3
years for filing a lawsuit, cap of $250,000 on noneconomic damages, abolition of joint and several liability, limitation on contingency fees, abolition of the collateral source rule, proof of malicious intent to injure the victim by clear and convincing evidence, cap of $250,000 or 2 times monetary damages (whichever is higher) on punitive damages, periodic payments if future damages exceed $50,000, and immunity from punitive damages for manufacturers of drugs approved by the Food and Drug Administration. I do not study the statute of limitations and contingency fee reforms because of a lack of variance among states in these reforms during the time period studied. Nor do I study the immunity of drug manufacturers, as it is extraneous to my data set (which tracks medical malpractice lawsuits and settlements against physicians and hospitals).
T O R T R E F O R M S A N D S E T T L E M E N T P A Y M E N T S / S187
at the case level (average award), however, are stunning. Once the data are adequately coded for the retroactive applicability of striking down reforms, caps on noneconomic damages and the periodic-payment re-form each were correlated with a large decrease (up to 55 percent) in the average settlement payment. This effect is significant at the 1 percent confidence level.7
Yet the results also suggest that tort reforms may provide incentives to plaintiffs’ lawyers to wait until a reform is struck down before settling. In that case, the total economic effect of tort reforms is much smaller, because it applies only to a small fraction of the cases that probably would not have been subject to the reforms.
This study offers valuable contributions to our understanding of the effects of tort reform on case outcomes. First, it incorporates two data sets never before used for this purpose: the National Practitioners Data Bank (NPDB), which is the most comprehensive data set on medical malpractice settlement, and the newly constructed Database of State Tort Law Reforms (DSTLR), which incorporates data from previously avail-able sources (including previous compilations, research papers, and pub-lic information) as well as independently researched data tracking re-forms (Avraham 2006b). The DSTLR documents dozens of rere-forms in all 50 states and Washington, D.C., since the 1980s.
Second, this study tracks settlements rather than judgments. As is well known, only a small fraction of cases are litigated. More than 90 percent of the medical malpractice cases are settled (Danzon and Lee 1983). Thus, from a policy-making perspective, documenting the effect of tort reform on settlements is of utmost importance. Moreover, this study does not rely on the representativeness of a sample of settlements to estimate population parameters; instead, at least in theory, the data represent the entire universe of settlements in the United States during the time period studied.8Third, the study tracks settlements for injuries that occurred between 1991 and 1998 and were settled by December 31, 2005. Thus, the study is the most recent analysis to date in terms of the years it covers. Fourth, the study tracks the impact of tort reform in all 50 states, whereas previous research studied a subsample of states. Fifth, the study tabulates cases according to injury date and not filing
7. The impact of the periodic-payment reform, however, exists in what I call the sep-arate specifications but not in the joint specification.
8. As I will explain in more detail, there are reasons to believe that the Database of State Tort Law Reforms does not record all settlements. Still, I use about 100,000 obser-vations, while other studies use samples of only a few hundred cases.
date.9A review of previous literature suggests that this might not have been done sufficiently in past studies. If so, previous results might be unreliable. Thus, besides the important policy implications of the find-ings of this analysis, this study also advances the empirical literature on the impact of tort reform by exposing and correcting past methodolog-ical flaws.
The structure of this paper is as follows. Section 2 reviews relevant literature. Section 3 describes in detail the two data sets (the NPDB and the DSTLR) used in this study. Section 4 introduces the statistical meth-odology and econometric models used to test three main empirical ques-tions. Section 5 presents the results, explains various limitations of the estimation strategy, and provides possible explanations for why the im-pact of tort reforms may not be detected in empirical studies. Section 6 concludes by suggesting that the ongoing tort reform research effort should be shifted to exploring the effects of medical malpractice reform on microeconomic variables such as infant mortality, defensive medicine, and health insurance coverage.
2 . L I T E R AT U R E R E V I E W
There is a dearth of reliable empirical or experimental evaluations of medical malpractice tort reform (Diamond, Saks, and Landsman 1998;
Babcock and Pogarsky 1999; Robbennolt and Studebaker 1999).10 In
fact, over the last 3 decades, only a dozen or so empirical studies have examined the impact of tort reforms on medical malpractice payments or medical liability insurance premiums.
The first wave of empirical studies was conducted in the 1980s and examined the tort reform revolution of the 1970s. These studies generally used multivariate regression to determine the effect of changes in various tort doctrines on the frequency and severity of malpractice claims using data obtained from insurance companies. But these studies, reviewed by Zuckerman, Koller, and Bovbjerg (1986), drew mixed conclusions. Some
9. See Section 2.4 for a description of how awards and settlements were matched to the reforms in effect at the time.
10. In experimental literature, one finds several studies that employ classroom exper-iments with students acting as mock jurors under differing damage cap regimes. These studies usually conclude that damage caps introduce cognitive biases such as anchoring and recalibration. While these studies have the advantage of a laboratory setting that can control for outside influences, they raise questions of robustness that can be answered only by further empirical field research.
T O R T R E F O R M S A N D S E T T L E M E N T P A Y M E N T S / S189
studies concluded that these reforms were ineffectual in reducing mal-practice liability burdens, while a majority concluded that they were effective in this regard. Regardless of their findings, these studies are based on data that are over 2 decades old; they predate recent reform measures taken by states and cannot take into account the longer-term effects of tort reform.
The second wave of studies from the late 1980s and early 1990s is summarized in a 1993 review by the Office of Technology Assessment (OTA) that explores the effect of tort reforms on malpractice costs. Comparing results from six studies (Adams and Zuckerman 1984; Dan-zon 1986; Zuckerman, Bovbjerg, and Sloan 1990; Sloan, Mergenhagen, and Bovbjerg 1989; Barker 1992; Blackmon and Zeckhauser 1991), the OTA noted that all of the studies “suffer from methodological problems and limitations that make interpretation and comparison of their results difficult” (U.S. Congress 1993, p. 16). The OTA study concluded that capping total damage awards was the only tort reform that consistently seemed to reduce payments per claim and therefore malpractice insur-ance premiums. However, there were inconsistent results for caps on noneconomic damages, a subset of this tort reform.
A third wave of studies, from the mid-1990s to the early 2000s, is reviewed in a 2004 Congressional Budget Office (CBO) report (U.S. Congress 2004). Reviewing nine studies (Born and Viscusi 1998; Browne, Lee, and Schmit 1994; Browne and Puelz 1999; Kessler and McClellan 1996, 2000, 2002; Thorpe 2004; Viscusi et al. 1993; Yoon 2001), the CBO flagged methodological problems and data limitations similar to those mentioned above. Again, the most consistent finding of the CBO was that caps on damages awards reduced the number of lawsuits filed, the magnitude of the awards, and insurance costs. Yet some of the studies reviewed failed to document any measurable effect of tort reforms, and, more generally, most findings were not indepen-dently corroborated by other studies.
In sum, a brief review of prior studies suggests that there is no con-sensus on the impact of tort reform on case outcomes. Some studies find certain reforms effective, while others find that the same reforms are ineffective. Caps on damages are probably the only reform that keeps surfacing as effective. Overall, the disparate findings should not be sur-prising given differences in the legal and claims data sets, econometric methods, variables, and time periods. A more recent survey (Mello 2006) reaches the same conclusion.
2.1. Data Description
The study draws from two main data sources: (1) a database of medical malpractice payments and (2) a database of tort reforms affecting med-ical malpractice claims. Each data source is discussed in detail below. After describing both data sets, I explain one of the contributions of this study, which is correctly matching malpractice payments to tort reforms.
2.2. Medical Malpractice Payments
I obtained medical malpractice payment information from the NPDB Public Use Data File, dated December 2005 (U.S. Department of Health and Human Services 2005). This file is published quarterly by the U.S. Department of Health and Human Services in accordance with the Health Care Quality Improvement Act of 1986 (42 U.S.C. secs. 11101–11152 [1986]) and its implementing regulations (45 C.F.R. 60). Beginning September 1, 1990, these laws require that (with some ex-ceptions) all medical malpractice payments be reported to the
Depart-ment of Health and Human Services within 30 days of payDepart-ment.11
While the original database contains more than 240,000 medical malpractice cases—both court awards and settlements—in all 50 states, the District of Columbia, and U.S. territories, payments were made in only about 160,000 between 1991 and 2005. Moreover, because the data set overrepresents cases that settle early, which most likely involve minor injuries with smaller damages, the data for this study were limited to settlements in the 50 states for injuries occurring between 1991 and 1998. The final data set comprised 105,944 cases. Table 1 provides descriptive statistics of these data.
Like any other database, the NPDB is not perfect.12I ran analyses in which I corrected in different ways for the identified problems.
11. Self-insured practitioners originally reported their malpractice payments. However, on August 27, 1993, the U.S. Court of Appeals for the D.C. Circuit reversed the December 12, 1991, federal district court ruling inAmerican Dental Association v. Shalala(3 F.3d 445 [U.S. App. D.C. 1993]) and held that self-insured individuals were not “entities” under the Health Care Quality Improvement Act and did not have to report payments made from personal funds. All such reports have been removed from the National Practitioner Data Bank (NPDB).
12. Avraham (2006a) contains a detailed analysis of the NPDB’s deficiencies and a comparison with other databases that are widely used in the literature.
T O R T R E F O R M S A N D S E T T L E M E N T P A Y M E N T S / S191
2.3. Tort Reforms
The DSTLR, which supplied state-level variables, is a new data set I compiled with the assistance of a National Science Foundation grant (Avraham 2006b) The database was assembled by cross-referencing my own review of the laws and court cases of the 50 states (and Washington, D.C.) from 1980–2005 to existing compilations.13In the process, it was discovered that other available compilations suffer from one or more of the following problems: missing reforms, missing or erroneously coded dates that reforms were in effect (hereafter, effective dates), missing or incorrectly reported Supreme Court cases reviewing the constitutionality of these reforms, and a lack of information regarding whether the law requires that the jury be advised of the applicable reform. In contrast, the DSTLR includes complete variables for reform title, description, effective date, whether the jury was advised or explicitly not advised of the applicable rule, whether the reform was upheld or struck down by the state supreme court, and, in such cases, whether it was amended, repealed, or replaced by another law. In the spring of 2006, the first draft of the data set was posted online. After correcting various errors, the second draft was posted online in the fall of 2006. The second version
of the DSTLR was used for this study.14
In this study I explore the impact of six tort reforms. These reforms are either enacted by a state’s legislature or adopted by its courts.15These six reforms not only appear in the medical malpractice bill passed by the House or the Senate but also are the most prevalent tort reforms in the United States.16
The most common reform passed in state legislatures in recent cades is the limitation of joint and several liability for malpractice
de-13. The compilations include the American Tort Reform Association, State and Federal Reforms (http://www.atra.org/reforms/); National Conference of State Legislators, Medical Malpractice Tort Reform (http://www.ncsl.org/standcomm/sclaw/medmaloverview.htm); Westlaw, 50 State Surveys, Health Care, Medical Malpractice, Tort Reform; and Cohen (2005).
14. I wish to thank Bentley MacLeod and Dan Carvell for sending me a long list of corrections, almost all of which were found to be accurate.
15. Sometimes courts, rather than state legislatures, adopt tort reforms. Judicial adop-tions of higher evidentiary requirements for securing punitive damages are the most com-mon type of nonlegislative reform.
16. I was originally interested in the nine reforms that appear in the deferral bill. However, because of a lack of enough variation during the relevant years for two of them (statute of limitations and contingency fee reforms) and a lack of relevance for one of them (limiting liability for drug manufacturers), I eventually analyzed just six of them.
S192 Table 1 . Descriptive S tatistics V ariable Description Mean SD Dependent variables: A verage payments Settlement amount ($) 249,988 90,918 Number of cases Number of settlements per d octor (per person) 1620 682 T otal payments T otal annual payouts per state ($) 52,100,000 68,200,000 Reforms: R_CN Equals one if state has p assed a cap on noneconomic damages .32 .47 R_CP Equals one if state has adopted a cap on punitive damages .36 .48 R_CS Equals one if state has adopted limitations on the collateral source rule .62 .48 R_JS Equals one if state has adopted limitations on joint and several liability .75 .43 R_PE Equals one if state has adopted evidentiary requirements for punitive damages .54 .50 R_PP Equals one if state has allowed periodic payments .58 .49 State controls: C_65 Percentage of population over 65 12.66 2.04 C_BS Percentage with bachelor’s degrees 22.18 4.33 C_CarDeath Car fatalities per m illion people 173.87 56.05 C_HealthSpend Per capita health care expenditures ($) 4,323.83 5 58.471
S193 C_Income A nnual income per capita ($) 26,866 3,911 C_Lawyer Lawyers per capita 289.85 90.73 C_LifeExp Life expectancy for newborns (years) 75.65 1.28 C_MedCPI Consumer price index for medical goods 213.11 21.12 C_Metro Metropolitan percentage 67.51 20.72 C_NewRes Percentage of new residents 3.27 1.42 C_Pop Population (1,000s) 5,242 5,714 C_Unempl Unemployment rate 5.58 1.55 Individual controls: I_AgeGroup Age o f p hysician at event (years) 42.78 10.76 I_CaseLength Case length (years) 3.45 1.54 I_Grad Y ear of graduation 1969.89 11.39 I_StFundPay Equals one if state fund paid .03 .18 I_Field 15 Fields of physicians — — Note. Dependent variables and individual controls are from U.S. Department of Health and Human Services (2005), and reforms are from A vraham (2006b).
fendants. Forty-one states had some variation of this reform in 2004. The common-law doctrine of joint and several liability allows the plain-tiff to collect full damages from any of the defendants irrespective of the defendant’s proportional fault, should one defendant be insolvent. This means that the plaintiff can go after “deep-pocket” defendants, like hospitals, and collect all damages even if the doctor is the main party at fault. The reforms adopted by states limit this possibility by either imposing liability based on fault or allowing for joint and several liability only if the defendant is responsible for a significant proportion of the harm, usually at least 50 percent.
Discretionary or mandatory consideration of payment for medical costs is another common reform established in 35 states by 2004. The collateral source rule was developed by common-law courts in the nine-teenth century when insurance became more popular. The rule says that the defendant’s damages will not be offset by the plaintiff’s insurance coverage. An implication of this rule is that the plaintiff may receive compensation for more than his or her full harm in case of an accident. The reforms adopted by states either require or allow courts to offset the plaintiff’s private and/or public insurance benefits from the awarded damages.
Periodic payment of large future damage awards is now allowed or required in 23 states. The reform allows or requires courts to award future damages that are above some threshold, usually $200,000, in periodic installments. This reform eases the burden on the defendant, who can purchase an annuity for that purpose, and can potentially re-lieve a defendant of a portion of his or her due damages if the plaintiff dies before the damages are fully awarded.
Some of the more controversial reforms involve caps on damage awards. These caps most commonly apply to noneconomic damages (23 states) or punitive damages (27 states). There are many types of caps. Some reforms impose a cap of a fixed dollar amount, sometimes indexed to inflation, while others use a multiplier of the economic damages. Many states have implemented heightened pleading, evidentiary, or other pro-cedural standards for punitive damages (34 states). For example, many states now require punitive damages to be proven with “clear and con-vincing evidence” rather than merely the traditional “preponderance of the evidence.” Other states require proof that defendant acted with “de-liberate disregard” or “willful indifference” toward the plaintiff’s po-tential injury.
T O R T R E F O R M S A N D S E T T L E M E N T P A Y M E N T S / S195
2.4. Matching Reforms to Payments
After identifying the pertinent data sets, analyzing them together re-quired accurately matching the malpractice payments to tort reforms. There are several important legal substantive and related methodological issues associated with the effective date of the reform that are carefully addressed in this study that enhance the reliability of the results. First, in many cases there is a lag between enactment date and effective date. For example, a reform might be passed on July 1 with an effective date of January 1 the following year. Second, legislative creation of reforms has only (subject to some qualifications presented below) prospective application unless expressly made retroactive, whereas striking down reforms has retrospective applicability, because striking down a law de-clares it to never have been constitutional. Yet the prospective appli-cability of the enactment of reforms is not as straightforward as it ini-tially seems. For the purposes of matching a case to the applicable legal regime, the relevant date in most cases is the injury date and not the complaint filing date. Because those malpractice cases with injury dates before the passage of a tort reform were subject to the prereform legal regime, careful coding assured that this was accurately reflected in the data. Previous studies have (mistakenly, in my view) assumed that the relevant date is the filing date.17The general common-law rule, however, is that tort reform is not a mere procedural rule but actually affects the substantive rights of medical malpractice plaintiffs and thus may not be applied retroactively to pending cases unless expressly stated by the legislature.18Moreover, even if the legislature explicitly dictated that the 17. For example, Danzon (1984) seems to have used the filing date as the relevant date for whether the reform applies to specific cases. Thus it seems that many of the claims used in her data set, those closed between 1975 and 1978, should not have been coded as subject to reforms that were enacted in 1975 and 1976. First, claims closed in these years were most likely for injuries that occurred before 1975. Second, those claims that did occur after 1975–76 and closed before 1978 were likely only the small claims, a fact that creates selection bias in the analysis. The same problem appears in Danzon (1986, p. 80), which argues that “tort reforms are likely to affect the filing and disposition of claims during the calendar years in which the laws are in effect.” Sharkey (2005, table 1) uses filing dates instead of injury dates for Ohio and Illinois reforms in her analysis of punitive damages. However, for many of the punitive damages reforms, the effective date is indeed the filing date.
18. The general principle that statutes operate only prospectively unless expressly stated “is familiar to every law student” (United States v. Security Industrial Bank, 459 U.S. 70, 79–80, 103 S. Ct. 407, 413, 74 L. Ed. 2d 235 [1982]). The principle has been applied repeatedly to medical malpractice reforms. SeeDavis v. Omitowoju, 883 F.2d 1155 (CA3 V.I. 1989);Marcel v. Louisiana State Dep’t of Public Health, 492 So. 2d 103 (La. 1986),
tort reform would apply retroactively on the basis of the filing date, courts might strike it down as unconstitutional on due process grounds.19 The general rule is therefore that tort reform applies only to injuries occurring after the effective date and does not apply to injuries occurring before the effective date even if the complaint is filed after the effective date. The rare exception is when legislatures issue an explicit stipulation that the statute applies to cases filed after the effective date and that stipulation is not struck down as unconstitutional.20
The injury date is the relevant date for most, but not all, of the reforms. Some reforms explicitly stipulate that they apply to cases filed after the effective date, and thus essentially apply to pending cases as well.21This means that even injuries that occurred before a reform was enacted would have been subject to the postreform legal regime (assum-ing that they were not resolved after the reform was struck down). Since the NPDB does not provide the filing date, the applicability of these reforms to the appropriate cases could not be adequately coded.
Third, the retroactive applicability of striking down a reform implies that malpractice cases initiated after a reform was enacted, yet pending at the time the reform was struck down, should be treated as subject to the prereform regime. The reason is that striking down a reform as unconstitutional declares it to never have been valid law. I suspect that many of the previous studies, especially those done by nonlawyers, ne-glected to account for this point. Moreover, striking down reforms
in-cert. den. (La.) 494 So. 2d 334;Martino v. Sunrall, 619 So. 2d 87 (La. 1993);Graley v. Satayatham, 343 N.E.2d 832 (Ohio 1976);Allen v. Fisher,118 Ariz. 95, 574 P.2d 1314 (1977); Bolen v. Woo,96 Cal. App. 3d 944, 158 Cal. Rptr. 454 (1979); Robinson v. Pediatric Affiliates Medical Group,98 Cal. App. 3d 907, 159 Cal. Rptr. 791 (1979).
19. See, for example,Simon v. St. Elizabeth Medical Center, 355 N.E.2d 903 (Ohio 1976); inMartin by Scoptur v. Richards, 531 N.W.2d 70 (Wis. 1992), the Supreme Court of Wisconsin determined that a medical malpractice act that applies to actions “filed on or after June 14, 1986,” had retroactive application to cases that occurres before that date and was therefore unconstitutional. See alsoNeiman v. American Nat. Property and Cas.,
236 Wis. 2d 411, 613 N.W. 2d 160 (Wis. 2000). But seeCrowe v. Wigglesworth,623 F. Supp. 699 (1985), which applied Kansas law and determined that the collateral source rule is a procedural rule governing the admissibility of evidence and therefore can be applied retroactively.
20. See note 52.
21. For example, Louisiana’s caps on punitive damages apply to all actions filed after January 1, 1992 (La. Civ. Code, art. 3546). More often, however, legislators explicitly stipulate that a reform should be construed propectively. See, for example, a Maryland reform states, “[T]his Act shall be construed only prospectively and may not be applied or interpreted to have any effect on or application to any cause of action arising before the effective date of this Act” (Acts 1994, ch. 477, sec. 2). In most cases, however, the legislature is silent, in which case the general rule explained above applies.
T O R T R E F O R M S A N D S E T T L E M E N T P A Y M E N T S / S197
troduces the most problems for state-level analyses, as are many of the studies discussed above.22To see why, consider two cases that occurred after a tort reform was in effect. One of them was resolved while the reform was in effect, while the other was settled after the reform was reversed. A state-level analysis that lumps together all payments for cases accruing in a given year will use both cases to estimate the effect of tort reform on settlement payments. This is an artifact of aggregating up to construct the variables at the state-year level, as many time-series anal-yses do when they are looking for the effect of a state-level variable (reform in a state by year) on an aggregated state-level variable (the average settlement of all cases in that state-year). This of course would be an error because only one of them was subject to the tort reform regime. Since the constitutionality of many reforms is usually challenged within a few years of their enactment, many cases that accrue after a reform was enacted are resolved after the reform is struck down and thus are not subject to the reform regime.23
To illustrate this point, consider the following example. Illinois passed caps on noneconomic damages that applied to “causes of action accruing on or after” March 9, 1995 (735 Ill. Compiled Stat. Ann., art. 5, sec.
2-1115.1). The reform was struck down December 18, 1997 (Best v.
Taylor Machine Works, 179 Ill. 2d 367, 689 N.E.2d 1057 [1997]). If one counts the payments for injuries that occurred after the reform’s effective date but before it was reversed, the number is about 1,155. Yet if one counts the cases that were actually paid before the reversal date (and were therefore really subject to the reform), the number is only about 80, less then 7 percent of the cases. This becomes critical when using a difference-in-differences approach with state fixed effects because the estimation of the effect of tort reforms is performed only on the basis of changes in the reforms.
Accounting for reversal dates to properly link cases to applicable law is not exceedingly difficult when analyzing individual-level data; doing
22. Important studies that use state-level analysis without reporting any correction for reversal of reforms include Danzon (1984, 1986). Studies that report data corrected for reversal are Zuckerman, Bovbjerg, and Sloan (1990, p. 170) and Sloan, Mergenhagen, and Bovbjerg (1989, p. 670). Yet it is not clear whether they corrected the coding of the reforms at the individual level (accounting for the retroactive applicability of reversal) or at the state level. The former is correct way to do it; the latter is not.
23. The problem gets even worse if plaintiffs’ lawyers strategically wait until a reform is reversed to settle a case. One would also need to account for defense lawyers’ incentives in order to fully account for parties’ strategic behavior in the shadow of the forthcoming possibility of a reform’s reversal.
so with state-level data is less straightforward.24I suspect that previous research has not done it all.
3 . S TAT I S T I C A L M E T H O D O L O G Y
3.1. Variables
This study examines the effect of various medical malpractice reforms on two state-level and one case-level dependent variables.
Natural Log of Payment Amount. This variable measures the size of individual payments. Payment information was obtained from the NPDB (PAYMENT field). All payments were inflated to December 2005 dollars. This variable uses the payment as the unit of analysis, which results in more than 106,000 observations for regression.
Natural Log of Sum of Payment Amounts per Doctor. This is a state-level variable that measures the total malpractice payments for each state in a given year. The value was calculated by summing payments shown in the NPDB for each state in each year of study and dividing by the number of doctors practicing in the state that year. The goal of most, if not all, medical malpractice reform is to limit a state’s total annual damage and settlement payments. For medical malpractice in-surance companies (which collect premiums from doctors), the total annual damage payment per doctor is the variable of interest. All var-iables using state-years as the unit of analysis produce 400 observations from 50 states over 8 years.
Cases per 1,000 Doctors. This state-level variable measures the relative frequency of malpractice payments. Values for each state-year were calculated by counting the number of payments shown in the NPDB for each state in a given year and dividing by the number of doctors (in 1,000s) practicing in the state that year.
The independent variables used include the six tort reforms coded in the DSTLR. The analysis used a collapsed version of the database, the collapsed legal data set, which lumps together similar reforms. Virtually every reform has several types. In this study, the reforms were collapsed
24. In the interest of full disclosure, it should be mentioned that the NPDB does not allow for a perfect remedy to this problem. Because parties can report the case up to 30 days after the payment was executed, a payment made in December of a given year might be reported in January of the following year. As the public records provide the payment year only (and not the exact date), there could be some glitches in my coding for reforms that were struck down in December.
T O R T R E F O R M S A N D S E T T L E M E N T P A Y M E N T S / S199
as follows. First, all punitive damages caps were lumped together re-gardless of their magnitude. Second, all noneconomic damages caps were lumped together regardless of their magnitude. Third, there was no dis-tinction coded between mandatory or discretionary applications of the periodic-payment and collateral source rule reforms. Fourth, there was no distinction between the various types of restrictions on the joint and several liability rule or between the exact higher evidentiary requirements in the punitive evidence reform. Fifth, I did not distinguish between reforms made by the courts and those enacted by the legislature.
One disadvantage of collapsing the reforms is that I cannot distin-guish whether each variant of each reform has a distinct impact. In addition, collapsing multidimensional reforms into dummy variables in-troduces bias against finding any significant impact even where such an impact may exist because noneffective variants will water down the impact of the effective variants. In any case, there were not sufficient state-year observations to statistically measure the impact of each variant of each reform, and collapsing reforms makes results comparable to previous research that combined reforms along similar lines.25Thus, the coefficients of the tort reform variables should be interpreted as indi-cators of average effects.
In addition to the primary tort reform variables of interest, a number of control variables were included to refine the analysis. For the case-level regressions, case-case-level control variables (or individual-case-level control variables) were included. Otherwise, average state-level data were used (state-level control variables). Missing values for control variables were imputed using linear regression. Among the control variables, health
maintenance organization (HMO) penetration is of specific interest.26
25. Most, if not all, studies collapse the reforms in one way or another. For a summary of studies, see U.S. Congress (1993, p. 63). For problems caused because of such collapse, see Mello (2006).
26. Kessler and McClellan (1996) used data from all elderly Medicare beneficiaries treated for serious heart disease. The authors found that “direct” reforms reduce medical costs by 5–9 percent within 3–5 years of adoption without substantially affecting mortality or medical complications. In the category “direct” reforms, the authors include caps on pain and suffering damages, caps on punitive damages, abolition of the collateral source rule, and mandatory prejudgment interest. Conversely, the authors categorized “indirect” reforms as contingency fee reforms, periodic payments, joint and several liability, and patient compensation funds (see Kessler and McClellan 1996, pp. 371–72). Importantly, in Kessler and McClellan (2002), they controlled for health maintenance organization (HMO) penetration on the same population and found that direct tort reforms reduce medical costs by only about 4 percent. Thus, it is important to control for HMO penetration owing to HMOs’ role in providing incentives for optimal care.
Table 1 provides descriptive statistics for these variables, and each var-iable is discussed in detail in the Appendix.
3.2. Regression Model
Several variations on the following basic equations were estimated: LPstpb0Constant⫹b1Rst⫹b2Cst⫹b3MalYeart⫹b4States⫹ist, (1)
wheresindexes state andtindexes year. The dependent variable is the
log of the average payment in state sin yeart. The term Ris a vector of reforms,Cis a vector of state-level control variables, MalYear is the year of the injury, and State is the state of the physician.
LPistpb0Constant⫹b1Rst⫹b2Cst⫹b3MalYeart
⫹b State⫹b I ⫹ ,
(2) 4 s 5 ist ist
wherei indexes individual awards, sindexes state, andtindexes year.
The dependent variable is the log of individual settlementIin statesin yeart. The rest is the same except forI, which is a vector of individual payment characteristics. As the dependent variable of interest is case level, 85,997 individual-level observations were used.
LTPstpb0Constant⫹b1Rst⫹b2Cst⫹b3MalYeart
⫹b State ⫹ .
(3) 4 s ist
The dependent variable is the log of total annual payments per doctor per state.
NPstpb0Constant⫹b1Rst⫹b2Cst⫹b3MalYeart
⫹b State⫹ .
(4) 4 s ist
The dependent variable is the number of annual payments per 1,000 doctors per state.
Two specifications are reported in Tables 2–5. Model OLS1 controls only for state fixed effects, year effects, and reforms; model OLS2 adds the state-level (and, if relevant, individual-level) control variables, in-cluding HMO penetration. All models use clustering by state to account for nonindependence between case-level data within states. Bertrand,
T O R T R E F O R M S A N D S E T T L E M E N T P A Y M E N T S / S201
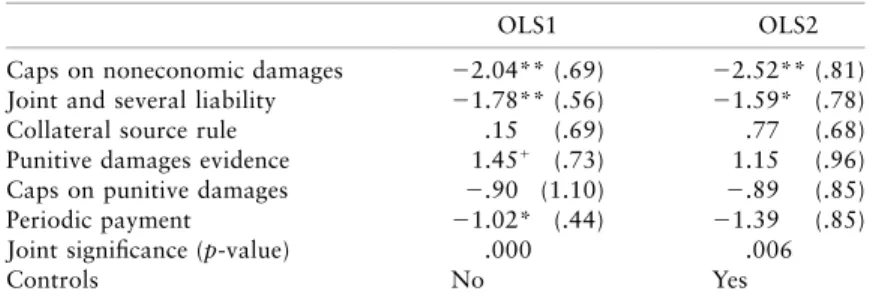
Table 2.State-Level Regressions: Dependent Variable Is Log of Average Award
OLS1 OLS2
Caps on noneconomic damages ⫺.07 (.09) ⫺.10 (.08) Joint and several liability ⫺.21 (.20) ⫺.22 (.20) Collateral source rule ⫺.03 (.12) ⫺.03 (.12) Punitive damages evidence ⫺.01 (.08) .03 (.08) Caps on punitive damages .10 (.06) .09 (.06) Periodic payment .03 (.08) .07 (.06) Joint significance (p-value) .70 .18
Controls No Yes
Note. Standard errors are clustered by state. Not reported are year dummies, state dummies, percentage of the population over age 65, percentage of the population with a bachelor’s degree, car fatalities per million people, per capita health care expenditures, income per capita, lawyers per capita, life expectancy for newborns, consumer price index for medical goods, percentage of the pop-ulation living in a metropolitan area, percentage of new residents, unemploy-ment rate, and health maintenance organization penetration. OLSpordinary
least squares.Np400.
Duflo, and Mullainathan (2004) suggest clustering as a way of dealing with the serial correlation that results from the “stickiness” of the law.27
4 . R E S U LT S
4.1. State-Level Analysis
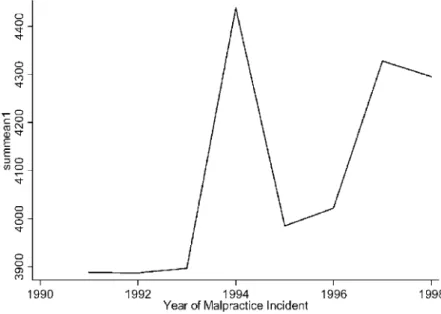
Figure 1 presents the state-level annual average payment. Between 1991 and 1998, the annual mean settlement payment increased steadily from about $185,000 to about $250,000. This 35 percent increase over the 7-year period reflects an average 4 percent annual increase, above and
beyond the annual consumer price index (CPI).28 Figure 2 shows that
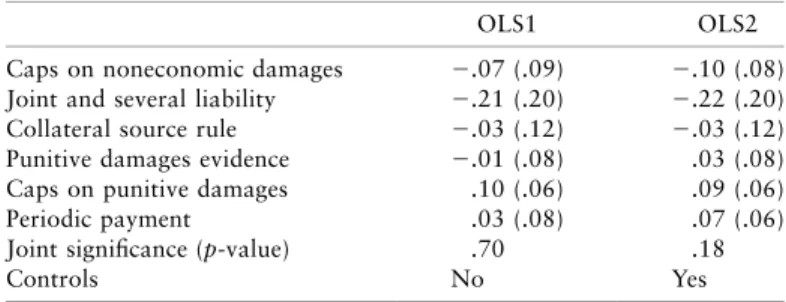
the annual mean number of cases per state increased from about 258 in 1991 to about 264 in 1998, an increase of 2.3 percent (less than .5 percent a year). Figure 3 shows that the annual mean total settlement payments per state increased from about $46 million in 1991 to $64 million in 1998, an increase of about 39 percent (about 5 percent a year). Together, Figures 1–3 show a worrisome picture of a steady
in-27. By the “stickiness” of the law, I refer to the fact that once a law is enacted it is likely to be in effect in the following years. This creates problems in estimating the impacts of tort reforms. See Kessler and McClellan (2002).
28. It may reflect the higher annual increase in the medical consumer price index, although it is not clear whether that increase does not reflect the higher annual awards.
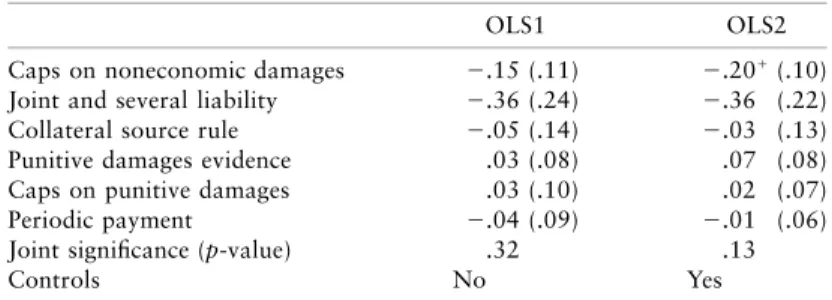
Table 3.State-Level Regressions: Dependent Variable Is Number of Cases per 1,000 Doctors
OLS1 OLS2
Caps on noneconomic damages ⫺2.04** (.69) ⫺2.52** (.81) Joint and several liability ⫺1.78** (.56) ⫺1.59* (.78) Collateral source rule .15 (.69) .77 (.68) Punitive damages evidence 1.45⫹ (.73) 1.15 (.96)
Caps on punitive damages ⫺.90 (1.10) ⫺.89 (.85) Periodic payment ⫺1.02* (.44) ⫺1.39 (.85) Joint significance (p-value) .000 .006
Controls No Yes
Note. Standard errors are clustered by state. Not reported are year dummies, state dummies, percentage of the population over age 65, percentage of the population with a bachelor’s degree, car fatalities per million people, per capita health care expenditures, income per capita, lawyers per capita, life expectancy for newborns, consumer price index for medical goods, percentage of the population living in a metropolitan area, percentage of new residents, unemployment rate, and health maintenance organization penetration. OLSpordinary least squares.Np400.
⫹Significant at the 10 percent or less level.
* Significant at the 5 percent or less level. ** Significant at the 1 percent or less level.
crease in annual medical malpractice settlement payments. However, these results are misleading because during those years there was an increase of almost 20 percent in the average number of doctors per state. Figure 4 accounts for this growth in the number of doctors per state. While Figure 2 shows a small increase in the average number of cases per state, there was in fact a decrease of more than 18 percent in the number of cases per 1,000 doctors. Similarly, while Figure 3 shows an increase of about 39 percent in mean total payments per state, Figure 5 shows that the mean total payments per doctor fluctuated during the entire period, eventually showing an increase of only about 10 percent. The decrease in the volume of cases per doctor is consistent with trends documented widely in the medical malpractice claims literature (Clermont and Eisenberg 2002). To the extent that the results presented in Figures 1–5 reflect the impact of tort reforms, they are consistent with the hypothesis that state reforms decrease the lower end of the distri-bution of awards without affecting total annual payouts because the number of cases decreased concurrent with an increase in the average award.
I now turn to explore the data more systematically. Table 2 reports two different panel ordinary least squares (OLS) regressions of equation
T O R T R E F O R M S A N D S E T T L E M E N T P A Y M E N T S / S203
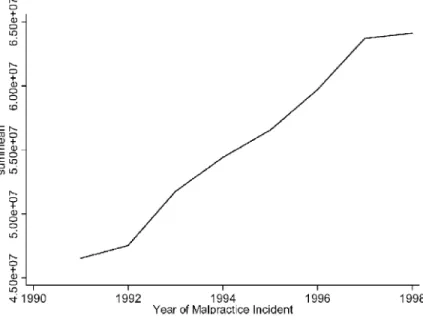
Table 4.State-Level Regressions: Dependent Variable Is Total Annual Payment per Doctor
OLS1 OLS2
Caps on noneconomic damages ⫺.15 (.11) ⫺.20⫹(.10)
Joint and several liability ⫺.36 (.24) ⫺.36 (.22) Collateral source rule ⫺.05 (.14) ⫺.03 (.13) Punitive damages evidence .03 (.08) .07 (.08) Caps on punitive damages .03 (.10) .02 (.07) Periodic payment ⫺.04 (.09) ⫺.01 (.06) Joint significance (p-value) .32 .13
Controls No Yes
Note. Standard errors are clustered by state. Not reported are year dummies, state dummies, percentage of the population over age 65, percentage of the population with a bachelor’s degree, car fatalities per million people, per capita health care expenditures, income per capita, lawyers per capita, life expectancy for newborns, consumer price index for medical goods, percentage of the population living in a metropolitan area, percentage of new residents, unemployment rate, and health maintenance organization penetration. OLSpordinary least squares.Np400.
⫹Significant at the 10 percent or less level.
(1). The dependent variable is the log of the (state-level) average settle-ment paysettle-ment. The linear regressions show mixed results. Some reforms increase average state settlement payments, and some reforms decrease them, yet none of the reforms were found to be significant. The joint effect of all six reforms was found to be insignificant. Table 3 is similar to Table 2, but the dependent variable is the number of cases per 1,000 doctors. Table 3 shows that the two reforms that reach statistical sig-nificance across both models are noneconomic damage caps and limi-tations on joint and several liability. Caps on noneconomic damages reduced the number of cases by 2.04 per 1,000 doctors to 2.52 per 1,000 doctors, which translates to a reduction of 10–13 percent, depending on the specification. These results are significant at the 1 percent level. Joint and several liability reform decreased the number of cases by 1.59–1.78 cases per 1,000 doctors, which translates into a reduction of 8–9 percent, depending on the specification. The results are significant at the 1 percent level for model 1 and at the 5 percent level for model 2. Periodic-payment reform decreased the number of cases by 1.02–1.39 cases per 1,000 doctors, which translates to a reduction of 5–7 percent, depending on the specification. Yet while the coefficient was significant at the 5 percent level for model 1, it was only weakly significant (p≈
) for model 2. The joint effect (which is associated with a decrease in .1
S204
S205
Figure 3. Average annual total payments per state
Figure 5. Total payments per doctor
). Table 4 estimates the effects of tort reforms on the total annual .01
settlement payout per doctor by state-year. Caps on pain and suffering damages reduce the total payments by 15–20 percent, depending on the specification. Yet the coefficient was found to be significant only in model 2 (pp.52). Reforming the joint and several liability rule was estimated to decrease total payments by 36 percent, yet the coefficient was not significant at the 10 percent level. All other reforms were identified as not having a significant effect on total annual settlement payouts. Re-forms were not found to be jointly significant, although in model 2 they were close to the 10 percent level.
In sum, state-level analysis shows that caps on pain and suffering damages reduce the number of cases by 10–13 percent and potentially reduce the total annual payment per doctor by 15–20 percent. Yet the statistical significance of these estimates is not strong for total annual payments. Reforming joint and several liability decreases the number of cases by 8–9 percent. Periodic-payment reform decreases the number of cases by 5–7 percent, yet this effect was weakly significant in model 2. All other reforms did not show an independent statistically significant effect on the dependant variables. Finally, the joint effect of enacting all
T O R T R E F O R M S A N D S E T T L E M E N T P A Y M E N T S / S207
Table 5.Individual-Level Regressions: Dependent Variable Is Log of Individual Payment
Without Correction With Correction
OLS1 OLS2 OLS1 OLS2
Caps on noneconomic
damages .01 (.05) ⫺.01 (.04) ⫺.74 ** (.24) ⫺.65** (.18) Joint and several liability ⫺.08 (.13) ⫺.10 (.11) .37⫹ (.19) .18 (.19)
Collateral source rule .02 (.06) .04 (.06) ⫺.32⫹ (.16) ⫺.17 (.11)
Punitive damages evidence .03 (.05) .06 (.05) ⫺.15⫹ (.08) ⫺.05 (.06)
Caps on punitive damages .10⫹(.06) .03 (.04) .21* (.08) .09⫹ (.05)
Periodic payment ⫺.07 (.10) ⫺.03 (.08) ⫺.54** (.19) ⫺.38** (.11) Joint significance (p-value) .37 .44 .000 .000
Controls No Yes No Yes
Note. Standard errors are clustered by state. Not reported are year dummies, state dum-mies, percentage of the population over age 65, percentage of the population with a bach-elor’s degree, car fatalities per million people, per capita health care expenditures, income per capita, lawyers per capita, life expectancy for newborns, consumer price index for medical goods, percentage of the population living in a metropolitan area, percentage of new residents, unemployment rate, health maintenance organization penetration, age of physician at event, year of graduation, state fund paid, and physician’s field. OLSp
ordinary least squares.Np105,944.
⫹Significant at the 10 percent or less level.
* Significant at the 5 percent or less level. ** Significant at the 1 percent or less level.
six reforms was found to be significant for decreasing the number of cases but not significant for decreasing the average payment or the total annual payments per doctor. These results are consistent with the lit-erature that identifies an effect mainly for caps on noneconomic dam-ages.
However, as is shown in the next section, by exploiting the fact that this data set allows me to analyze the effect of medical malpractice reforms not only at the state level but also at the level of the individual case, I reach much more nuanced conclusions about the real impact of medical malpractice reform.
4.2. Individual-Level Analysis
The regressions presented in Table 5 estimate the effects of tort reforms on expected settlement payouts (equation [2]) using more than 100,000 observations of case outcomes from 50 states over 8 years. Estimating the effect of state-level reforms on case-level outcomes provides two advantages. First, case-specific characteristics, such as physician spe-cialty, physician age, and so on, can be controlled for, thereby eliminating
any potential bias in the estimation of the reform’s effect arising from correlation of these variables with both case outcome and reform. Sec-ond, and more important, precise matching of individual cases to ap-plicable law is more accurately accomplished using individual-level data for those cases that were resolved after a reform was struck down. Therefore, the effect of a reform on case outcomes can be accurately estimated. This correction is crucial in difference-in-differences models for accurately identifying the impact of a tort reform.
Table 5 presents individual-level results for the case-level dependent variable of logged case settlement amounts. The first two columns show the results without correction for the retroactive applicability to striking down reforms. The results in model 1, which have no controls, should be comparable to those in model 1 in Table 2. The last two columns present the results after correction for the retroactive applicability of striking down reforms. Several reforms have economically and statisti-cally significant effects on average settlement amounts. Caps on non-economic damages reduce average awards by 65– percent to 74 percent, depending on the specification (p!.01for both specifications). Joint and several liability and caps on punitive damages increase the average award, yet these effects were not strongly significant in model 1 and not significant at all in model 2. The collateral source reform decreases av-erage awards by 17–32 percent, depending on the specification. Yet this effect was not strongly significant in model 1 and not significant at all in model 2. Finally, periodic-payment reform decreases average awards by 38–54 percent, depending on the specifications (p!.01for both spec-ifications).
However, there is a reason to be suspicious of this result because there are only two variations in periodic-payment reform in the relevant years; two states enacted the reform in the relevant years.29Identifying the effect of reform from only a few states is generally suspect. All other reforms were not identified as having economically or statistically sig-nificant effects. Finally, while the test for joint significance of the state-level regressions was not significant, the test for the individual-state-level re-gressions suggests that the joint effect is negative and economically and statistically significant (p!.01).
29. Alabama struck down the reform in 2005, but the impact on my study is null. See Table 6.
T O R T R E F O R M S A N D S E T T L E M E N T P A Y M E N T S / S209
5 . D I S C U S S I O N
This study evaluates the effectiveness of tort reforms in accomplishing the purported goals of their proponents and not whether the reforms are efficient.30
Effective reforms may not necessarily reduce average payout. Tort reforms can cut off the lower or the upper tail of the distributions of awards. For example, caps on damages may cut off the upper tail of the distributions. Limitations of contingency fees, in contrast, may cut off the lower distributions. While both reforms are expected to decrease number of cases as well as total annual payments, they differ with respect to their influence on average awards. Whereas reforms that cut off the upper tail are expected to decrease average awards, those that cut off the lower tail are expected to increase average awards.31
Similarly, tort reforms may increase or decrease the number of law-suits, first, because of their ambiguous impact on the incentives to settle once an injury occurs and/or, second, because of their ambiguous impact on health care providers’ original behavior. With respect to the first reason, if damages become more certain under various tort reforms and the bargaining range narrows, we would expect the number of settle-ments to increase. On the other hand, if tort reforms bring defendant stakes more in line with plaintiff stakes, then we may see more trials and fewer settlements (Priest and Klein 1984). With respect to the second reason, tort reform may increase the number of settlements because doctors may (rationally) exercise a lower level of care when they know that they are partially insulated from liability (for example, because of caps on damages; Bovbjerg et al. 1996). Similarly, a medical center may (rationally) post fewer warning labels or less frequently train its staff when restrictions on joint and several liability apply, knowing that, for example, in the event of misuse of a medical device, the doctor or nurse will be held primarily liable and the medical center may no longer be responsible for the doctor or nurse’s liability.
Since even an effective reform can have an ambiguous effect on the
30. Probably every academic study that explores the impact of tort reforms makes this caveat. See, for example, Danzon (1986, p. 79), Viscusi et al. (1993, p. 175), and Viscusi and Born (2005, p. 41).
31. A second possible reason why effective reforms do not necessarily reduce average payout is that cognitive biases lead jurors toward the maximum possible payout (designated by the cap) simply because this amount is a prominent anchor in their minds. Prior lab-oratory research predicts just such an effect. Yet in many states the jury does not know about these caps, which may undermine this logic.
annual number of cases and average awards, a relevant question that requires our attention is whether the total annual payout increases or decreases.
The regression results of this study estimate a decrease in average settlement of between 65 and 72 percent with the enactment of caps on noneconomic damages and between 38 and 54 percent with periodic-payment reforms, depending on the specification. (However, the impact of periodic-payment reform might be attributed to the fact that there are only two variations of the reform in the relevant years and to its high correlation with the other two reforms.) In comparison, Danzon (1986) found that noneconomic damage caps reduced average awards by 19 percent in one study and by 16–26 percent in another.
Indeed, it is not surprising that caps on noneconomic damages have a large effect. Various scholars have estimated that pain and suffering awards make up approximately 50 percent of total awards, at least in some types of personal injury cases (Danzon 1984, 1986; Vidmar et al. 1998; Viscusi 1988). Many caps are set by legislatures at $250,000, while more than 30 percent of the cases in the data set include awards larger than that. Indeed, the mean (median) award of cases not subject to caps is $262,000 ($132,000), whereas the mean (median) award of cases subject to caps is only $199,000 ($84,000).
What is perhaps surprising, however, is that periodic-payment reform decreases average settlement payments by more than 40 percent. There are only two variations of the reform in the relevant years, which suggests that the estimation is significantly biased.32
5.1. Concerns about Effective Reforms
The analysis shows the importance of employing individual-level data and correcting for the retroactive applicability of tort reform. While analysis at the state level suggests that none of the reforms have an effect on the average award, analysis at the individual level suggests that caps on noneconomic damages have a significant impact. At the state level it is hard—if not impossible—to correct for the retroactive applicability
of striking down a reform.33 Thus, previous literature underestimated
32. However, it is still worth thinking about the mechanism by which periodic-payment reform might have an impact. See Avraham (2006a).
33. There are several reasons for this. First, assuming that the data are tabulated by the injury date (which is, as a default, the more reasonable date to use), then for any number of cases that appear in any given reform year, some cases will be settled before the reform is struck down and some cases will be settled after. But in state-level analysis
T O R T R E F O R M S A N D S E T T L E M E N T P A Y M E N T S / S211
the effect of tort reforms because it analyzed the data at the state level and did not correct for such retroactive applicability. As Table 5 shows, the large impact of tort reform does not stem from simply employing individual-level analysis but rather from correcting for judicial reversal by matching cases to the applicable law.
It is not surprising that recoding the payments made after a reform was struck down as not subject to the tort reform so drastically changed the estimated effect of the reform. Recall that in the difference-in-differences approach the coefficients are identified from changes in the reform variables. It is therefore important to include a change in tort law when a law is struck down. Indeed, as Table 6 shows, five out of
the 10 variations for noneconomic damages are due to reversals.34
This might explain why other reforms were found to have no effect. As was shown above, to be able to identify the effect there must be a sufficient number of reforms struck down in the relevant years. For the other reforms in the years in this study, there might be enough reforms struck down to bias the coefficients if the data set is not corrected for reversals yet not enough reforms struck down to adequately identify an effect.35
The only other study that seems to conduct an individual-level anal-ysis is Sloan, Mergenhagen, and Bovbjerg (1989). The authors found that caps on noneconomic damages reduced payments by 37 percent and that limitations on the collateral source rule reduced payments by 21 percent, yet the latter was not found to be statistically significant. While it is not clear whether the authors accounted for the retroactive applicability of striking down a reform in their analysis, it seems they did not.
However, despite the similarity of the individual-level results with previous research, I believe that the coefficients identified here are most
they are indistinguishable. Second, selection problems result if cases that were settled after the reform was struck down are dropped from the data. Third, if the data are tabulated by payment year, then for any number of cases that appear in any given reform year, some cases will be from injuries that occurred before the reform was enacted and other cases from injuries occurring after enactment. But in state-level analysis they are indistinguish-able, and dropping any one type of case causes selection problems.
34. See Table 6, note a, for the states that reversed caps on noneconomic damages. 35. Specifically, as Table 6 shows, for joint and several liability there was only a single reversal out of the five variations. For caps on punitive damages, there were only three reversals out of the 12 variations. For higher evidentiary requirements for punitive evidence, there were only two reversals out of the nine variations. For periodic payments, there were three reversals out of only three variations. For collateral source rules, there were six reversals out of the eight variations.
Table 6 . Enactments and Judicial Reversals in States with Reforms 1991 1992 1993 1994 1995 1996 1997 1998 Relevant V ariations State-Level Analysis Case-Level Analysis Caps on noneconomic damages a 16 14 14 14 15 18 19 17 9 1 0 Joint and several liability b 33 35 35 35 36 36 37 36 5 5 Collateral source rule c 32 32 31 31 31 31 30 29 5 7 Caps on punitive damages d 18 17 18 18 19 22 24 24 11 12 Punitive damages evidence e 27 29 29 30 32 34 34 32 9 9 Periodic payment f 31 31 31 31 29 29 29 29 2 3 Split recovery g 56654555 5 5 Caps on total damages h 77777666 1 1 Patient compensation fund 10 10 10 10 10 10 10 10 0 0 Contingency fees fund 15 15 15 15 15 15 15 15 0 0 Note. If a reform was enacted or reversed on or after July 1, it was coded as enacted or reversed in the following year . The values for state-level analysis include changes not directly reflected in the year columns. For example, in 1995, Kentucky struck down collateral source rule reform and W isconsin enacted it. While the year columns show no change in the number of states with collateral source rule reform between 1994 and 1995, this is counted as two variations. The values for case-level analysis include reversals that occurred after 1998 and would apply to pending cases. For example, Ohio rev ersed collateral source rule reform in 2000 and Kentucky in 2002. Therefore, the case-level column has two more variations than the state-level column. aAlabama and Ohio struck down the reform in 1992, Illinois and Ohio in 1998, and Oregon in 2000. bOhio struck down the reform in 1998. cKansas struck down the reform in 1993, Ohio in 1998, Kentucky in 1995, Alabama in 1997, Rhode Island in 2002, and Missouri in 2005. dAlabama struck down the reform in 1992, Ohio in 1998, and Idaho in 2003. eIllinois and Kentucky struck down the reform in 1998. fOhio and Arizona struck down the reform in 1995, and Alabama in 2005. gNew Y ork struck down the reform in 1994, Colorado in 1995, and Florida in 1998. hSouth Dakota struck down the reform in 1996.