NBER WORKING PAPER SERIES
MECHANISMS AND IMPACTS OF GENDER PEER EFFECTS AT SCHOOL
Victor Lavy
Analía Schlosser
Working Paper 13292
http://www.nber.org/papers/w13292
NATIONAL BUREAU OF ECONOMIC RESEARCH
1050 Massachusetts Avenue
Cambridge, MA 02138
August 2007
We thank the Ministry of Education for assisting with the data, Rachel Berner, Issi Romem and Yannay
Spitzer for outstanding research assistance, and comments from Kirk Doran, Alfronso Flores-Lagunes,
Alan Krueger, Cecilia Rouse, and seminar participants at LSE, the Institute of Education at the University
of London, Tel Aviv University, the Hebrew University, Princeton University, the 2007 SOLE meetings,
the Bergen-CEPR 2007 conference, the LEaF conference, and the IZA/SOLE transatlantic meeting.
Schlosser thanks the Industrial Relations Section and the Pinhas Sapir Center for research support.
The views expressed herein are those of the author(s) and do not necessarily reflect the views of the
National Bureau of Economic Research.
© 2007 by Victor Lavy and Analía Schlosser. All rights reserved. Short sections of text, not to exceed
two paragraphs, may be quoted without explicit permission provided that full credit, including © notice,
is given to the source.
Mechanisms and Impacts of Gender Peer Effects at School
Victor Lavy and Analía Schlosser
NBER Working Paper No. 13292
August 2007
JEL No. I2,I21,J16
ABSTRACT
The consequences of gender social and learning interactions in the classroom are of interest to parents,
policy makers, and researchers. However, little is known about gender peer effects in schools and
their operational channels. In this paper, we estimate the effects of classroom gender composition
on scholastic achievements of boys and girls in Israeli primary, middle, and high schools and identify
the mechanisms through which these peer effects are enacted. In particular, we examine whether gender
peer effects work through changes in classroom learning and social environment, teaching methods
and pedagogy, and teacher burnout and work satisfaction. In assessing these mechanisms, we distinguish
between the effects generated by changes in the classroom gender composition and those generated
by changes in the behavior of students. To control for potentially confounding unobserved characteristics
of schools and students that might be correlated with peer gender composition, we rely on idiosyncratic
variations in gender composition across adjacent cohorts within the same schools. Our results suggest
that an increase in the proportion of girls leads to a significant improvement in students' cognitive
outcomes. The estimated effects are of similar magnitude for boys and girls. As important mechanisms,
we find that a higher proportion of female peers lowers the level of classroom disruption and violence,
improves inter-student and student-teacher relationships as well as students' overall satisfaction in
school, and lessens teachers' fatigue. We find, however, no effect on individual behavior of boys or
girls, which suggests that the positive peer effects of girls on classroom environment are due mostly
to compositional change, namely due to having more girls in the classroom and not due to improved
behavior of peers.
Victor Lavy
Department of Economics
Hebrew University
Mount Scopus
91905 Israel
and NBER
Analía Schlosser
Department of Economics
Princeton University
Industrial Relations Section
Firestone Library
Princeton, New Jersey 08544
I. Introduction
The question of whether classroom gender-composition matters for student learning has long been of concern to social scientists, educators, and policymakers. The general view is that social interactions between genders at school often play an important role in academic achievement and career choices. However, little scientific evidence supports these beliefs and not much is known about the mechanisms of these peer effects. Such evidence is even more relevant now given the revival of the debate about the benefits of single-sex versus coeducational schooling and the concern about the potential effects of single-sex schools on gender imbalances in coeducational public schools.1 This
debate received an impetus in October 2006 with the release of final Title IX single-sex regulations that give communities more flexibility in offering single-sex classes and permit school districts to provide single-sex schools.2
While much attention has been given to the comparison of students outcomes in single sex and coeducational classes, a recent report of the American Association of University Women points that an overlooked consequence in the creation of single-sex classes is the disruption of the sex ratio in coeducational classes from which single-sex classes are drawn (Morse, 1998). In the United Kingdom, for example, a higher demand for single sex-schools for girls relative to boys has resulted in highly imbalanced sex ratios in some coeducational public schools.3 In Inner London, for example, a higher
ratio of girls in single-sex schools is reflected in coeducational schools, where 59 percent of the students are boys.4 Understanding the effects of classroom gender composition is therefore important for
assessing the consequences of imbalanced sex ratios in coeducational public schools and for determining an optimal grouping of students into classrooms and an efficient allocation of resources within and across schools.
This paper examines the extent of gender peer effects in the educational production function. The first part of the paper explores how classroom gender composition affects scholastic achievements of
1 See the National Association for Single Sex Public Education website: http://www.singlesexschools.org and
Campbell and Sanders (2002) for a discussion of the pros and cons of single-sex schooling.
2 The final regulations took effect on November 24th, 2006 and amend existing regulations that implement Title IX
of the Education Amendments of 1972, which prohibit sex discrimination in education programs or activities that receive federal funds. While the previous regulations permitted school districts to provide single-sex public schools to students of one sex if they provided comparable single-sex public schools to students of the other sex, the new regulations only require providing equal coeducational schooling to students of the other sex. For more details, see http://www.ed.gov/news/pressreleases/2006/10/10242006.html.
3 The Guardian, in a recent article (April 10, 2007), discusses the effect of single-sex schools on the gender
imbalance in public schools in the UK and explains that the higher proportion of girls in single-sex schools relative to boys reflects the desire of parents to send their daughters to single-sex schools, but not their sons.
See: http://education.guardian.co.uk/egweekly/story/0,,2053138,00.html.
4 The gender gap in enrollment in single-sex classes is even more pronounced in certain boroughs in London. One
of the extreme cases of sex imbalance in the coeducational sector occurs in Islington, where boys make up 71 percent of the coed secondary school population (Whatford, 2005).
boys and girls in different stages of the schooling cycle. As outcomes in primary school and in middle school, we use test scores in English, Hebrew, math, and science for 5th and 8th grades. For high school,
we use several measures of students’ performance in the matriculation exams. We also examine the gender peer effects on students’ enrollment in advanced courses in math, computer science, and science to assess the widely claimed statement that human capital investment of girls in math and science is enhanced in an environment with more girls.
The second part of the paper identifies mechanisms by which the gender peer composition affects academic outcomes. Our study appears to be the first to uncover the “black box” of peer effects, particularly that deriving from classroom gender composition. We focus on the following mechanisms: classroom disruption and violence, inter-student interactions, student-teacher relationships, school discipline, students’ satisfaction with school, teaching methods, and teachers’ sense of “fatigue” or “burnout” with their job. This form of externalities of girls in the classroom is a reflection of the
congestion effect in the education production model proposed by Lazear (2001). However, the peer effects of girls can also be enacted by changing the probability that a student misbehaves, which in Lazear’s model is assumed to be fixed. We are able to disentangle these two channels of the peer effect by distinguishing between the effects generated by changes in classroom gender composition and those caused by changes in the behavior of students. This analysis is based on contrasting students’ views about their classroom environment with students’ self-reports on their own behavior.
To control for unobserved characteristics of schools and students that might be correlated with peer gender composition and that can also affect students’ outcomes, we rely on idiosyncratic variations in the proportion of female students across adjacent cohorts within the same school. By using multiple cohorts and conditioning on school fixed effects and school-specific time trends, we are able to control for unobserved factors that might confound the gender peer effect in schools. We show that within schools, there is considerable cohort-to-cohort variation in gender composition that is unlikely to be predicted by parents or manipulated by school authorities. We also demonstrate that this within-school variation in the proportion of female students is not related to within-school variations in student background characteristics and is sufficiently large to allow estimating the gender peer effects precisely.
The empirical evidence on gender peer effects in schools is based primarily on studies that contrast outcomes for students, usually for girls, in single-sex and coeducational classes. The United States Department of Education (2005) and Morse (1998) review such studies in elementary and high schools, and Harwarth et al. (1997) includes a review of studies in colleges. The evidence is mixed; some studies suggest no differences between single-sex and coeducational schooling while others find that single-sex schooling may be beneficial. Evidence favoring coeducational schooling is much more limited. Nevertheless, it is difficult to interpret the results since most of these studies do not account for
the non-random selection of students into single-sex and coeducational schools and the unobserved potentially confounding differences between these two types of institutions.
Evidence on the effects of gender composition within a mixed-gender environment is very limited. Ulku-Steiner et al. (2000) look at doctoral students’ experiences in gender-balanced and male-dominated graduate programs and find lower academic self-concept and lower career commitment among women involved in male-dominated programs. However, this study accounted neither for the non-random sorting of students across graduate programs nor for unobserved aspects of these programs that may generate correlated effects (Manski, 1993) and be confounded with peer effects. Some recent studies resort to experimental or quasi-experimental research designs to separate the social effects in the classroom from the correlated effects (see, e.g., Sacerdote, 2001; Zimmerman, 2003; Angrist and Lang, 2004; Arcidiacono and Nicholson, 2005; Hanushek et al., 2003; Gould, Lavy, and Paserman, 2005; Hoxby and Weingarth, 2005; Ammermueller and Pischke, 2006; and Gibbons and Telhaj, 2006). However, only a few studies focused on gender peer effects.
A notable exception is Hoxby (2000), who estimates gender and race peer effects in Texas elementary schools and finds that boys and girls have higher test scores when classrooms have more female students. Whitmore (2005), on the other hand, finds mixed results for the effects of the proportion of female students (positive in Kindergarten and second grade, zero at first grade and negative at third grade), using gender variation generated by the random assignment of students into classrooms in the Tennessee’s Project STAR. A third study is Hansen et al. (2006), who use data from an introductory undergraduate management course and find that male-dominated groups achieved lower scores, both in group work and in individually taken exams, than female-dominated and equally mixed gender groups. None of the referenced or other studies on peer effects, including those that focused on gender peer effects, examined the mechanisms through which peers affect students’ scholastic achievement.5
The results we present in the paper show that the proportion of girls in a class has a positive and significant effect on academic achievements of girls and of boys in high school. The effect is non-linear and it is mainly evident when the proportion of girls in a class is over 55 to 60 percent. The sizes of the estimated effects are similar for both genders. We also find that boys who have a higher proportion of female peers have higher enrollment rates in advanced math and science classes during high school. Surprisingly, we find a smaller and less significant effect for girls, though relative to the respective means, the size effects are similar to those found for boys.
Both sets of results, the estimates on matriculation outcomes and those on enrollment in various subjects, are significantly different from the results of falsification tests that use placebo treatments,
which show no effect at all. These falsification tests are based on replacing the treatment variable with the proportion of females in the previous or the subsequent cohort in the same school. The lack of any discernable effects when the placebo treatments are used suggests that the estimated effects of the correct measure of treatment are not biased due to omitted unobservable confounders of the effect of interest.
The evidence for primary school students’ achievement suggests that the proportion of girls positively affects math, science, and technology test scores of boys and girls but not language test scores. In middle school, the effects are mainly evident for girls in math, Hebrew, and English test scores; for boys, the effects are positive but less precise. This is probably due to the lower precision in the estimation as it is based on only two years of data and on fewer schools.
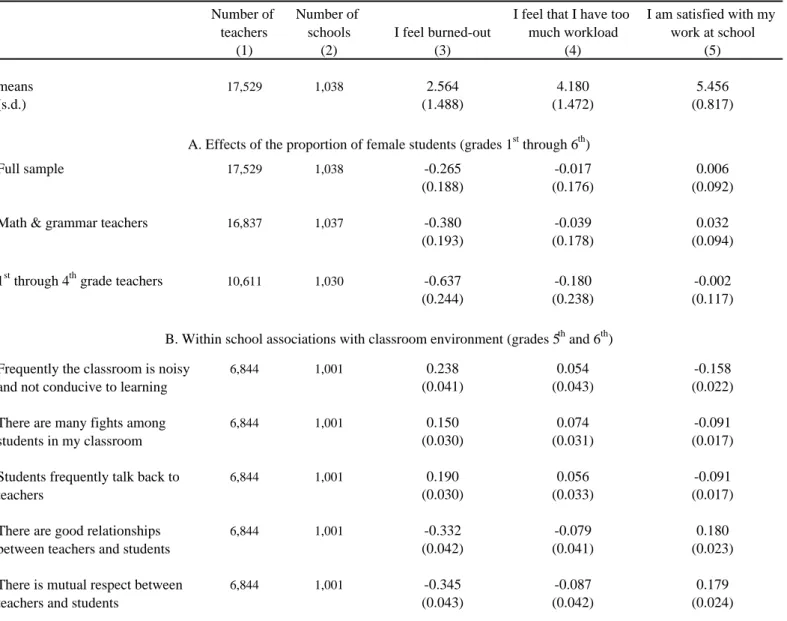
An examination of the underlying mechanisms of the gender peer effects shows that a higher proportion of girls in the classroom lowers the level of classroom disruption and violence, and improves inter-student and teacher-student relationships as well as students’ satisfaction with school. It also significantly alters teaching methods and lessens teachers’ fatigue and feelings of burnout, although it does not affect their overall work satisfaction. On the other hand, we find no evidence that having more girls in a class leads to clearer and more enforceable disciplinary rules at school.
The estimates of the effect of the proportion of girls on student’s (self-reported) violent behavior, disciplinary problems, and study effort show no systematic or significant relationship, suggesting that much of the improvement in the classroom environment associated with a higher proportion of girls is due to a change in classroom gender composition and not to changes in individual student behavior.
The rest of the paper is organized as follows: Section II describes the identification strategy. Section III discusses the data and the construction of the analysis samples, while section IV presents the main OLS and school fixed effects estimates of gender peer effects on primary, middle, and high school students’ achievement. Section V presents evidence on the possible mechanisms driving the positive female peer effects on students’ achievement, and section VI shows results suggesting that a change in classroom gender composition and not behavioral changes among students is the driving force behind the estimated gender peer effects on classroom environment. Section VII concludes.
II. Empirical Strategy
Identification of Gender Peer Effects
The effect of classroom gender composition on students’ outcomes is usually confounded by the effects of unobserved correlated factors. Such correlations could result if self-selection and sorting of students across schools are affected by school gender composition or if there is a correlation between school gender composition and other characteristics of the school that can affect students’ outcomes. One possible way to account for both sources of confounding factors in the estimation of peer effects is by
relying on within school variations in the proportion of female students across adjacent cohorts.6 Based on this approach, we examine whether cohort-to-cohort changes in male and female outcomes within the same grade and school are systematically associated with cohort-to-cohort changes in the proportion of female students. The basic idea is to compare the outcomes of students from adjacent cohorts who have similar characteristics and face the same school environment, except for the fact that one cohort has more female students than the other due to purely random factors.
While implementing this methodology, we use the proportion of female students measured at the grade and not at the classroom level, because the latter might be endogenous as parents and school authorities may have some discretion in placing students in different classes within a grade. This is not a very restrictive compromise because within a given school the proportion of female students in a grade is highly correlated with the proportion of female students in a class.7
Using repeated cross-sectional data, we estimate the following reduced-form equation separately
for boys and girls:
' '
1 2
igst g s t igst gst gst igst
y =
α β γ
+ + +xλ
+Sλ π
+ P +ε
(1)where i denotes individuals, g denotes grades, s denotes schools, and t denotes time. yigst is an achievement measure for a male/female student i in grade g, school s, and year t;
α
g is a grade effect,s
β
is a school effect,γ
t is a time effect,xigst is a vector of student’s covariates that includes mother’s and father’s years of schooling, number of siblings, immigration status, and ethnic origin, and indicators for missing values in these covariates, Sgst is a vector of characteristics of a grade g in school s and timet and includes a quadratic function of enrollment and a set of variables for the average characteristics of the students in the grade;
P
gst is the proportion of female students in grade g, school s, and year t, andigst
ε
is the error term, which is composed of a school-specific random element that allows for any type of correlation within observations of the same school across time and an individual random element.8 The6A similar identification strategy was recently applied by Hoxby (2000) to estimate gender and race peer effects in
elementary schools in Texas. Other studies that rely on within school variation in peer composition are Angrist and Lang (2004); Gould, Lavy, and Paserman (2005); and Ammermuller and Pischke (2006).
7The correlation between the proportion of female students in the grade and the proportion of female students in the
class is 0.67 for elementary schools. The correlation for middle schools and high schools is 0.56 and 0.55 respectively. Nevertheless, we think that at higher levels of education, the proportion of female students in the grade (and not in the class) is a more relevant measure of treatment since students spend a lower proportion of the school day in their homeroom class.
8 While the fixed effect coefficient in equation (1) captures much of the unobserved correlation within observations
coefficient of interest is π, which captures the effects of having more female peers on student achievement.
We estimate equation (1) separately for samples of primary, middle, and high school students in order to explore how gender peer effects evolve through the different schooling stages. To address the concern that there could be school trends in unobserved factors correlated with the proportion of female students, we add to equation (1) school-specific linear time trends (
δ
s), resulting in the following estimating equation:9' '
1 2
igst g s s st t igst gst gst igst
y =
α β δ
+ + year + +γ
xλ
+Sλ
+π
P +ε
(2)Identification of Mechanisms
The parameter π in equations (1) and (2) measures gender peer effects that could be enacted through various channels. This could include effects through changes in the classroom climate, in the quality of interactions among students and between students and teachers, in the level of motivation and self-confidence of students; through modifications in students’ effort and study habits; and also through responses of teachers in terms of their effort, attitudes towards the class, and teaching methods. To assess the importance of each of these mechanisms, we estimate models identical to model (1) where the dependent variables are constructed from students’ responses to a school questionnaire about classroom environment, teaching methods, study efforts, and their own behavior, as well as from teachers’ reports about their sense of fatigue and work satisfaction. The student and teacher questionnaires are described in more detail in the data section.
It is important to note that the mechanisms through which gender peer effects may operate can simply reflect a change in classroom gender composition but can also reflect changes in the individual behavior of students. For example, a higher proportion of girls in the classroom can improve the classroom climate by lowering the incidence of disruptions just because there are fewer boys, who tend to be more disruptive than girls. In addition, having more girls in a class may affect students’ individual behavior. A violent boy may be more tranquil and less disruptive due to a more relaxed atmosphere that girls may create or because teachers may be more patient with more girls in the class. These behavioral changes impact the average environment in school in addition to the compositional effect described above.
corr(εigst,εigst-k)=ρ + (1- ρ)Фk the school fixed effect coefficient will absorb ρ while (1- ρ)Фk will be left in the error
term (see e.g., Petersen, 2006). Therefore, standard errors of fixed effects regressions that do not account for this type of correlation will be misleading.
9Equation (2) is estimated for high school outcomes because we have a longer panel and also because secular trends
in school gender composition are more likely to exist in high schools since there is school choice at this level of education.
We propose to disentangle these two alternative explanations by using two different types of questions in the student questionnaire. In one set of questions, students are asked about their views regarding general aspects of their classroom (for example, the level of violence). The effect of the gender mix on these measures captures the overall gender peer effect (due to compositional changes and changes in students’ behavior). In another set of questions, students are asked about their own behavior (for example, if they were involved in a violent interaction during the current year). We interpret the effect of classroom gender composition on measures of students’ own, self-reported behavior as indications of changes in individual behavior. More details about these questions are provided in the next section.
The structure of the panel data that we use and the nature of our treatment variable present us with an unusual opportunity to test for the internal validity of the results obtained from the identification strategy described above. We can replace the measure of treatment with the proportion of girls in an older or younger cohort at the same school to check for possible biases originating from any short-term changes at the school level correlated with the proportion of female students that are not captured by the school-specific linear time trend. We will present estimates of the effect of the placebo treatments alongside the estimates based on the true treatment measure.
III. Data
The empirical analysis is based on three samples that include elementary, middle, and high school students, respectively. All three samples include only schools that have mixed-gender classes because the identification strategy is based on within school variation in the proportion of female students. This condition is met in all Jewish secular elementary, middle, and high public schools and in about 50 percent of the Jewish religious elementary public schools. A small number of religious schools have mixed-sex classes at the middle and high school level but since this sample is very selective, we prefer not to include them in the analysis. Below we describe the three samples.
The High School Data
We use administrative records collected by the Israel Ministry of Education for eight consecutive cohorts (from 1993 to 2000) of 10th grade students. The data are based on annual reports submitted by
school authorities to the Ministry of Education at the beginning of the school year. Each record contains an individual identifier, a school and class identifier, and detailed demographic information on the student: gender, parental education, number of siblings, year of immigration (where relevant), and ethnicity. We use 10th grade to define the base population because it is the first year of high school and
the last year of compulsory schooling. The measure of treatment in high school in terms of the proportion of female peers is also based on 10th-grade enrollment because any later change in this rate is
endogenous. The sample is restricted to students in non-special education classes in secular schools that have a matriculation track.10 As a further restriction, we drop all schools that experienced a change in
enrollment of 80 percent or more between 2 consecutive years of the analyzed period to avoid changes in school gender composition that might have originated from structural changes in the school. In addition, we drop schools that have an annual enrollment lower than 10 students.
Israeli high school students are enrolled either in an academic track leading to a matriculation certificate (Bagrut in Hebrew) or in an alternative track leading only to a high school diploma.11 The Bagrut is completed by passing a series of national exams in core and elective subjects taken by the students between 10th and 12th grade. Students choose to be tested at various levels of proficiency, with
each test awarding from one to five credit units per subject, depending on difficulty. Some subjects are mandatory, and for many the most basic level is three credit units. Advanced level subjects are those subjects taken at four or five credit units. A minimum of 20 credit units is required to qualify for a matriculation certificate. We link the students’ datasets with administrative records that include the results (test scores) of these matriculation exams.
We focus on the following matriculation outcomes that are available for all the years: the average score in the matriculation exams, matriculation status (=1 if awarded with the matriculation diploma and 0 otherwise), number of credit units, number of advanced level subjects in science, and matriculation status that meets university entrance requirements (at least 4 credits in English and another subject at a level of 4 or 5 credits).12 We also constructed indicator variables for student enrollment in
advanced courses in math, physics, computer science, biology, and chemistry.
The Middle and Elementary School Data
Data for elementary and middle schools are based on the GEMS (Growth and Effectiveness Measures for Schools - Meizav in Hebrew) datasets for the years 2002-2005. The GEMS includes a series of tests and questionnaires administered by the Division of Evaluation and Measurement of the
10This step leads to only small reduction in the sample since there are few special education high schools.
11 The matriculation certificate is a prerequisite for university admission and receiving it is one of the most
economically important educational milestones. Similar high school matriculation exams are found in many countries and in some states in the United States. Examples include the French Baccalaureate, the German Certificate of Maturity (Reifezeugnis), the Italian Diploma di Maturità, the New York State Regents examinations, and the South African Matriculation Certificate.
12 Roughly, 10 percent of the students in the sample did not take any of the matriculation exams. These students get
zero values in the average score.None of the other four matriculation outcomes that we use require such imputation since the zero values that these students get for these outcomes, for example, number of credit units, is a real and not an imputed measure of their achievements.
Ministry of Education.13 The GEMS is administered at the midterm of each school year to a representative 1-in-2 sample of all elementary and middle schools in Israel, so that each school participates in GEMS once every two years.
The GEMS student data include test scores of 5th and 8th graders in math, science, Hebrew, and
English, as well as the responses of 5th through 9th grade students to questionnaires. In principle, all
students except those in special education classes are tested and required to complete the questionnaire. The proportion of students who are tested is above 90 percent, and the rate of questionnaire completion is roughly 91 percent. The raw test scores used a 1-to-100 scale that we transformed into z-scores to facilitate interpretation of the results.
The 71 questions in the GEMS student questionnaire address various aspects of the school and learning environment. We focus on two sections of the questionnaire. The first section describes the classroom climate and pedagogic. In this section, students are asked to rate the extent to which they agree with a series of general statements that describe the classroom environment and teaching methods used by their teachers. The students’ responses, on a 6-point scale ranging from 1 (strongly disagree) to 6 (strongly agree), are used as outcome measures for the overall gender peer effects on classroom environment (that are due to compositional changes and changes in students’ behavior).
In a second section, the student is asked a series of questions about his/her own behavior. These questions allow us to assess whether gender peer effects on classroom environment come from changes in students’ individual behavior rather than only through changes in the class gender composition. We also look at a third set of questions that provide information on time allocated to homework in math, Hebrew, English, and science and technology. We use this information to highlight the effect of the classroom gender composition on another potential dimension of behavioral change — students’ study effort in each of these subjects.
The student questionnaire data and test scores for the years 2002-2005 were linked to student administrative records collected by the Israel Ministry of Education (identical in structure to the data used for high school students). The administrative records include student demographics and were used to construct peer gender composition and all measures of students’ background characteristics. Using the linked datasets, we built a panel for elementary schools and a panel for middle schools. As we did for the high school sample, we drop from the panel any schools with an annual enrollment lower than 10 students.
13The GEMS are not administered for school accountability purposes and only aggregated results at the district
level are published. For more information on the GEMS see the Division of Evaluation and Measurement website (in Hebrew): http://cms.education.gov.il/educationcms/units/rama/odotrama/odot.htm.
The elementary school panel includes data from 5th- and 6th-grade student questionnaires and 5th -grade student test scores for the years 2002-2005. The sample is restricted to Jewish public schools that have mixed-gender classes. There are 997 elementary schools (808 secular and 189 religious) with test score data and 1,010 elementary schools (808 secular and 202 religious) with student-questionnaire data. Since every school is sampled once in two years, we have two observations of the same school and grade for more than 90 percent of the schools.14
The middle school panel includes student questionnaires for 7th through 9th grades and 8th-grade
student test scores for the years 2002-2005. The sample is restricted to secular schools, since there are only a few religious middle schools with mixed-gender classes. There are 395 secular schools in the sample, of which 85 percent appear in two years.
Since we have multiple grades for each school in the student’s questionnaire data, we pool all grades and years and exploit within school variation in the proportion of female students across grades and years to gain more variability in this variable. We therefore have four observations of the same school for elementary schools (5th and 6th grade for two years) and six observations of the same school for middle schools (7th, 8th, and 9th grade for two years). The analysis on student test scores for
elementary and middle schools has a more limited power since only one grade was tested, leaving us with only two observations per school.
The GEMS also includes interviews with all teachers and the school principal. The teacher survey, which was conducted by phone and had a very high response rate, included mainly questions about resources for instruction and training, but it also included three questions about teaching fatigue (“burnout”), the amount of workload, and overall work satisfaction. We use teachers’ responses to these items to explore another mechanism of the gender peer effect: namely, whether the proportion of girls in the classroom affects teachers’ fatigue and work satisfaction, which are likely correlated with teachers unobserved productivity.
Evidence on the Validity of the Identification Strategy
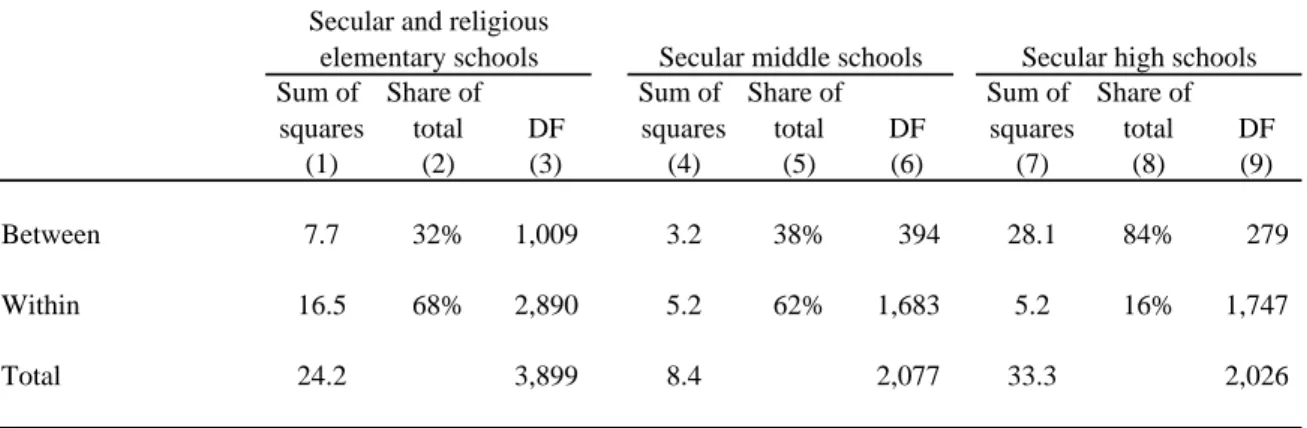
The identification strategy outlined in section II raises two main concerns. The first is related to precision: since identification relies on within school variation in the proportion of female students, sufficient variation in peer gender composition across cohorts within schools is needed to obtain precise estimates. The evidence reported in Table 1 shows that this is indeed the case. The table reports the variance decomposition of the proportion of female students in the elementary, middle, and high school samples. At elementary schools, the within school variation is larger than the between school variation,
since every elementary school that has mixed-gender classes is expected, on average, to have an equal proportion of male and female students, so that between school variations should be relatively small. The within school variation is smaller in middle schools and high schools since schools are larger at these levels. On the other hand, the between school variation is larger at the high-school level since there is some sorting of students across schools by gender.
Overall, the evidence presented in Table 1 shows that there is a considerable amount of within school variation in the proportion of female students in all levels of education that can be exploited in the empirical analysis. Figures 1 and 2 show that this variation is evident not only in small schools but also in medium and large schools as well as in schools located in towns of different sizes. Figure 1 displays the within school standard deviation in the proportion of female students by the average cohort size of the schools. In all three panels it is evident that the within school variation is larger in small schools but there is significant variation in larger schools as well. Figure 2 shows that there are schools with significant within school variation both in large and small towns. The evidence in Figures 1-2 is important because it suggests that the identification of gender peer effects will not rely solely on variation in small schools and towns, which are mainly situated in the periphery of the country, but will also derive from variation in medium and large schools and towns, including the large metropolitan areas in the center of the country.
A second concern is whether the within school variation in the proportion of female students is indeed random. It could be that changes in the proportion of female students in a school are correlated with unobserved determinants of student outcomes. The lack of school choice at the primary and middle school level and the very limited scope of private schooling in Israel, diminish significantly the possibility that parents will respond to the gender composition of a cohort. In high schools, such selection could potentially occur, but it is very unlikely since while parents may know the average gender composition of a school, it will be difficult for them to predict in advance the gender composition of a cohort that begins high school in a particular year.
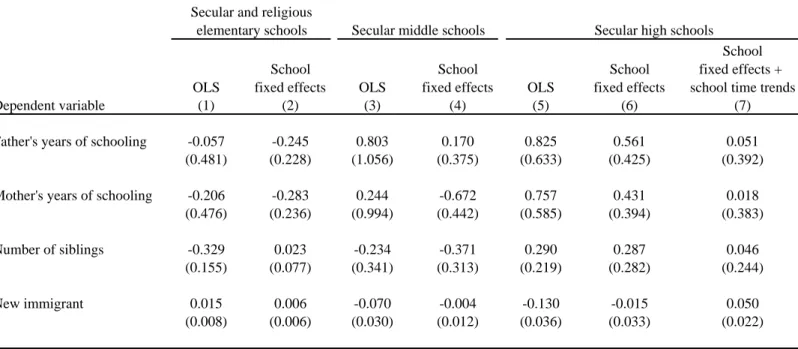
Nevertheless, to address this issue, we checked whether the proportion of girls within a school is correlated with student background characteristics such as parental education, family size, and proportion of new immigrants. Table 2 provides evidence on these balancing tests by reporting the estimated coefficients from within school regressions (by including school fixed effects) of various student characteristics on the proportion of female students in primary, middle, and high school. OLS estimates are also reported, as a benchmark for comparison.
In the elementary school sample, the proportion of female students in a grade is not related to any of the observable student characteristics, both in the OLS and the within school fixed-effects regressions. In the middle school sample, the OLS estimates suggest that grades with a higher proportion
of female students have a lower proportion of new immigrants. This negative correlation, however, is largely reduced and becomes insignificant in the within school regression. The results suggest that cohort-to-cohort changes in the proportion of female students within a school are not correlated with other changes in student characteristics.15
At the high school level, the OLS estimates show some associations between school gender composition and student background characteristics. However, these correlations are largely reduced and became insignificant in the within school regressions. The addition of school-specific linear time trends wipes away all associations. For example, the coefficient on father’s years of schooling is 0.825 (s.e.=0.633) in the OLS regression. It drops to 0.561 (s.e.=0.425) in the within school regression and it is further reduced to 0.051 (s.e.=0.392) when adding school specific linear time trends. Overall, by conditioning on school fixed effects and school specific linear time trends we effectively eliminate the observed associations between the proportion of females and family background characteristics.16
As an additional check, we performed Monte Carlo simulations for the elementary, middle, and high school samples to verify that the observed within school variation in the proportion of female students was consistent with a random process. For each school, we randomly generated the gender of the students in each cohort and computed the within school standard deviation of the proportion female.17
We repeated this process 1,000 times to obtain an empirical 90 percent confidence interval for the standard deviation for each school.
To illustrate this procedure we plotted in Figure 3 the actual and the simulated within school standard deviation in the proportion of female students for the elementary school sample. Panel A plots the actual standard deviation, panel B plots the standard deviation obtained from one simulation and panel C plots the 90 percent confidence interval computed for each school along with the actual standard deviation. It is clear from the figure that the actual standard deviations resemble closely the variation in the proportion of female students generated from a random process. The results for the middle and high school sample show a similar pattern. Overall, 89 percent of the elementary schools, 88 percent of the middle schools and 84 percent of the high schools, had a standard deviation that fell within the 90
15There could of course be a systematic correlation between students’ unobservables and the proportion of female
students. We cannot entirely rule out this possibility, even though the lack of a correlation in the observables hints that the presence of a strong correlation in the unobservables is very unlikely.
16We also performed similar balancing tests by gender and did not find any association between within school
changes in the proportion of girls and changes in the background characteristics of boys or girls. To save space we have not reported the results in the paper and they are available upon request.
17The gender of each student was randomly generated by a binomial distribution function with p equal to the
percent confidence interval, which is close to what expected.18 We further re-estimated all models by restricting the samples to schools that had a standard deviation within the confidence interval and obtained virtually identical results to those based on the full sample and reported below.
IV. Results
A. Effects on High School Students’ Achievement
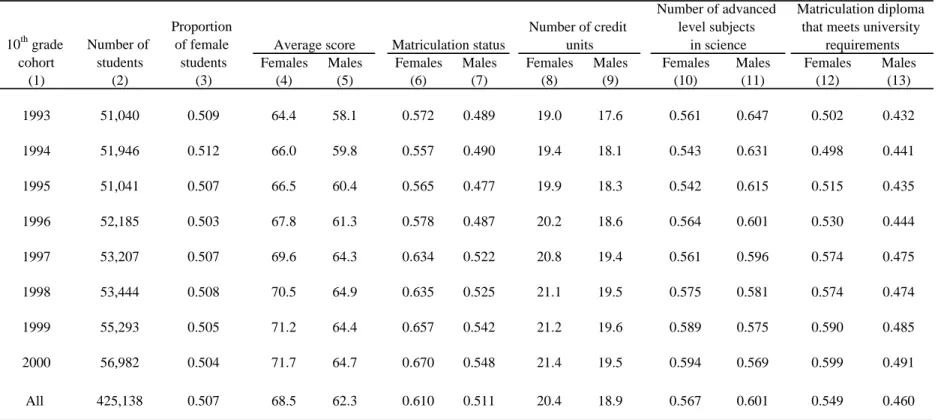
Table 3 shows descriptive statistics for student outcomes in the matriculation exams by gender and cohort, along with sample sizes and the mean proportion of female students. This sample includes 280 high schools and 425,138 students from eight cohorts. The proportion of female students is roughly 50 percent in all the cohorts and it has no apparent time trend.19
Female students consistently outperform males in almost all matriculation outcomes in every cohort. For example, on average for the whole sample period 61 percent of the girls in the sample were awarded a matriculation certificate, versus 51 percent of the boys. Girls accumulated, on average, 20.4 credit units while boys accumulated 18.9. On the other hand, boys’ matriculation curriculum includes a larger number of advanced level subjects in science in most of the years; for example, in 1995 the average was 0.647 among boys and 0.561 among girls. A turning point appears in the 1999 cohort, when girls began to outperform boys in this area as well (0.589 versus 0.575). More years of data are needed to explore whether this turning point will hold in the long run.
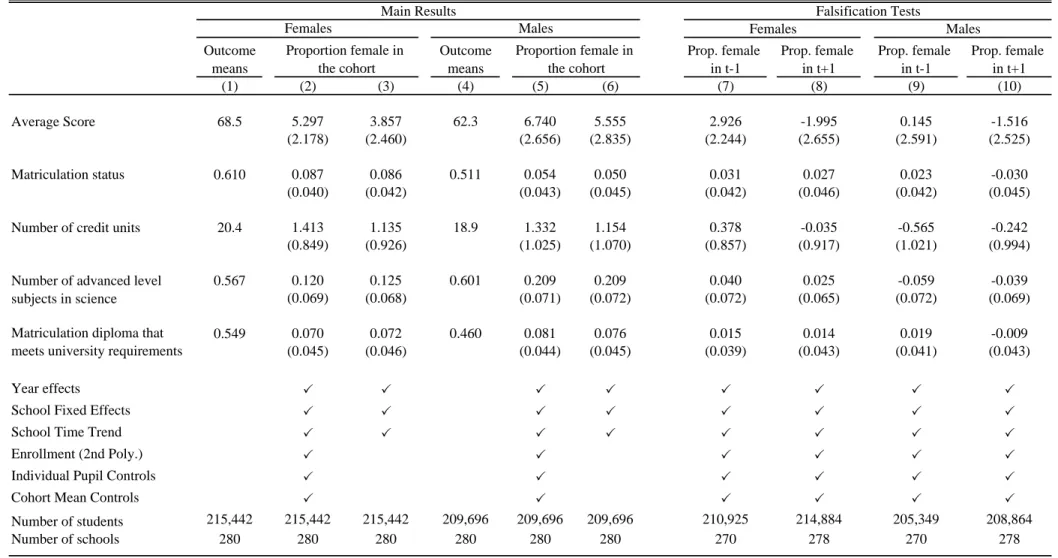
Table 4 reports the effects of the proportion of female peers on high school achievements. Each cell in the table shows the estimated coefficient on the proportion of female students from a separate regression. Columns 1 and 4 reproduce from Table 3 the sample means for the whole period for girls and boys, respectively. Columns 2-3 report the results for girls and columns 5-6 the results for boys. The estimates presented are based on two different specifications. Columns 2 and 5 report estimates when year dummies, school fixed effects, school specific time trends, school enrollment and individual’s and cohort mean characteristics are included as controls. In order to assess how sensitive are these estimates to the control of individual and cohort characteristics we report in columns 3 and 6 estimates based on a specification that exclude them from the regression.
Based on the estimates from the complete specification (columns 2 and 5) we see that both females and males tend to perform better in each of the five outcomes when they are in classes with
18 Since the models at the high school level control also for school specific time trends, the within school standard
deviations in the proportion of female students for the high school sample were computed based on the residuals from a regression of the proportion female on school fixed effects and school specific time trends..
19
In practice, only 2 out of the 280 high schools show a monotonic rising or declining trend in the proportion of
female students. Results for a sample that excludes these 2 schools are virtually identical to the results obtained for the full sample. Nevertheless, we add, as shownin equations 3-4, differential linear time trends for every school to rule out the possibility that these trends might confound theestimated effect of the proportion of girls.
higher proportions of females. Three of the five estimates for girls are significantly different from zero and the two others are marginally so. The three significant estimates capture the effects on important high school outcomes: the average score on the matriculation exams (which is used to screen students for highly competitive college and university programs), the matriculation status (a necessary condition for university admission), and the total credit units (a signal of the quality of the matriculation diploma). The effect on boys is also positive for all five outcomes, being precisely measured for three of them while the other two are marginally significant. Noteworthy is the similarity of the estimates for boys and girls. For example, the effect on the average score is 5.3 for girls and 6.7 for boys, the respective effects for credit units are 1.4 and 1.3, and on the probability of matriculation diploma that meets university entrance requirements 0.07 and 0.08, respectively. 20,21
Column 3 and 6 present the estimates when we omitted the student and cohort characteristics as controls. The estimates are virtually unchanged in comparison to those reported in columns 2 and 5. The robustness of the estimates with respect to these controls is a result of the good balancing of the characteristics with respect to the proportion of girls in the cohort once we control for school fixed effect and school specific linear time trends. 22
The above estimates imply effects of moderate size. For example, a 10 percentage point increase in the proportion of female peers increases the probability of matriculation by almost one percentage point among girls, and by half a percentage point among boys. To put this in perspective, assuming that the gender peer effects are linear, the estimates suggest that an all-female class would increase the matriculation rate of girls by about nine percentage points. Though in absolute terms it is a moderate impact, it is not so in comparison to the gains obtained from recent educational interventions aimed at raising the matriculation rate. For example, a 20 percentage point increase in the proportion of female peers would lead to an increase in the probability of matriculation that is half of the size of that estimated by Lavy and Schlosser (2005) for a remedial education program that provided additional instructional
20 We failed to reject the null hypothesis of equality of the boys and girls’ estimates for each of the five
matriculation outcomes. The hypothesis tests were based on the estimation of seemingly unrelated regressions to account for the correlation between the estimates for boys and girls.
21 We also estimated models similar to those presented in columns 2-3 and 5-6 based on aggregate data at the
school/year/gender level weighted by cell size. The advantage of this method is that clustering standard errors to correct for the correlation in the error term between students of the same grade is redundant, though we still adjust the standard errors for clustering at the school level to account for serial correlation in the error term (reflecting correlation across cohorts within the same school). The results using aggregate data are almost identical to the results using micro data. These estimates are not shown here and are available from the authors.
22 We also estimated three alternative versions of the full model reported in columns 2 and 5 where we used
different controls for the average background characteristics of the cohort. In one model, we controlled separately for the average characteristics of girls and boys. In two additional specifications, we alternated and controlled for the average characteristics of boys or girls in the cohort. All estimates of these three alternative models (not reported here to save space) were virtually identical to those obtained when controlling for the average characteristics of the cohort..
hours to high school students and a quarter of the size of that estimated by Angrist and Lavy (2004) for a program that provided large monetary bonuses to high school students to improve their matriculation outcomes.
Another example that highlights the relative size of the effect uses the estimates of the average score for females (5.297) and for males (6.740), which imply that a 20 percentage point increase in the proportion of female peers, increases average scores of girls by 1.1 points and average scores of boys by 1.3 points. These absolute gains imply an approximate increase of 4-5 percent of a standard deviation in the students test score distribution. An all-female class would raise the score of girls by 0.20-0.25 of a standard deviation, similar in magnitude to the effect of reducing class size by 33 percent (Angrist and Lavy, 1999).
B. Falsification Tests
Columns 7-10 of Table 4, present the falsification tests based on placebo measures of treatment, namely when the proportion of female students in the younger cohort (t-1) or the older cohort (t+1) replaces the true treatment measure. 23 The results based on the t-1 or t+1 measure of treatment show no
effect on any of the outcomes, for boys and for girls. All estimates are small, have inconsistent signs, and are insignificant. For example, when using the proportion of girls of the t+1 cohort (columns 8 and 10) the estimates of the matriculation rate are 0.027 (s.e.=0.046) for girls and -0.030 (s.e.=0.045) for boys. Also notable is the large difference between the estimates from the falsification regressions and from those obtained when the true treatment variable was used. For example, the estimated effect on boys’ average test score is 6.740 (column 5) when the true measure is used and 0.145 and -1.516, respectively, when the t-1 and t+1 treatment measures are used. The lack of any discerned effects when the placebo treatments are used suggests that the estimated effects of the correct measure of treatment are not biased due to omitted unobservable confounders of the effect of interest.
C. Effect on Enrollment in Advanced Math and Science Classes
One of the main arguments for single-sex classes is that girls do much better in science and math and are more likely to enroll in advanced or honors classes in these subjects if segregated from boys. In this section, we report estimates from regressions where the dependent variable is an indicator of whether a student enrolled in an advanced (five credits level) class in math, physics, computer science, biology,
23 Note that the number of observations is slightly different in columns 7-10 from the respective sample sizes in
columns 2-3 and 5-6. This is because for a small number of schools in our sample there were no classes in one of these adjacent cohorts (t-1 and/or t+1). We re-estimated the models reported in columns 2 and 5 using the same sample of columns 7-10. The results (not reported here to save space) are virtually identical and are available upon request.
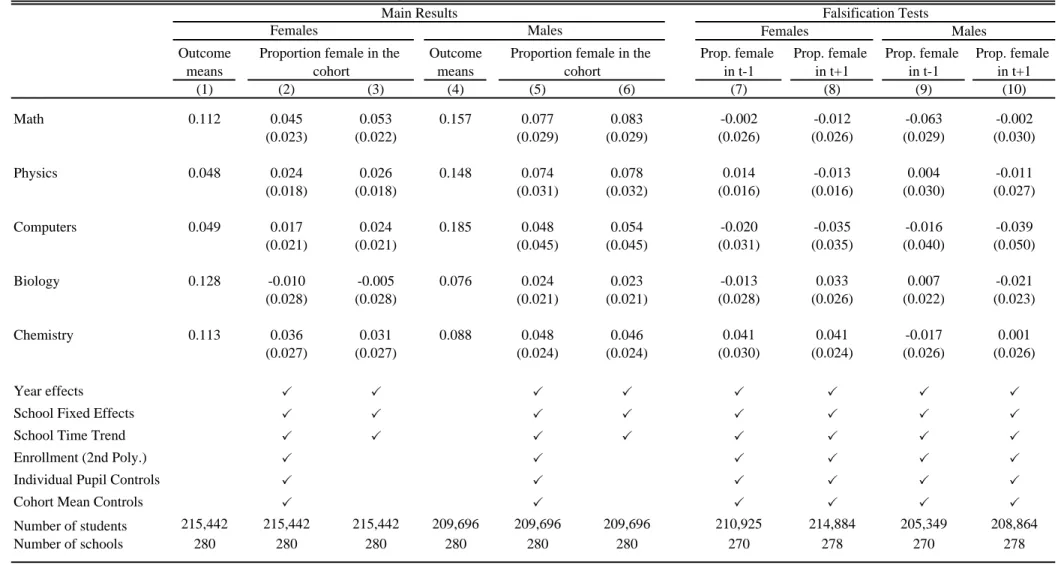
and chemistry. Table 5 (columns 1 and 4) shows that on average, over the period studied here, boys were 40 percent more likely than girls to enroll in math and much more likely to enroll in physics (a ratio of 3 to 1) and computer science (a ratio of 4 to 1). An opposite pattern, though not as sharp, is observed in biology and chemistry. In advanced English, girls had a marginally higher enrollment rate, though the gender gap in enrollment in this subject is very small.
Table 5 presents the estimated effect of the proportion of girls on enrollment rates in these subjects using the same specifications reported in Table 4. Focusing on estimates from the full specification at the micro level (columns 2 and 5), a surprising pattern emerges: the proportion of girls in a class causes an increase in the enrollment of boys in all subjects except biology and computer science, while there is a much smaller parallel effect on girls. The only significant effect among girls is on math enrollment, though the effect is about half the size of the effect among boys.
The estimated effect on physics enrollment for boys is 0.074 (s.e.=0.031) and for girls only 0.024 (s.e.=0.018), the former highly significant while the latter is much less precise. These results, however, do not necessarily imply that increasing the proportion of girls in a class would widen the gender gap in math, physics, or computer science, because the effects on both genders are of a similar magnitude relative to the respective group means. For example, the coefficient for physics among girls is 0.024 relative to a mean of 0.048 while the coefficient for boys is 0.074 relative to a mean of 0.148. However, the standard errors for the coefficients are too large to allow rejecting the hypothesis that the effect among girls is statistically different from zero. Since the outcome means for physics and computer science are much lower for girls than for boys, it seems that we do not have enough power to determine whether there is any effect among girls in these subjects.
Columns 7-10 present respective falsification regressions for the main results, using the same placebo measures as used in the regressions reported in Table 4. The results when either of the placebo measures (proportion of girls at t-1 or t+1) of treatment was used reveal an overall pattern of no effect on the enrollment rate in the various subjects. This is in sharp contrast to the estimates when the true treatment measure was used, especially for boys, which suggests that the results in reported in columns 2, 3, 5 and 6 are not spurious.
D. Heterogeneous Effects by School Size
Since the larger variability in the proportion of female students arises from small schools, we examined whether all the effects obtained on students’ achievement come from small schools only. Table A1 presents the results for samples stratified by school size: average cohort size below 200 (147 schools) and average cohort size of 200 or above (133 schools). The table reports also the outcome means by school size.
Interestingly, the effects of the proportion of female students are very similar in the samples of small and large schools. As expected, the standard deviation of the proportion of female students is higher for small schools than for large schools (0.061, on average, versus 0.039) and there is a loss in precision in both sub-samples. Overall, the estimates obtained in both sub-samples are virtually identical to those obtained in the full sample. This shows that there is enough variation in the proportion of female students to allow a precise estimation even in the sample of large schools. Therefore, our results are relevant for schools of all sizes.
E. Allowing for Non-Linearity in the Effect of Treatment
To allow for a non-linear effect of the proportion of girls on student outcomes, we computed quintiles of this variable and replaced the single treatment in the regression with a set of quintile indicators. Since each school is observed in multiple years, some schools could have switched quintiles in different years. In a specification that includes school fixed effects, these dynamics are the source of variation for identification of non-linear effects of the proportion of girls.
Panel A of Table A2 reports summary statistics on the quintiles. The first quintile includes schools with a proportion of girls in the range [0-0.4390]. The second, third, fourth, and fifth quintiles are defined for the following ranges respectively: [0.4391-0.4990], [0.4991-0.5389], [0.5390-0.5842], and [0.5843-1]. The median of the first quintile is 0.346, and the median of the fifth is 0.628. Panel B of Table A2 presents a matrix with information on the extent to which schools switch from quintile to quintile. The diagonal of the matrix shows the number of schools that remained in the same quintile throughout all years. Indeed, the number of schools that remain in the same quintile all years is very low (37 out of 280). The elements of the off-diagonals report the number of schools that are observed in two different quintiles throughout the eight years of data. If we focus on the first row of the matrix, for example, we see that 73 schools changed from quintile 1 (q1) to quintile 2 (q2), 60 from q2 to q3, 36 from q3 to q4 and 22 from q4 to q5.
Two interesting patterns emerge in the matrix. First, there is a considerable amount of within school mobility across quintiles, a condition needed for identification. Second, for a given quintile, the probability of moving to other quintiles declines with the distance from the origin, suggesting that the movement of schools across quintiles is relatively smooth. Another interesting feature of the panel data is that schools switch quintiles in one out of every two opportunities: there were 1,753 such occasions and 915 switches actually occurred.24
24 A panel of eight years provides each school with seven opportunities for switching across quintiles, but since the
Table 6 presents the estimates of the effects of switching to the second, third, fourth, or fifth quintile in the proportion of female students (relative to the first quintile) on the set of high school outcomes. Most of the effects appear to increase with the quintiles, for both boys and girls, while the significant effects are mainly concentrated in the fourth and especially in the fifth quintile, where the proportion of female students exceeds 58 percent. Focusing on the main matriculation outcomes we see that in cohorts with a proportion of girls higher than 58.4 percent, boys have a 1.4 point higher average score, a 1.5 percent higher matriculation rate, and 0.528 more credit units relative to cohorts with a proportion of girls that is lower than 44 percent. The respective estimates for girls are a 0.83 point higher average score, a 1.7 percent higher matriculation rate, and 0.45 more credit units.
Overall, it seems that the marginal effects of the proportion of female students increase when moving from lower to higher quintiles, for both boys and girls. For example, focusing on the effects on the matriculation rate among boys, the marginal effect in the second quintile relative to the first is 0.010 = 0.005/(0.473-0.309), while the marginal effect in the fifth quintile relative to the fourth is 0.147=(0.015-0.002)/(0.648-0.309). The marginal effects for girls in the first and fifth quintiles are 0.001 and 0.168, respectively.25 This result is consistent with Hoxby (2000), who finds a larger increment in
student test scores in Texas elementary schools when the proportion of female peers exceeds 66 percent.
F. Effect on Primary and Middle School Outcomes
The samples we have for primary and middle schools pool together only two cohorts of 5th and
8th grades, respectively. Therefore, the identification of within school variations is less powerful in these
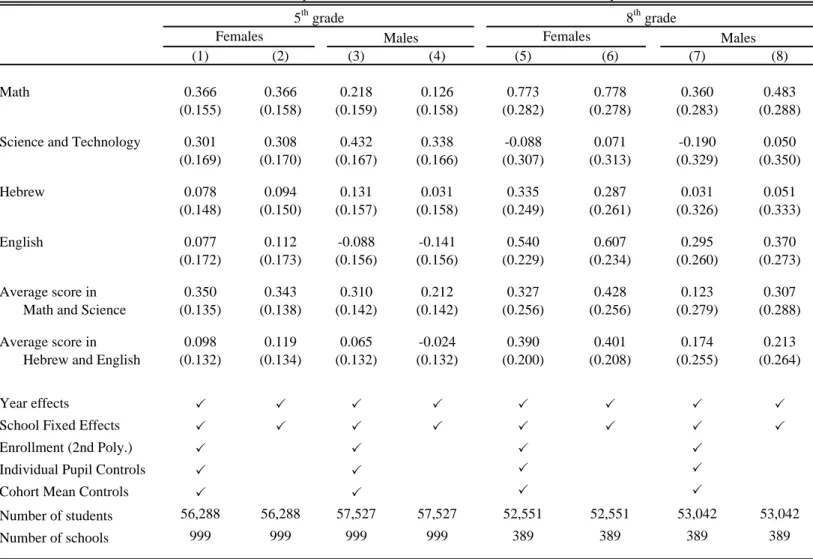
samples. Nevertheless, albeit to a lesser extent, we do find positive effects of the proportion of girls on test scores. Table 7 presents the results for 5th grade (columns 1-4) and 8th grade (columns 5-8) based on
the same two specifications we used for estimating the high school outcomes equations. Focusing on the specifications that included all the controls, the estimates for math and science scores in 5th grade show
positive effects although standard errors are sometimes too large to obtain significant estimates. Estimates for girls’ achievements in math and science are 0.366 (s.e.=0.155) and 0.301 (s.e.=0.169) implying that a 10 percentage point increase in the proportion of female students increases girls’ test scores in math and science by 3.7 and 3.0 percent of a standard deviation, respectively. Estimates for boys are 0.218 (s.e.=0.159) and 0.432 (s.e.=0.167) for math and science, respectively. These effects are slightly larger than Hoxby (2000) who found that a 10 percentage point increase in the proportion of female students increases students math tests scores by 1-2 percent of a standard deviation in Texas
25 The same qualitative results are obtained when evaluating the marginal effects using the median points of the
elementary schools. Estimates for Hebrew and English are small for both genders and are not statistically significant.
To reduce measurement error and improve precision, we also estimate the effects on achievement using the average test scores in math and science and the average test scores in Hebrew and English. The estimated coefficients for the average of students’ math and science scores are significant for both genders. The size of the effect suggests that a 10 percentage point increase in the proportion of female students increases average test scores of girls and boys in these particular subjects by 3.5 and 3.1 percent of a standard deviation, respectively. On the other hand, estimates of the effects on the average of Hebrew and English scores are positive but not significant. It is noteworthy that while girls perform remarkably better than boys in Hebrew and English, the effect of the proportion of girls on students’ performance is only visible in math and science, subjects where girls have a small or no advantage compared to boys. This suggests that girls’ peer effects do not operate solely through spillovers of peers’ higher achievement—an issue we explore in detail in the next section.
Results for 8th grade (Table 7, columns 5-8) show a strong effect of the proportion of girls on girls’ math and English test scores, with smaller positive effects for boys but with large standard errors.
V. Identifying the Mechanisms of Gender Peer Effects
The results reported above show that both boys and girls exhibit higher achievement when they have more female peers in their class. In this section, we explore the mechanisms through which girls may affect their peers. One obvious mechanism could be the spillover of girls’ achievement. However, it seems unlikely that all gains in achievement are generated solely by this channel since we find positive effects of the proportion of girls even in subjects where girls have lower achievement than boys (e.g., the number of credit units in scientific subjects in high school or math and science test scores in elementary schools).26 This is also consistent with Hoxby and Weingarth (2005) who find that even after controlling
for peers’ lagged achievement, race, ethnicity, and income, a higher proportion of girls in the class, leads to higher test scores for both genders. In this section, we examine other possible channels using a rich set of behavioral outcomes among middle and elementary school students and teachers.
A. Classroom Environment
We focus on 11 items in the student questionnaire that relate to the classroom and school environment. To obtain a more general picture of the possible mechanisms and to gain statistical power, we also group the 11 outcomes into the following categories: classroom disruption and violence;
26It could still be the case that gender peer effects are working solely through girls’ higher achievement if there are
student relationships; teacher-student relationships; school discipline; and students’ satisfaction with school. Low scores achieved in the first category and high scores achieved in the latter four categories point to improved outcomes.
Following Kling et al. (2007) we compute the average effect τc for each category c by averaging across the standardized effects of the individual outcomes included in that category. That is, the average
effect of the proportion of female students for category c is defined as
1
1
Kc kc c k c kck
π
τ
σ
==
∑
where kcis thenumber of outcomes included in category c, πkc is the effect on outcome k included in category c, and σkc is the standard deviation of the outcome. To calculate the variance of τc it is necessary to estimate the covariance matrix of the individual effects within each category. We do so by estimating a system of seemingly unrelated regressions for the outcomes in each category.27 By averaging across the effects on
different outcomes within a category, we implicitly attribute equal weight to all outcomes. Since there is no prior information to justify a particular weighting, we assign equal weight to all outcomes as it provides a more transparent interpretation.
As an alternative strategy, we also constructed aggregate outcomes by averaging across the standardized outcomes included in each category and estimated the effects of the proportion of female students on these aggregate outcomes. The results for these averaged outcomes (not reported here to save space) are virtually identical to the average effects for each category reported below in Table 8.28 Table
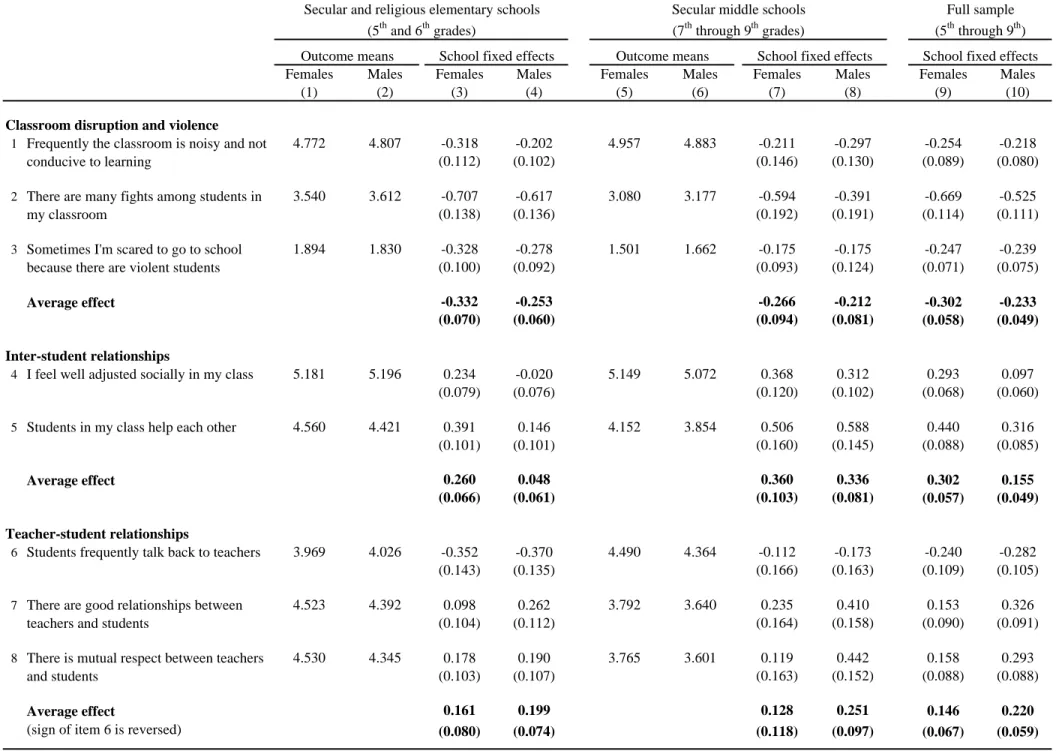
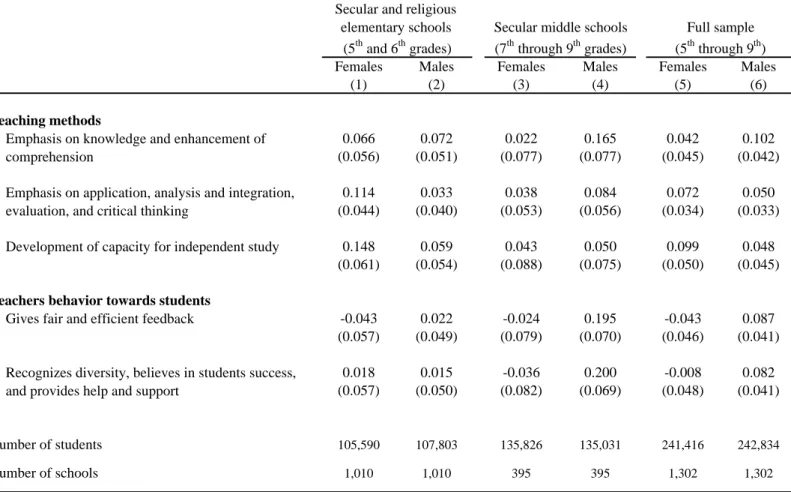
8 reports within school estimates using pooled data of 5th and 6th graders, a second sample of 7th through
9th graders, and a pooled sample of 5th through 9th graders. We report results for individual outcomes as
well as the average effect for each category.
Classroom Disruption and Violence
The analysis on classroom disruption and violence is based on the following items: (1) “Frequently the classroom is noisy and not conducive to learning”
(2) “There are many fights among students in my classroom”
(3) “Sometimes I’m scared to go to school because there are violent students”
27 This method treats the standard deviation of the outcomes (σ
kc) as known. It is possible to account for the
sampling variance of σkc by applying the delta method or bootstrapping. Kling and Liebman (2004) show that the
estimates that result from the delta method or bootstrapping are similar to those obtained under the assumption of known σkc in a study that evaluates the effects of the Moving to Opportunity program on youth outcomes. Based on
their results and given the large sample size of our study, we treatσkc as known.
28 In practice, both methods provide identical estimates when there are no missing values in item responses and the
The mean responses of girls and boys to these questions are almost identical as seen from columns 1-2 (primary school) and columns 5-6 (middle school), implying that students’ subjective assessment of the classroom environment is similar across both genders. 29
The estimates reported in columns 3-4 and 7-8 in the first panel of Table 8 suggest that a higher proportion of girls in a class significantly lowers the level of disruption and violence. This effect is evident in each of the three items, as reported by both boys and girls, and it is equally precise and important in primary and in middle school. In columns 9-10 we report the estimates from a sample that pools all grades together. The pooled sample provides some gain in precision, reducing the standard errors by 20-40 percent. The estimate for the effect of the proportion of girls on students’ reports regarding the level of noise in the classroom, for example, is -0.254 (s.e.=0.089) for girls and -0.218 (s.e.=0.080) for boys.
The average effect is much more precise than the estimates for the individual items: the estimate for girls in the pooled sample is -0.302 (s.e.=0.058) and for boys it is -0.233 (s.e.=0.049). Overall, these results suggest that having more girls in a class highly improves the learning and safety climate by lowering the disruptions during lessons, lowering the incidence of fights, increasing the safety of students, and lowering their anxiety about attending school. Beyond the direct effect, personal safety in school can also indirectly affect students’ achievements by improving motivation, concentration, and other non-cognitive factors that are important for learning. In addition, fewer disruptions during class are likely to lead to a more efficient use of the instruction time.
Inter-Student Relationships
Two items in the questionnaire (“I feel well adjusted socially in my class” and “Students in my class help each other”) provide an indication of the quality of inter-student relationships that can be conducive or harmful to learning and achievement. Being well adjusted and acceptable socially among classroom peers may improve a student’s self-confidence, self-image, motivation, and other non-cognitive attributes that might be essential for effective learning. The cooperation between students may comprise help with homework or with test preparation, both of these implying additional instruction times and better learning.
29 There are some small differences between boys and girls’ reports within the same classroom. We have examined
these differences along with differences in mean responses by other student characteristics, like family size or immigration status. These results, not shown in the paper, are available from the authors. Overall, the within classroom differences by gender are relatively small compared to the differences by immigration status. Nevertheless, in order to compare the results among boys and girls, we only need to assume that boys and girls perceive changes in classroom environment in a similar way.
Boys and girls have similar feelings regarding their social adjustment in class. On the other hand, girls have a more favorable view of the cooperation between students in a class, especially at the middle school level, suggesting perhaps that girls are more cooperative than boys are. The within school estimates show that a higher proportion of girls in a class improves both outcomes significantly. The effect among girls in primary school is larger than among boys, but in middle school it is equal for both genders. The estimated effects are larger in middle school, reflecting perhaps the increased importance of social interaction among teenagers and a more pronounced effect of girls in a more ‘turbulent’ classroom. The average treatment effect of these two items over all grades is 0.302 (s.e.=0.057) for girls and 0.155 (s.e.=0.049) for boys.
The Quality of Teacher-Student Relations
Three items are used to examine the effect of the proportion of girls in a class on the relationships between students and teachers. The first item identifies how rude students are to their teachers (“Students frequently talk back to teachers”). The effects of the proportion of girls in a class are significant and negative, meaning that a higher proportion of girls lead to a lower frequency of offensive treatments of students towards teachers, with the effects being similarly reported by boys and girls. In contrast, we do find a different effect for boys and girls when we look at two other aspects that affect the quality of the relationships between students and teachers. For these two items “There are good relationships between teachers and students” and “There is mutual respect between teachers and students”, the estimates are much higher for boys than for girls in both primary and middle schools. Overall, we can conclude that the peer effect of girls in school is working through the quality of teacher-student relationships as well, and that it is doing so largely among boys.
School Discipline
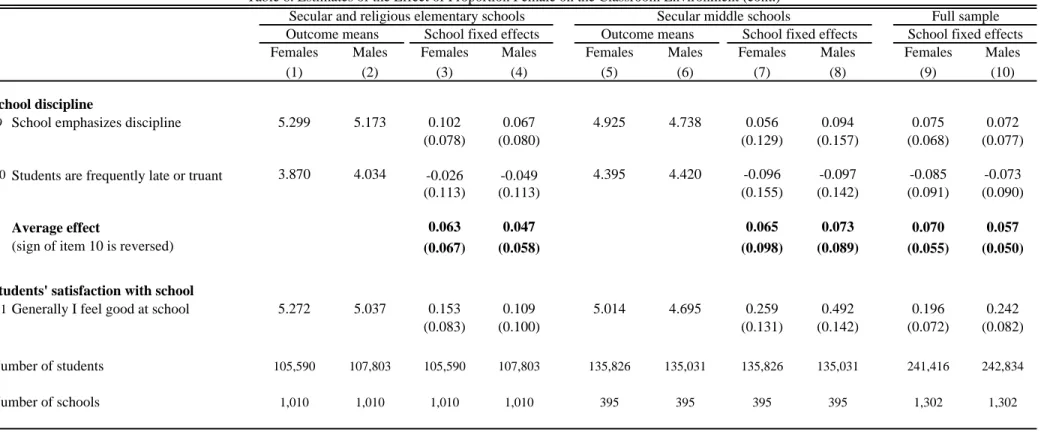
Two items allow us to examine whether a higher proportion of girls leads to greater emphasis and/or enforcement of discipline in school. We find no effect on either item. The sign on whether the school emphasizes discipline is indeed positive but it is not significantly different from zero as is the effect on the incidence of students frequently being late or truant, an effect that is negative but not significant. The average effect for these two outcomes has a lower standard error but is also insignificant. Overall, it seems that the improveme