SARAC – SAFETY RATING BASED ON REAL-WORLD CRASHES FOR SUPPLEMENTATION OF NEW CAR ASSESSMENT PROGRAMS
Klaus Langwieder
Comité Européen des Assurances (CEA) German Insurance Association (GDV), Institute for Vehicle Safety, Munich, Germany
Brian Fildes
Monash University Accident Research Centre, Australia
Timo Ernvall
Helsinki University of Technology, Finland
Max Cameron
Monash University Accident Research Centre, Australia
Paper Number 175
ABSTRACT
New car crash testing programmes promote car manufacturers, by the way of consumer choice, to improve the occupant protection of new car mod-els. It is also possible to produce an assessment of relative car occupant protection on the basis of real world accidents.
NCAPs and safety ratings based on real-world ac-cidents are complementary. Whereas crash test programmes attempt to simulate the most likely crash types and are carried out in controlled labora-tory conditions, assessments based upon real world accident data reflect all accident circumstances. Neither approach guarantees a perfect rating sys-tem but both have the potential to produce consis-tent consumer information about the relative safety of cars.
Therefore, the European Project “Quality Criteria for the Safety Assessment of Cars based on Real World Crashes” was established, with three major objectives:
- description of existing rating methods and identification of problem areas;
- inter-relationship between retrospective (acci-dent-based ratings) and prospective barrier-test rating systems;
- consideration of vehicle compatibility and ag-gressivity ratings.
The activities of this Safety Rating Advisory Committee (SARAC) which is directly aligned to
ordinated by the Committee of the European Insur-ers and founded by project membInsur-ers from 10 coun-tries including Europe, United States of America, Australia and Japan.
The comparison of EuroNCAP rating with SARAC real-world accident experience showed good corre-lation. The use of regression procedures offered new possibilities to describe aggressivity parame-ters of cars based on real accidents. Further results of the first SARAC phase and an outlook over the second project phase will be presented. Future in-vestigations will include in-depth comparison of existing rating systems with the aim to develop a comprehensive retrospective rating procedure. Consideration of active safety systems and possi-bilities of analysing/monitoring the injury outcome in car/pedestrian crashes are focal objectives in SARAC 2. A specialised database containing real-world crash data of vehicle models which have been tested in NCAP crash tests will be established.
INTRODUCTION
Requirements regarding passenger car construction, which are intended to protect the occupants in criti-cal crash accident situations have been part of mo-tor vehicle legislation in automobile-producing countries for many years. In their first stage, such regulations addressed certain safety-related com-ponents like seat belts and their anchorages, seats, head restraints and steering systems. Advances in crash testing technology and anthropometric test device development permitted the introduction of integrated test procedures where the whole vehicle is subjected to standardised impact tests, e.g. front and side occupant loads are measured by test dum-mies.
Technical regulations as part of the overall legisla-tive structure are normally based on the state of the art and thus can only define minimum requirements applicable to all vehicles. In actual practice the de-gree of compliance will vary among vehicle types and it has been argued that the number of victims in road traffic accidents could be reduced if, for a given vehicle class, only those vehicles would be purchased and operated which offer the highest level of occupant protection.
In order to enable consumers to make a proper choice, governments and/or other institutions have initiated New Car Assessment Programs (NCAP) where vehicles are subjected to crash tests which, in comparison to those specified in regulations, in-corporate higher crash severity and additional
crite-tailed rating information. At present, NCAP sys-tems are common practice in the EU as well as in the United States, Australia and Japan. Their prin-cipal objective is to promote consumer interest in car passive safety and to influence manufacturers to improve occupant protection of new vehicle types. NCAP crash tests are carried out under controlled laboratory conditions. However, ultimate test of safety potential for a given vehicle type is its per-formance in the real-world crash environment which features a wider spectrum of parameters. Considerable variations may occur in crash con-figurations such as impact speed, location and op-ponent and also in occupant characteristics such as age, sex, seating position or restraint use.
General road accident statistics, mostly based on police records, are an established part of adminis-trative action in many countries; however, in their aggregate form they are not suitable for vehicle type-related information. As a consequence, there have been efforts to establish statistical methods which allow to determine real-world crash per-formance as a function of vehicle type. Such sys-tems exist today in several European countries as well as in Australia and the United States. As in the case of NCAP the objective is to create information for consumers, manufacturers and policy makers which would, in the long term, lead to an im-provement in overall road traffic safety.
In 1994 the Institute for Vehicle Safety of the Ger-man Insurance Association (GDV) established a national advisory group including experts from the accident research community, government agen-cies, universities and automobile manufacturers as a discussion forum for all questions regarding vehi-cle rating systems based on real-world crash data. It soon became evident that this forum would be much more effective if it involved safety rating ex-perts from all over the world. GDV therefore held a series of five international workshops where the participants identified and discussed a number of key issues, such as database requirements, control-ling for exposure, outcome measures and the publi-cation of ratings [1].
There was general agreement that more knowledge and a continuing co-operation was necessary. It was therefore decided to establish a Safety Rating Advisory Committee (SARAC) and to submit a proposal for a research project entitled "Quality Criteria for the Safety Assessment of Cars Based on real-World Crashes" to the European Commis-sion (EC). In 1999 a research contract was signed between the EC and the Comité Européen des As-surances (CEA). SARAC assumed the function of a Steering Committee, with GDV acting as the ex-ecutive secretariat on behalf of CEA (Figure 1).
C o m i t é E u r o p é e n d e s A s s u r a n c e s ( C E A )
C o m m i s s i o n o f t h e E u r o p e a n C o m m u n i t i e s ( E C )
USA:• Insurance Institute for Highway Safety • Highway Loss Data Institute
Australia:
• Monash University Accident Research Centre
France
• Laboratory of Accidentology, Biomechanics and Human Behavior, PSA Peugeot Citroën/Renault
Japan:
• National Organization for Automotive Safety and Victims’ Aid (OSA) • Japan Automobile
Research Institute (JARI)
Spain:
• Centro Zaragoza. Instituto de Investigación
Sobre Reparación de Vehículos, S.A.
Germany:
• GDV
Institute for Vehicle Safety
• BASt
• BMW Group
• DaimlerChrysler AG • Ford Motor Company • TU Braunschweig
• VDA
• Volkswagen
United Kingdom:
• Department for Transport,
local Government, and the Regions
Sweden:
• Folksam
• National Road Administration
Finland:
• Finnish Motor Insurers’ Centre • University of Oulu
• Ministry of Transport and Communi-cations
• Vehicle Administration Centre
THE CEA/EC SARAC RESEARCH PRO-GRAM
As a general guideline for the CEA/EC research program SARAC had defined three major objec-tives:
− To assess the suitability of existing real-world crash data analysis systems to provide high quality safety ratings of passenger cars and to continue to improve these systems by the iden-tification and inclusion of new and revised key variables where appropriate.;
− To use retrospective analysis of real-world crash data to complement and supplement pro-spective crash test results;
− To include issues of crash compatibility and vehicle aggressivity using retrospective real-world crash data analyses.
RESULTS OF THE FIRST SARAC PHASE
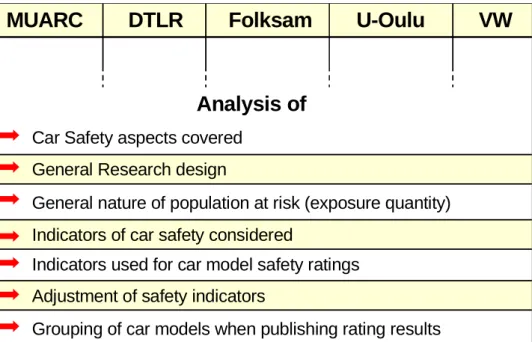
The first phase of the SARAC Research project [2] [3] has been finalised by the end of 2001. Principal investigations on safety ratings world-wide, ad-vanced methods to assess crashworthiness and ag-gressivity and procedures for international com-parison of rating results have been developed. For the first time a standardised description of world wide existing car safety rating methods has been elaborated, Figure 2 shows the main aspects. In crashworthiness analysis, most of the existing rating systems are based on police data. Only in Finland and the U.S. the data of the insurance com-panies are used as main basis. In Sweden and
Aus-tralia the initial police data are matched with insur-ance claims [4].Most of the ratings aim to cover the secondary safety aspects. In general, the predomi-nant rating criterion was the risk of injury and/or severe injury to the drivers of the specific car mod-els when involved in a crash. This risk measure-ment is appropriate for a crashworthiness rating system. Some other systems, especially of the In-surance Institute of Highway Safety[6], aim at a combination of primary and secondary safety, but in general, aspects of primary, active safety, have to be taken more into consideration. Also Finnish [5] and U.K. [9] systems are intended to cover pri-mary safety, too, but they are still limited in their exposure entry criterion. The Swedish [7], Finnish and U.K. ratings are based on two car accidents -therefore, the major risk factor “single-car acci-dents” is not covered in the ratings.
A major difference is also to be expected if only accidents are covered (as in Sweden and U.K.), where at least one driver or front seat passenger was injured. In other studies such as from Univer-sity of Oulu [5] or Monash [8], the tow-away re-porting criterion is used. As in future with im-proved occupant protection by the combination of belts and airbags, even serious accidents could be sustained with no injury at all, the criterion “injury cases“ could lead to a negative selection and there-fore, the tow-away criterion seems to have advan-tage.
But, this criterion has problems: if aspects of primary (active) safety should be covered in future, -the defined accident rate has to be related to car registration figures and/or mileage.
MUARC
DTLR
Folksam
U-Oulu
VW
Car Safety aspects covered
General Research design
Indicators of car safety considered
Indicators used for car model safety ratings
Grouping of car models when publishing rating results
Adjustment of safety indicators
General nature of population at risk (exposure quantity)
Analysis of
Legend h = total hight wb = wheelbase t. l. = total lenght w = width
SUV * Size index [mm]:
= w.b. + 0.4 t.l. + 1,5 w.
Wheelbase mm
< 2540 2540 - 3048 > 3048
Total length mm < 2540 2540 - 2700 2710 - 2840 > 2850 < 621 622 - 644 665 - 691 692 - 726 727 - 750 > 750 < 4318 4318 - 5080 > 5080
*) SUV = Sport Utility Vehicle, including Pickup-Trucks and UUV's. **) MPV = Multy Purpose Vehicle
2 x 4 4 x 4 All models
135 < h < 155 cm no convertible
h >= 155cm h < 135 cm
Sports car & convertible
Size index [mm]
Mini Small Compact family car Family car MPV ** Luxury car Large family car Vehicle Category M1
Small Midsize Large
Wheelbase mm
Small Midsize Large Xtra Large
VC = Wb + 0,4 tl + 1,5 w
Wb = wheelbase tl = total length w = width of car
Figure 3. Vehicle Categorisation – A proposed new System by SARAC
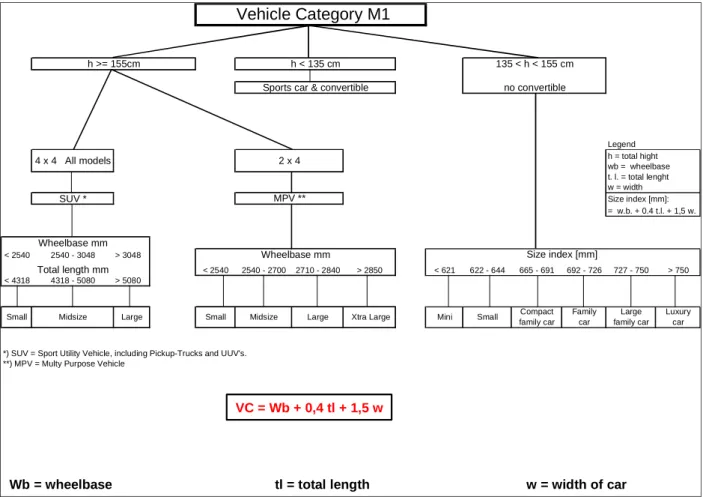
Within the SARAC project, a new system of vehi-cle categorisation (Figure 3) has been developed [11]. This new system contains a combination of height, wheel base, total length and width by use of a defined formula, SUVs and MPVs are sub-divided according to their wheel base.Finally, the question remains, how the mentioned different se-lection criteria, the different rating procedures, are influencing the general outcome of the overall rat-ing. The international co-operation within SARAC offered a new possibility.
Five crashworthiness ratings have been compared, using two uniform data bases, available to the SARAC project, namely U.S. real-world crash data from 3 States and the Finland/Oulu data base. Due to the availability of parameters in these two data bases, five rating methods were calculated for 20 defined vehicle models in U.S and Figure 4 indi-cates the outcome of the ranking, the arithmetic means and the standard deviation [10].
32 63 Fo lksam 3 DT L R 1 M UARC 1 MU A R C (N ew stead ) 1 MD M* 1 B est R an k 1 W o rs t R an k 3
Arithme tic M ean
of Ra nkin g 1,4 0,64 7% Cr a s h w o rt h in e s s r a tin g s
S tanda rd D evi ati on (Ma x. = 9, 12) P e rc en ta geStanda rd De viation (10 0% = m a x. de via ti on = 9 ,12) IIH S V ehicle ID Ranking positions in the different systems
selected case car
*) Maximum Data Model
Figure 4. Rank Order of Crashworthiness Ratings of 20 Vehicles (US-Data)
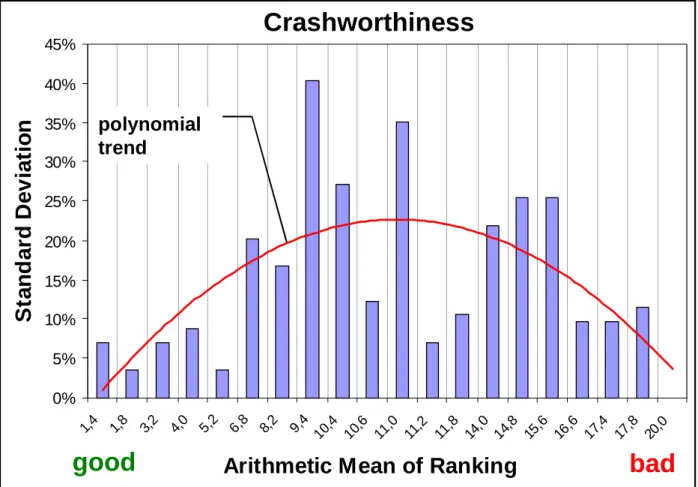
Generally, the rank order of the cars (calculated with use of the different rating methods) was simi-lar, but some cars are ranked very differently (Figure 5). The best and the worst ranking seem to be very consistent, whereas in the middle, the
rank-ing varied sometimes by 7 to 9 positions, pushrank-ing the cars from the second quarter to the last one and vice versa. 0% 5% 10% 15% 20% 25% 30% 35% 40% 45% 1,4 1,8 3,2 4,0 5,2 6,8 8,2 9,4 10,4 10,6 11,0 11,2 11,8 14,0 14,8 15,6 16,6 17,4 17,8 20,0
Arithmetic Mean of Ranking
St
a
n
d
a
rd
D
e
v
ia
ti
o
n
Crashworthiness
good
bad
polynomial
trend
Figure 5. Arithmetic Mean of Rank Order of Crashworthiness vs. Standard Deviation
As a first step, it is encouraging, that considerable similarity was apparent, especially for the best and the worst ranking cars.
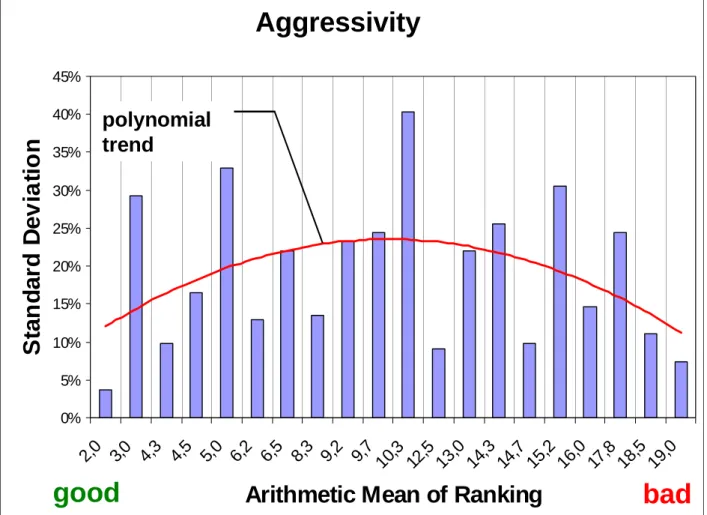
As reported, a further objective of SARAC was to include additional issues of vehicle aggressivity us-ing retrospective real-world crash data. Again, dif-ferent aggressivity rating systems have been com-pared in their application to the common data base available [13]. From the ranking positions, the arithmetic means and the standard deviation was calculated for twenty vehicles. The result showed clearly that car aggressivity (which determines the degree to which injury is inflicted upon the occu-pants of the other vehicle) is much more complex than crashworthiness. This is caused by the fact
that accident involvement risk, the design features of the case-car model, the collision type are neces-sarily combined with those parameters and the in-jury outcome in the opponent vehicle.
In summary, as shown in Figure 6, some consis-tency showed up with cars of low and relatively high aggressivity. But there are still considerable variations. Major analysis and interpretation work is necessary to understand the interactions better and to arrive at consolidated ratings with smaller differences. But the SARAC analysis has shown that even in the difficult field of aggressivity rating, progress is possible.
Aggressivity
0% 5% 10% 15% 20% 25% 30% 35% 40% 45%2,0 3,
0
4,3 4,
5
5,
0
6,
2
6,5 8,
3
9,2 9,
7
10
,3
12
,5
13
,0
14
,3
14
,7
15
,2
16
,0
17
,8
18
,5
19
,0
Arithmetic Mean of Ranking
S
ta
n
d
a
rd
D
e
vi
at
io
n
good
bad
polynomial
trend
Figure 6. Arithmetic Mean of Rank Order of Aggressivity vs. Standard Deviation
NCAP TESTING AND REAL-WORLD CRASHES
Safety ratings should always reflect as close as possible the real-world accident occurrence. This requirement is true both for prospective crash test-ing as well as for retrospective safety rattest-ing after accidents; but for both rating systems there are limitations.
The requirement of safety standards is to reflect the critical collision types of real-world accident occur-rence. This would require a national accident statis-tic showing key parameters of accident occurrence in detail.
Not only the different crash tests but also the as-pects of the relative weighting of the different crash tests strongly influence the outcome of the total NCAP rating. Furthermore, it has to be mentioned, too, that not only the different crash types but also the different injury measurements with regard to body areas strongly influence the outcome of the NCAP result. From both large-scale accident stud-ies and in-depth material, the relative ranking of the injuries on the different body areas is known.
PROBLEMS OF ACCIDENT MATERIAL
FROM REAL WORLD SAFETY RATINGS
Not only crash tests show limitations concerning usability of the national accident statistics, but also large-scale retrospective accident materials. The most common safety performance indicator currently used for crashworthiness is the risk of in-jury or the risk of serious inin-jury given in a crash. The most simple form comprised the rate of occu-pants who were killed or severely injured per num-ber of vehicle crashes. This risk of injury, respec-tively serious injury, will differ substantially if the reference basis are cases with at least one minor occupant injury or with the criterion that the vehi-cle must be towed away from the scene.
Another very often overlooked key parameter is the question, if the material is dominated by car-to-car accidents or if the ratio of crash types - including single-vehicle accidents - is balanced.
Finally, for comparisons between crash tests and real accidents, may be relevant wether the corre-sponding retrospective accident material focuses on injuries of driver only or on the injury risk to front
seat passengers. Studies within the SARAC project showed that in the Swedish FOLKSAM material there have been no substantial differences in the car safety rating, if the driver only or driver and front seat passenger have been taken into consideration. Therefore, in safety ratings the focus on the driver’s injury risk seems advisable - but some NCAP procedures are based on the worst injury risk of driver or front seat passenger.
Another complication is given by the fact that the NCAP test procedures mainly address the risk of serious and fatal injuries, whereas many accident materials are formed by the categorisation of inju-ries into minor/serious and fatal injuinju-ries.
These limitations - both from NCAP test procedure as well as real-world safety rating material - have to be considered when interpreting the comparative results.
COMPARISON OF EURONCAP AND U.K. SAFETY RATING
For the above mentioned reasons an intensive pilot study was necessary
− to learn from correlation studies of safety rat-ings and crash-tests in Australia and USA and
− to review available databases for the European correlation study on crashworthiness ratings. For reasons of time, reference is made only to the SARAC-EuroNCAP study without going into de-tails [12].
For the correlation study, all data collected within the EuroNCAP program have been supplied, cover-ing the front offset test, the 50 kph side impact test, using a mobile barrier, and the pedestrian impact test. The pedestrian test could not be considered as no reference material from real crashes was avail-able. At the time of comparison, none of the 64 Eu-roNCAP tested models had been subjected to the recently introduced pole test.
The reference accident materials came from United Kingdom and France. All car crashes involving in-jury in the U.K. reported to the police over the pe-riod 1993 to 1998 have been supplied by the U.K. Department of Environment, Transport and the Re-gions, in total 1.9 Million cars. This material was then split up into the correlation requirements, for example front and near side impact, light passenger vehicles and cases with injured driver. Vehicle models for comparison with Euro NCAP test re-sults were identified by make and model in the U.K. data.
The French material was also the national data base, managed by the Ministry of Transportation and especially supplemented by the Laboratory of
Accidentology and Biomechanics in France; the data covered accidents from 1993 to 1998 in total about 580,000 cars. It was then processed in the same way as the U.K.-material.
The crashworthiness rating was based on the risk of a driver injury (MAIS 1+) given involvement in an injury producing car-to-car crash and in addition the risk of serious injury given that the driver was injured.
The injury risk calculation corresponds to the DETR method. The injury severity calculation was that used by the Monash University Accident Re-search Center. Both components were estimated us-ing logistic regression analysis, adjustus-ing for the in-fluence of driver sex and age, speed limit at the crash location and point of impact on the vehicle. Comparing the 64 cars tested within the Euro NCAP program with the equivalent car makes in the real-world accidents, the possibilities of com-parison had to be reduced. In the U.K. material,
- 29 car models could be compared from all crash types
- 24 car models in frontal impact crashes and
- 13 cars in side impact crashes.
In the French material, the possibilities of compari-son were reduced to
- 13 car models from all crash types - 11 car models for frontal impact crashes.
- For side impacts there was insufficient real-world crash data for any car model.
This experience showed that the car fleet in differ-ent national statistics shows strong differences, even in European countries, and that it takes some two or three years until there is enough real-world crash experience related to brand-new tested NCAP vehicles.
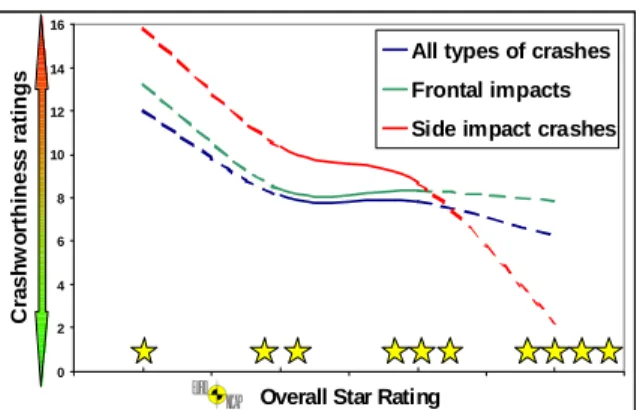
The results of the U.K. safety rating comparison with EuroNCAP is shown in Figure 7. Even in spite of the existing problems of correlation, the general result of comparing prospective and retro-spective ratings is promising. There is a clear trend, that with better EuroNCAP star rating the risk of injury is strongly reduced. It is not surprising, that the injury risk (R) shows no major reduction. Since perhaps even a „four star“ NCAP tested car cannot avoid injuries of MAIS 1, a positive correlation can not be shown MAIS 1+. However, the risk of seri-ous injury (S) and therefore the „crashworthiness“ (R x S) is strongly influenced by better EuroNCAP star rating.
Injury Risk (R) Injury Severity (S) SARAC 75.03 65.39 65.40 66.61 16.02 12.23 11.92 9.39 Crashworthiness(C) C = R x S 12.02 8.08 7.81 6.27
Data: Two-Car Accident with at Least one Injured Driver
Injury Risk: Probability that Case CarDriverisInjured Injury Severity: Prob. that Case CarDriverisHospitalisedorKilled
Crashworthiness:ProductofInjury Risk (R)andInjury Severity (S)
Figure 7. UK Safety Rating vs. EuroNCAP (All Crash Types)
For the comparison based on frontal impacts only (Figure 8), the same experience is apparent. The risk of injury (MAIS 1+) is rather indifferent for 2-4 star cars. But the risk of serious injury is clearly reduced with higher star rating, even if the difference between 2 and 3 stars is not very big. This effect could be explained by comparing the rather close point rating score from the test proce-dures in EuroNCAP. Injury Risk (R) Injury Severity (S) SARAC 66.09 53.59 54.69 59.70 20.04 15.46 15.21 13.18 Crashworthiness(C) C = R x S 13.24 8.40 8.36 7.87
Data: Two-Car Accident with at Least one Injured Driver
Injury Risk: Probability that Case CarDriverisInjured Injury Severity: Prob. that Case CarDriverisHospitalisedorKilled
Crashworthiness:ProductofInjury Risk (R)andInjury Severity (S)
Figure 8. UK Safety Rating vs. EuroNCAP (Fron-tal Impacts)
In side impacts (Figure 9) very strong differences showed up for 4-star cars compared to the other categories. But this result has to be considered with caution, as the numbers in real-world crashes of 4-star cars have been very limited and the statistical significance is not achieved for the time being.
Injury Risk (R) Injury Severity (S) SARAC 76.36 68.05 66.41 59.79 20.70 15.04 13.30 3.79 Crashworthiness(C) C = R x S 15.80 10.35 8.69 2.26
Data: Two-Car Accident with at Least one Injured Driver
Injury Risk: Probability that Case CarDriverisInjured Injury Severity: Prob. that Case CarDriverisHospitalisedorKilled
Crashworthiness:ProductofInjury Risk (R)andInjury Severity (S)
Figure 9. UK Safety Rating vs. EuroNCAP (Side Impacts)
In spite of this very promising result there are still a lot of questions to be solved. This is obvious in Figure 10 where the tolerance band of different car models is shown in addition to the average value used in the proceeding figures. Statistically signifi-cant differences are shown between vehicle models with almost the same overall EuroNCAP point rat-ing score, from which the star ratrat-ings are derived. As expected especially between 2- and 3-star cars, there are a lot of overlapping results.
0 2 4 6 8 10 12 14 16 18 0 2 4 6 8 10 12 14 16 18 20 22 24 26 28
EuroNCAP Overall Rating Score
A ll C rash C rash w o rt h in ess R a ti n g s
1 Star 2 Star 3 Star 4 Star
Figure 10. EuroNCAP Scores vs. UK Real Crash Crashworthiness (All Crash Types)
However this result indicates there is major benefit in a continued and enlarged comparison of NCAP tests with safety ratings based on real-world crashes. It is now important to renew this proce-dure, using an extended material - that means more NCAP tested cars and updated real-world accident material.
This result is clearly shown in the summary, Figure 11. In addition to extending the material with 3- and 4-star cars, which real-life parameters are of major influence for the relative ratings need to be analysed.
0 2 4 6 8 10 12 14 16
Overall Star Rating
C ra s hw or th in e s s ra ti n g s
All types of crashes Frontal impacts Side impact crashes
Figure 11. UK Safety Rating vs. Overall Star Rat-ing
The correlation study clearly showed that it is es-sential to supplement the NCAP results with observations from real-world crashes.
It is necessary to validate the weighting procedure of the crash tests in correspondence with the occur-rence criteria from real-world crashes. Intensive analysis of the retrospective rating results should be done as a supporting part to the overall NCAP score, as it seems that additional other factors are determining real-crash outcomes.
To analyse these factors, NCAP and SARAC acci-dent materials, i.e. prospective and retrospective ratings, should be developed in parallel and should be updated from year to year. Within the SARAC project, the methods for the correlation studies are now developed and can be transferred easily to the members in different states.
The national data should be supplemented with some key variables, which would be highly valu-able in comparison with Euro NCAP and which could contribute to a better understanding of the in-fluencing factors. The following requirements for real-world accident materials are suggested:
− correct and systematic notification of the car by make and model
− specification of safety measures, such as avail-ability of the airbag, use of safety belt etc.
− improved description of collision type, at least specification into front, side, rearend impact or rollover
− better description of impact severity. The best procedure, would be the use of a black box, giving the delta v values or the level of decel-eration as well as the angle of impact.
− also improved notification of the crash defor-mation in the sense of a vehicle defordefor-mation index, would be a big step forward. In Europe, an electronic data recording system for police reports has been developed; this system would
easily allow the notification of these additional factors.
− the improvement of the global injury catego-ries “minor, serious, fatal injucatego-ries“ would be of major benefit. The category „serious injuries“ covers very moderate injuries with short hospi-talisation as well as life threatening injuries or paraplegias. It would be essential to offer bet-ter specification of this decisive category of in-jury classification.
− the time delay between NCAP testing and suf-ficient experience from real-world crashes has to be reduced. One possibility would be to col-lect the data not only on a national basis, but also from other countries concerning a defined “case car“. Within SARAC, a procedure will be developed and tested to improve interna-tional exchange of relevant cases. But this has to be supported by improved identification methods for the equivalent safety features of cars, delivered to different countries. To achieve this co-operation and support from the car manufacturers is indispensable.
− detailed injury data, collected as part of in-depth crash studies and well correlated to key criteria of the large-scale accident material would provide an ideal opportunity to compare specific injury outcomes from real-crashes with NCAP results. This in-depth material could give additional up-to-date information concerning the injuries by body region. Re-garding these aspects, experience should be gained within the future SARAC project.
− the logistic regression analysis should be ex-tended. Analysis carried out in this report has suggested that EuroNCAP rating does not con-sistently predict real crash outcomes for all ve-hicles within one rating category. The reasons for these differences should be analysed in a case-by-case analysis; this should allow better assessment of the relationship between specific test dummy scores and real-crash outcomes besides using the summary barrier test scores. In both rating systems, it should be tried to bet-ter identify the reasons for a specific rating re-sult. At least, even in retrospective safety rat-ings, it should be possible to analyse the crash conditions, which are responsible for a certain ranking value.
Continuous co-operation between NCAP and SARAC activities is essential for further consumer information. It is to expect that car manufacturers succeed more and more in fulfilling “Star Rating Criteria“. Given that situation, it is even more im-portant that real accidents show the way how addi-tional criteria are necessary for further improved
safety. It is to be expected that in spite of these high NCAP test results real-world accident material shows differences in safety performance and may contribute to the assessment, if the safety behaviour of a car is good in all categories of collision speed and not only at the relevant test speed. The real-world crashes also can show that the safety does not cover the specific test configurations, but will cover all crash situations. As well, it has to be shown that the safety benefits are not only related to a 50% dummy, but to all age groups and height categories of occupants.
As the comparison with EuroNCAP showed, the real-world crashes are composed by a broader spec-trum and therefore, even if the crash configurations of an NCAP procedure are fulfilled, real-world crashes subjected to a sophisticated safety rating procedure will supplement, complement and enlarge the crash results. This will consolidate the safety information in general and will lead to com-prehensive, reality orientated and continuous con-sumer information.
THE NEED FOR FURTHER RESEARCH
The research program prescribed and carried out by SARAC has provided information about both real-world performance and crash test performance of passenger cars. It has also highlighted the need to give greater attention to vehicle aggressivity to improve the compatibility of the vehicle fleet. Furthermore, new research indicated the need to interpret aspects of pedestrian protection and systems of Primary Safety (crash avoidance/mitigation) to reflect all recent developments of car safety.
The work of SARAC has thus clarified many of the issues related to historical crashworthiness rating systems. In addition, other issues warranting further research were identified. Therefore, the European Commission agreed that SARAC’s research be continued to address these outstanding issues. The program for these planned research projects is outlined as follows.
Safety Rating Methods
A number of tasks were identified that warrant fur-ther research in identification and specification of a high quality rating system, including:
− crashworthiness rating methods (car-car and single vehicle crashes);
− update of rating methods world wide; in amending the report 1999/2000.
− reasonable measures of safety (injury scaling by body regions, harm1, injury cost scales);
− improvement of data collection and quality (inclusion of crash recorder data);
− effects relating to car occupants, car fleets and car safety features;
− unification of safety rating methods under a theoretical framework combining statistical and physical conceptual models of the rela-tionship between injury outcomes, crash cir-cumstances and car model parameters;
− development of rating criteria which make fuller use of the ordinal injury scales typically available in large crash databases, including the use of non-linear analysis methods;
− alternative approaches and interpretations of regression methods used to adjust the rating criteria for variations in crash exposure factors.
Continuation of Correlation Research
The preliminary work on correlating real-world and crash test ratings showed considerable potential for a better understanding of crashworthiness and international co-operation resulting in improved reliability and comparison to NCAP results. Future research needs in this area include:
− update and extension of the correlation analy-sis as more data becomes available;
− examine more closely the effects of front and side collisions, including other crash types when these data become available; and extend-ing onto aspects of pedestrian protection and primary safety.
− study the relationship between individual Eu-roNCAP scores and injury risks in real-world crashes
− examine the progressive safety improvement of NCAP tested vehicles using both prospec-tive and retrospecprospec-tive ratings.
Safety Ratings for Consumers and Policy Mak-ers
− a better understanding of what safety generally means to consumers and policy makers and the implications for both crashworthiness and ve-hicle aggressivity;
1
Harm is the societal cost of trauma, defined as the frequency of injury by its cost to society. It can be broken down into components of interest, such as the average occupant Harm incurred per crash by vehicle make and model
− value and scope of passive ratings for consum-ers and policy makconsum-ers;
− more detailed research aimed at illustrating the potential for conflicting vehicle ratings across the various systems and suitable means of combining different systems into a single rat-ing method;
− stronger focus on the strengths and limitations of self and partner protection for the individual and the community and the implications of combining crashworthiness and aggressivity ratings.
Exposure Data, Pedestrian and Primary Safety
− the effects of different combinations of car oc-cupants (front seat, rear seat, etc) and crash types (car-car, single vehicle) on safety ratings; as well as definitions of minimum accident samples required;
− international SARAC database for safety as-sessment of NCAP tested cars based on real world crashes;
− examine the feasibility of rating pedestrian and primary safety based on real-world crash data;
− examine the effects of different fleet mixes on vehicle crashworthiness and aggressivity rat-ings;
− a more detailed examination of the description and variations in the use of the vehicle identi-fication number (VIN) and its applicability for inclusion in retrospective rating systems.
TASKS FOR SARAC PHASE II
In view of the need for further research which be-came evident as a consequence of work on various Sub-Tasks in SARAC Phase 1 and the potential to apply the developed methods to new, recent acci-dent data material, the SARAC Committee has re-viewed the items identified and set out above. A number of principal and essential issues have been found very early in the process:
- Today’s consumer information in the EU based upon prospective EuroNCAP tests could be extended by European SARAC results ob-tained through international co-operation.
- An international SARAC database of real world accidents with NCAP tested cars should be established to supplement the available na-tional accident data of the project members by extended parameters of crash outcome and to promote the comparison with NCAP crash re-sults.
- Passenger car type safety rating is a continuing task for most of the researchers involved in the CEA/SARAC project. For this community, CEA/SARAC constitutes an extremely useful forum for the exchange of ideas, experiences and new methods on a world-wide basis; this also includes the co-ordination of individual research projects. In this respect SARAC is unique in the world.
- There is a desire to merge or even harmonise passenger car NCAP crash test procedures and rating systems among the interested parties. In respect to safety ratings on the basis of real-world crashes, there are still a number of prob-lems which have to be further investigated and clarified before such a combination could take place in this area. Such problems include
- improvement of rating methodology
- use of additional databases
- definition of aggressivity and compatibil-ity
- presentation of results for consumer in-formation.
It is furthermore suggested to extend SARAC ac-tivities to areas which have not been covered in in-ternational ratings up to now but has gained in im-portance recently, such as:
- primary safety (crash avoidance/ mitigation) especially regarding Advanced Driver Assis-tance Systems (ADAS)
- pedestrian protection especially analysing the
possibilities and limits of field experience with cars announcing improved pedestrian protec-tion due to introduced EC rules.
REFERENCES
[1] LANGWIEDER, K. ,FILDES, B. (2000), “Aspects of Car Safety Assessments Based on Real World Accidents - Results of Five Workshops (1994 - 1999)”. GDV Institute for Vehicle Safety, Munich, Germany and Monash University Accident Research Cen-tre, Melbourne, Australia.
[2] SARAC (2001), “Project Description”. Ba-sic information on the CEA/EC Project, GDV Institute for Vehicle Safety, Munich, Germany.
[3] LANGWIEDER, K., FILDES, B., ERN-VALL, T., CAMERON, M., (2001), “Qual-ity criteria for crashworthiness assessment from real world crashes”. Paper no. 2001-S11-0-389, Proceedings, 17th International Technical Conference on the Enhanced Safety of Vehicles.
[4] HAUTZINGER, H. (2001), “Description and analysis of existing car safety rating methods”. GDV Institute for Vehicle Safety, Munich, Germany.
[5] HUTTULA, J., PIRTALA, P., ERNVALL, T. (1997), “Car Safety, Aggressivity and Accident Involvement Rates by Car Model”, University of Oulu, Road and Transport Laboratory, Publication 40, Oulu.
[6] Insurance Institute for Highway Safety (1997) “Driver Death Rates by Make and Model - 1991-95 Models”, Arlington. [7] HÄGG, A., V. KOCH, M., KULLGREN,
A., LIE, A., NYGREN, A., TINGVALL, C. (1999) “Folksam Car Model Safety Ratings 1991-92”, Description of Methods, Folksam Research, Stockholm.
[8] CAMERON, M., FINCH, C., LE, T. (1994), “Vehicle Crashworthiness Ratings: Victoria
and NSW Crashes During 1987-92”, Tech-nical Report, Monash University Accident Research Centre, Report No. 58, Clayton.
[9] THE DEPARTMENT OF TRANSPORT
(1995), “Cars: Make and Model: The Risk of Driver Injury and Car Accident Rates in Great Britain: 1993”. Transport Statistics Report, London.
[10] CAMERON, M., NARAYAN, S., NEW-STEAD, S., ERNVALL, T., LAINE, V., LANGWIEDER, K. (2001), “Comparative Analysis of Several Vehicles Safety Rating Systems”, Paper no. 2001-S4-O-68, Pro-ceedings, 17th International Technical Con-ference on the Enhanced Safety of Vehicles. [11] YDENIUS, A., KULLGREN, A., Folksam
Research FILDES, B., Monash University Accident Research Centre, (2000), “Charac-teristics for vehicle classification Final”. SARAC paper No. S1-8_03A published by GDV Institute for Vehicle Safety, Munich, Germany.
[12] NEWSTEAD, S., CAMERON, M., NARA-YAN, S. (2000), “Correlation between European crash data and crash barrier test results”. Monash University Accident Re-search Centre. Published by GDV, Institute for Vehicle Safety, Munich, Germany. (2001)
[13] CAMERON, M., LES, M., NEWSTEAD, S., NARAYAN, S., ERNVALL, T., LAINE, V. (2000), “Empirical Comparison of Ag-gressivity Rating Systems”. Paper no. 2001-S7-O-133, Proceedings, 17th International Technical Conference on the Enhanced Safety of Vehicles.