Comparison of centre of gravity and centre of pressure patterns
in the golf swing
AIMÉE C. SMITH
1,2, JONATHAN R. ROBERTS
1, PUI WAH KONG
3, & STEPHANIE
E. FORRESTER
11Sports Technology Institute, Loughborough University, Loughborough, UK.
2Institute for Sports Research, Nanyang Technological University, Singapore, Singapore.
3Physical Education & Sports Science Academic Group, National Institute of Education, Nanyang Technological
University, Singapore, Singapore.
Keywords: Biomechanics, force plate, balance, principal component analysis, performance, golf
ABSTRACT: Analysing the centre of pressure (COP) and centre of gravity (COG) could reveal stabilising strategies used by golfers throughout the golf swing. This study identified and compared golfers’ COP and COG patterns through-out the golf swing in medial–lateral (ML) and anterior–posterior (AP) directions using principal component analysis (PCA) and examined their relationship to clubhead velocity. Three-dimensional marker trajectories were collected using Vicon motion analysis and force plate data from two Kistler force plates for 22 low-handicap golfers during drives. Golf-ers’ COG and COP were expressed as a percentage distance between their feet. PCA was performed on COG and COP in ML and AP directions. Relationships between principal component (PC) scores were examined using Pearson correlation and regression analysis used to examine the relationship with clubhead velocity. ML COP movements varied in magni-tude (PC1), rate of change and timing (PC2 and PC3). The COP and COG PC1 scores were strongly correlated in both di-rections (ML: r = 0.90, P < .05; AP: r = 0.81, P < .05). Clubhead velocity, explained by three PCs (74%), related to timing and rate of change in COPML near downswing (PC2 and PC3) and timing of COGML late backswing (PC2). The
relation-ship between COPML and COGML PC1 scores identified extremes of COP and COG patterns in golfers and could indicate
a golfer’s dynamic balance. Golfers with earlier movement of COP to the front foot (PC2) and rate of change (PC3) pat-terns in ML COP, prior to the downswing, may be more likely to generate higher clubhead velocity.
Introduction
Maintaining a balanced body position is critical in-static (e.g. standing) and dynamic situations (e.g. walk-ing) to prevent falling, achieve the desired posture or movement (Hsue, Miller, & Su, 2009; Winter, 1995). Golf coaches perceive golfers should remain balanced throughout the swing in order to maintain posture and produce accurate and powerful swings (Smith, Roberts, Wallace, Wah Kong, & Forrester, 2015). In the golf biomechanics literature, a balanced body position has not been fully investigated but studying centre of pres-sure (COP) and centre of gravity (COG) could reveal stabilising strategies used by golfers to remain bal-anced throughout the swing. Whole body COG posi-tion in the global horizontal plane (Winter, 1995) has been used as a measure of overall body movement dur-ing balance studies (Caron, Gelat, Rougier, & Blanch, 2000). COP position has been used as an indicator of the overall neuromuscular response to control the pas-sive COG and restore equilibrium (Winter, 1995). The
relationship between COG and COP revealed strategies for maintaining an upright posture during standing (Caron et al., 2000; Winter, 1995). In dynamic situa-tions, the same strategy may not be indicative of insta-bility and hence both measures should be investigated when analysing dynamic balance (Hsue et al., 2009). In this study, dynamic balance during the golf swing is explored by measuring COG and COP and is defined as a golfer’s ability to remain balanced (i.e. not fall) whilst still achieving the intended outcome (i.e. generate high clubhead speed when striking the golf ball).
In the golf literature, more is known about COP pat-terns than COG (Ball & Best, 2007a, 2007b, 2012; Bar-rentine, Fleisig, & Johnson, 1994; Wallace, Grimshaw, & Ashford, 1994). Group- based analyses have revealed two styles of COP movement in the medial–lateral (ML) direction for a heterogeneous group of golfers (Ball & Best, 2007a, 2007b). The styles were termed “front foot” and “reverse foot” (Ball & Best, 2007a, 2007b). For both styles, COP moves to the back foot
(defined as the right foot of a right-handed golfer) dur-ing the backswdur-ing. The front foot style was character-ised by COP translating towards the front foot (defined as the left foot for a right-handed golfer) during the downswing and through impact. The reverse group started moving forward in the early downswing before positioning the COP towards the back foot in the downswing, with COP positioned close to mid-stance at impact. There were no statistically significant differ-ences in handicap or clubhead velocity when compar-ing the two styles. More recently, however, Ball and Best (2012) found significant relationships between COP measures and clubhead velocity on an individual golfer basis. Individualised golfer relationships be-tween COP parameters and measures of performance could be due to the use of discrete measures which may not adequately represent the key features of the COP time-series. In addition, previous golf biomechan-ics research has defined discrete events in different ways, such as top of the backswing, making it difficult to compare across studies (Smith et al., 2015). Continu-ous data analysis techniques, such as principal compo-nent analysis (PCA), could overcome these limitations by identifying the key features of COP trajectories across the whole time-series. The PCA technique has been used to identify unique biomechanical movement strategies in sporting movements within groups of sim-ilar (Donà, Preatoni, Cobelli, Rodano, & Harrison, 2009) and differing (Lynn, Noffal, Wu, & Vandervoort, 2012) ability sportsmen.
Studies by Ball and Best (2007a, 2007b, 2012) used COP to investigate the coaching term “weight trans-fer”. However, strictly COG rather than COP describes how a golfer’s weight is distributed throughout the swing (Jenkins, 2008). The term “weight transfer” is often used by coaches to describe the observed weight under each foot of a golfer and does not serve as a biomechanical description. ML COG movement pat-terns were shown to be similar across all ability right-handed golfers in the backswing of a golf drive (Bur-den, Grimshaw, & Wallace, 1998). During the down-swing, differences in ML COG motion were observed and more linear patterns were associated with im-proved performance yet no direct comparisons were made to COP or measures of performance (Wrobel, Marclay, & Najafi, 2012). Choi, Kang, and Mun (2016) furthered this finding by reporting that COG and COP separation could distinguish between golfing abilities and provided a valuable quantitative measure of a golf-er’s dynamic balance. Nevertheless, the study made no reference to individual golfer differences, analysed COG–COP during three distinct swing phases and also had no measure of performance.
The purpose of this study was to identify and com-pare golfers’ COP and COG movement patterns throughout the golf swing in ML and anterior– posteri-or (AP) directions using PCA and identify relationships with measures of performance. The results could high-light different strategies employed by golfers to achieve
dynamic balance during the golf swing and identify the key features of COP and COG movement patterns re-lated to performance.
Methods
ParticipantsTwenty-two right-handed low-handicap golfers (handicap range + 3 to 4; age = 26 ± 7 years; height 179.5 ± 7.3 cm; mass = 79.4 ± 13.1 kg) were recruited for the study. Golfers were either members of the Univer-sity golf team or professional golfers from local clubs. All golfers gave their informed consent and ethical clearance was obtained from the University Ethical Advisory Committee.
Data collection
Testing took place in an indoor laboratory and three-dimensional marker trajectories were collected using the Vicon Nexus Motion Analysis System (Oxford Met-rics Ltd, UK) sampling at 250 Hz. Sixty-three, 14 mm diameter retro-reflective markers were placed on each golfer at anatomical locations and four markers were placed on the golfer’s own driver (Appendix 1). A piece of reflective tape was placed on the golf ball enabling the instant of impact to be ascertained.
Two force plates (Kistler, 9281CA), one under each foot of the golfer and synchronised with Vicon, collect-ed ground reaction force data at 1000 Hz. Two sections of golf mat, each equal in size to the force plates, were securely attached to the surface of the force plates. Be-fore each trial a calibration procedure was carried out whereby a zero level of force was defined with only the golf mat in contact with the force plate.
Golfers wore their own golf shoes and glove and used the same brand golf ball (Titelist, ProV1). The golfers hit from the golf mat into a net positioned approxi-mately four metres away; a vertical line was placed on the net to provide a target line. The global co-ordinate system (GCS) origin (0, 0, 0) was at ground level in the middle of the capture volume. The positive GCS axes were defined from the origin, with the X-axis parallel to the target line but directed away from the target, the Y-axis directed anteriorly and the Z-axis directed verti-cally upwards. A launch monitor (TrackMan, ISG Company, Denmark) gathered measures of perfor-mance. The launch monitor was positioned three me-tres in the direction of the GCS X-axis away from the ball and was positioned on the target line at the same height as the golf mat. A reflective dot was placed on the golf ball facing towards the launch monitor in ac-cordance with the manufacturer’s instructions.
After each golfer had performed their own warm up, golfers were instructed to address the ball in their normal stance position and to hit a full shot as accu-rately as possible (i.e. towards the target) with their driver. The golfer then performed 10 shots with their driver, with a one minute rest between shots. Follow-ing each shot, the golfer gave a subjective ratFollow-ing of shot
quality on a 10-point scale (1–10) where the highest rat-ing was considered representative of their best shot.
Data analysis
Five trials per golfer were analysed based on the quality of the data and high subjective ratings of shot quality. Marker positions were labelled using Vicon Nexus and further processing, including model build-ing, were performed using Visual3D (C-motion Inc, USA). The golfer model comprised 16 segments (head, 2× upper arm, 2× lower arm, 2× hands, 2× thigh, 2× shank and 2× feet, trunk, pelvis and golf club). Whole body COG, was the estimated weighted sum of individual segments in accordance with Demp-ster’s regression equations and the Hanavan model of the human body (Hanavan, 1964; Robertson, Caldwell, Hamill, Kamen, & Whittlesey, 2014). Whole body COG was projected onto the laboratory floor global horizon-tal plane. The golf club was included in the COG de-termination, as had been done in previous studies of cricket batsmen (Taliep, Galal, & Vaughan, 2007). For modelling purposes, golf club head weight was approx-imated at 0.20 kg and the shaft (including grip) as 0.15 kg which are within ranges stated for average club head and shaft weights in previous studies (Betzler, 2010; Harper, Roberts, & Jones, 2005). The COG loca-tions of the club head and shaft were estimated as mid-way between the club head heel and toe markers and mid-way between grip and hosel markers, respectively.
Force plate co-ordinate systems were transformed in-to the laborain-tory GCS and a global COP was computed from combining both force plates (Exell, Gittoes, Irwin, & Kerwin, 2012). The COP and COG were defined along the X-axis (ML) and Y-axis (AP) of the GCS. In the ML direction, COPML and COGML were defined as a
per-centage of the distance between the X-coordinates of the mid-point of the front (0%) and back (100%) foot at set-up. In the AP direction, COPAP and COGAP were
defined as a percentage distance between the Y-coordinates of the furthest back heel (0%) and furthest forward toe (100%) markers of the front and back foot at set-up. Each swing was temporally aligned between take-away (TA) to top of the backswing (TB), TB to impact (IMP) and IMP to mid-follow through (MidFT) using a piecewise linear length normalisation proce-dure (Helwig, Hong, Hsaio-Wecksler, & Polk, 2011) to 501 normalised time points. The phases of the golf swing were defined using the following threshold func-tions in Visual3D: TA when the X-component of veloci-ty of the clubhead heel marker (i.e. horizontal velociveloci-ty in the GCS X-axis direction) first exceeded 0.2 ms−1; TB
when the X-component of velocity of the clubhead heel marker changed from negative to positive; IMP as the time point immediately preceding the frame where ball positional data changed; MidFT when the club shaft (defined as a vector between a marker on the grip and hosel) was parallel to the GCS X-axis. Between TA and TB there were 410 normalised time points, TB and IMP there were 70 time normalised time points, and IMP and MidFT there were 21 normalised time points.
Statistical analysis
In this study, it was of interest to determine the ex-tent of inter-golfer variation in COP and COG time-series data in ML and AP directions throughout the swing. As such, for each golfer, an n × p data matrix was formed where n was the number of trials (n = 5) and p each normalised time point throughout the swing (p = 501). This was done for each variable (COPML, COGML, COPAP and COGAP).
Matrices for each golfer were then vertically concat-enated to form a single 110 × 501 data matrix represent-ing all the golfers’ data for a given variable. This matrix was used as input to the PCA MATLAB function (MATLAB, The Mathworks, Natick, MA). A maximum number of 109 PCs were computed; however only PCs which cumulatively explained at least 90% of the vari-ance were retained for further analysis (Deluzio & Astephen, 2007; Lynn et al., 2012).
Principle component analysis (PCA) generates a se-ries of principal components (PC1, PC2, and PC3…), each explaining a percentage of the variation in the original data. Each PC is defined by a loading factor, a series of positive or negative values which indicate the magnitude and direction of variation in movement pat-terns relative to the mean data curve at every time in-crement. A loading factor therefore contains the same number of data points as the original data and the larger the loading factor the greater the variability in the data. A loading factor close to zero contributes lit-tle to the PC and indicates that there was litlit-tle differ-ence in the movement patterns at that stage in the swing. PCA also computes a score for each data set, in this case for each trial by every golfer, for each PC. A large positive (+ve) or negative (−ve) PC score indicates a golfer whose data curve for that trial is further away from the mean curve in the portions of the swing that have higher loading factors. The sign of the PC score, in tandem with the sign of the loading factor, dictates the direction of change from the mean curve.
Qualitative biomechanical interpretation of PCs was achieved by examining the loading factors for each PC and observing the mean data curves of COP and COG with plus and minus one standard deviation of PC scores multiplied by the loading factor for each PC (Figures 1–3).
Pearson’s correlation was performed to examine the relationship between COP and COG PC scores in ML and AP directions with significance set at P < .05. The strength of the correlation coefficients (r) were catego-rised as follows: weak (less than 0.4), moderate (0.41 to 0.7) and strong (0.71 to 1) (Dancey & Reidy, 2011).
A stepwise mixed-effects linear regression model (backward elimination) with individual golfer as a ran-dom effect was fitted to clubhead velocity (dependent variable) and standardised PC scores (explanatory vari-ables) to predict whether any of the PCs could explain variation in clubhead velocity.
Results
COP and COG movement patterns
A greater number of PCs were required to explain 90% of the variance in COP parameters (4–5 PCs) compared to COG (2 PCs) parameters (Table I). The biomechanical interpretation of PCs largely related to an offset (i.e. magnitude), timing, rate of change and range in a given parameter (Table I).
Mean curves with plus or minus one standard devia-tion of the PC score multiplied by the loading factor helped interpret the movement patterns of golfers with either positive or negative PC scores for a specific PC (Robertson et al., 2014) (Figures 1 and 2). The mean curves are colour coded according to the loading fac-tors for that PC. The description of golfers with +ve or –ve PC scores are provided in Table I and also graph-ically shown in Figures 1 and 2.
Relationship between COP and COG principal Components
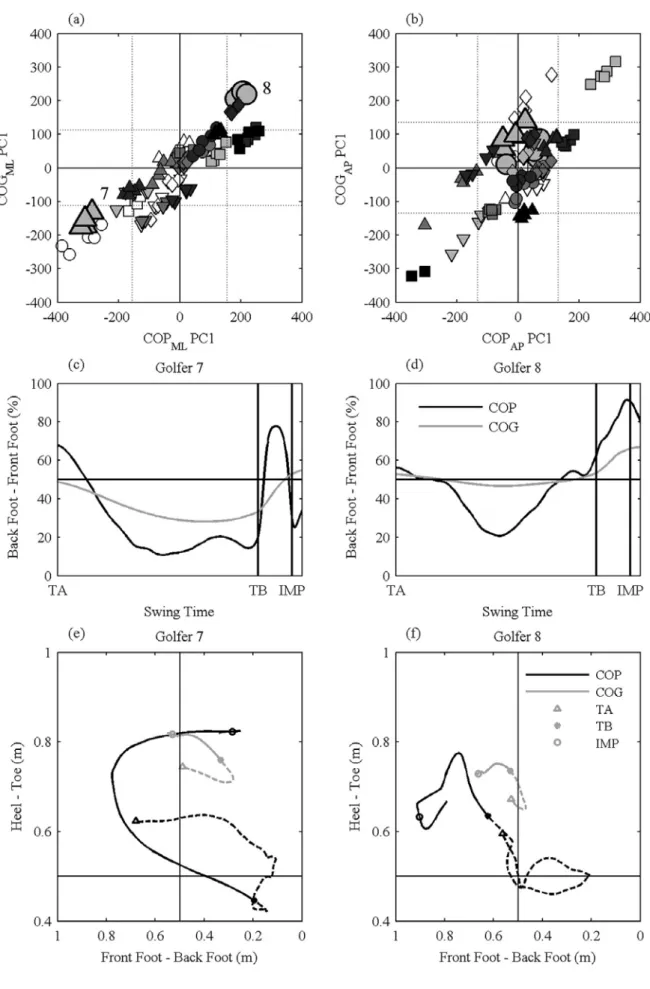
The only two strong correlations were between COGML and COPML PC1 scores (i = 0.92, P < .05) and
COPAP and COGAP PC1 scores (r = 0.81, P < .05) (Figure
3(a) and 3(b)). For brevity only the relationship be-tween COGML and COPML will be presented and is
ex-plored in greater detail in Figure 3(c)–3(f). Golfer 7 and Golfer 8 were chosen to explore the relationship be-tween COGML and COPML PC1 scores as they had
op-posing scores (Figure 3(a)). Golfer 7 had low negative COGML and COPML PC1 scores. The PC score
relation-ship for this golfer showed that in the backswing, there was greater movement of COGML to the back foot
cou-pled with a greater range in COPML to the back foot
whereby COPML moved beyond the COGML position. At
IMP, COGML was closer to mid- stance (∼50%) and
was coupled with a reversal of COPML from front foot
to back foot during the downswing (Figure 3(c) and 3(e)). Golfer 8 had high positive COGML and COPML
PC1 scores. This relationship showed that less move-ment of the COGML towards the back foot was coupled
with less movement of the COPML onto the back foot
and COPML moved beyond COGML. During the
down-swing, the COGML continued to move towards the front
foot and was coupled with greater movement of the COPML ahead of COGML and towards the front foot. Relationship between COP, COG principal components and clubhead velocity
The overall mean clubhead velocity across all golfers, measured by TrackMan, was 45.46 ± 2.54 ms−1. From
the regression analysis of the predictor PCs, three were significant and predicted 74% of the variance in club-head velocity (adjusted r2 = 0.742, P < .001). The most
important predictor of clubhead velocity was COPML
PC3 (β = 0.449, sx− = 0.186, P < .05) and would give the
greatest increase (relative to standard deviation) in clubhead velocity. Golfers whose COP was closer to their back foot in the mid-backswing would have high-er clubhead velocities. The second most important
predictor was COGML PC2 (β = −0.399, sx− = 0.201, P <
.05); however this would decrease clubhead velocity. Hence, golfers with early COG movement towards the front foot before TB would have lower clubhead veloci-ty. Lastly, COPML PC2 (β = 0.323, sx− = 0.156, P < .05)
would increase clubhead velocity (relative to standard deviation). Hence, golfers with early movement of COP to front foot in back- swing would have higher club-head velocity. Neither the PC scores in AP direction nor the PC1 scores in the ML direction appeared to be significant predictors of clubhead velocity.
Discussion
The purpose of this study was to identify and com-pare golfers’ COP and COG movement patterns throughout the golf swing in ML and AP directions using PCA and examine the relationship with measures of performance.
Movement patterns represented by positive and neg-ative COPML PC1 scores resembled the front foot and
reverse foot styles, respectively, reported by Ball and Best (2007a, 2007b). This result confirms the identifica-tion of two extremes of ML COP movement, for a group of similar ability golfers (Figure 3).
Golfers, however, featured on a continuum between these two extremes as can be seen by the spread in PC1 scores on the scatterplot in Figure 3(a) and cannot be categorised clearly into either of these extreme styles. The timing and rate of change in COPML (PC2 and PC3)
in the backswing and down- swing were also key fea-tures of COPML (Table I). Previous studies have found
significant correlations between clubhead velocity and the velocity of COPML at discrete stages in the early
downswing or late backswing (Ball & Best, 2012). The benefits of the PCA approach used in this study are that PCs capture these key features (variances) wher-ever they occur during the swing. These can subse-quently be used to investigate relationships with per-formance measures (such as in clubhead velocity presented herein) or with other kinematic/kinetic v a r i -a b l e s .
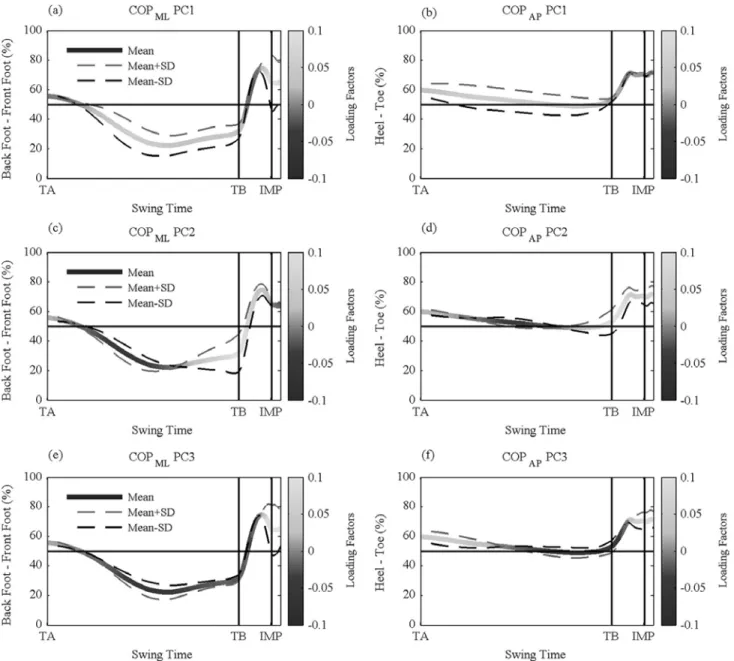
Figure 1. Mean curve (colour graded by PC loading factor) ± one SD of PC scores multiplied by loading factors for COPML and COPAP (a and b), PC1 (c and d), PC2 and (e and f) PC3, respectively. Golfers with PC scores of mean + one SD followed dashed grey line and those with PC scores of mean − one SD followed the dashed black line.
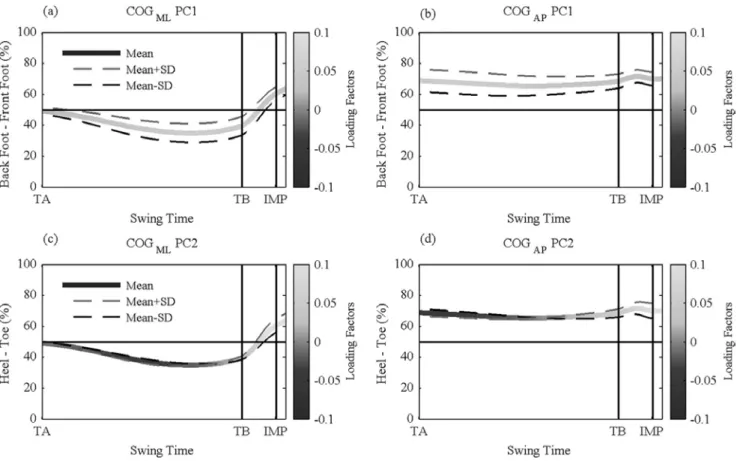
Figure 2. Mean curve (colour graded by PC loading factor) ± one SD of PC scores multiplied by loading factors for COGML and COGAP (a and b) PC1 and (c and d) PC2, respectively. Golfers with PC scores of mean + one SD followed dashed grey line and those with PC scores of mean − one SD followed the dashed black line.
Eighty-four per cent of variance was explained by COGML PC1 and described the position of COG
throughout the swing. The ML COG pattern captured by PC1 is similar to the pattern described by Burden et al. (1998) and the distinguishing difference between high- and low-handicap golfers captured using the methods of Choi et al. (2016). Examining the strong linear relationship (r = 0.92) between COP and COGML
PC1 scores in this study can help to understand this movement pattern further (Figure 3(a)). At TA, COGML
is evenly positioned between front and back foot be-fore moving towards the back foot and as such COP moves beyond the COG position (i.e. closer to the back foot). During the downswing, the COP begins to move ahead of the COG towards the front foot and the ex-treme styles see golfers either align COP and COG at impact (−ve PC1 scores) or COP stays ahead of the COG and both are closer to the front foot (+ve PC1 scores) at IMP. Welch, Banks, Cook, and Draovitch (1995) reported the interaction of ML COP and COG in baseball hitters as a measure of dynamic balance. Baseball hitters who aligned COP and COG evenly be-tween the feet near impact emphasised rotational body movements, whereas hitters with COG and COP
to-wards the front foot emphasised more linear body movement. The rotational movements and alignment of COP and COG were deemed to increase the force couple applied to the pelvis and facilitate pelvis rota-tional acceleration whereas linear movement meant force was only applied through the front foot when striking the baseball (Welch et al., 1995). Given the outcome of a baseball swing is also to strike the ball as far as possible it is interesting to note the similarities between the results of this study and those of Welch et al. (1995). Therefore, it would also be of interest to compare a golfer’s body rotation variables to their COP and COG.
Figure 3. Scatterplot of PC1 scores for (a) COGML and COPML and (b) COPAP and COGAP. Dashed lines represent one SD of the PC scores (c) COP and COG overall movement traces for Golfer 7 and (d) Golfer 8, (e) Golfer 7 ML COP and COG trajectories and (f) Golfer 8 ML COP and COG trajectories.
Table I. Percentage variance explained (%), general biomechanical interpretation of COP and COG principal components (PCs) and positive and negative PC scores in medial-lateral (ML) and anterior-posterior (AP) di-rections throughout the swing. TB = top of the backswing, IMP = impact, TA = takeaway.
Parameter PC %
Biomechanical
Interpretation
Positive PC Score
Negative PC Score
COP
ML1
37.8 Position TA to TB and
rate of change and
direc-tion TB to IMP
Less movement to back foot
between TA to TB. Closer
to front foot at IMP
More movement to back foot
TA to TB. Movement to front
foot near TB, rapid movement
to mid stance before IMP
2
22.5 Timing and position from
TA to TB and rate of
change TB to IMP
Early
movement to back foot
TA to mid-backswing,
movement towards front foot
backswing to
mid-downswing
Late movement to back foot
and rapid movement towards
front foot near TB
3
18.0 Position mid-backswing
and rate of change and
di-rection from
mid-downswing to IMP
Position closer to back foot
mid-backswing. Rapid
movement to front foot TB
to IMP
Position closer to front foot at
mid-backswing, movement to
front foot near TB before
movement to mid stance
be-fore IMP
4
6.8
Range of COP in
back-swing and rate of COP to
front foot before TB
Greater movement towards
back foot mid-way between
TA to TB early movement
to front before TB
Less movement towards back
foot mid-way between TA to
TB late movement to front
before TB
5
5.6
Rate of COP to front foot
before TB and through
IMP
-
-
COP
AP1
46.1 Position between TA to
TB and timing before TB
Position towards heels
be-tween TA to TB. Late
movement towards toes
Position towards toes TA to
TB. Early movement to toes
before TB
2
18.0 Timing and rate of change
towards toes before TB to
IMP
Early and gradual movement
towards toes before TB and
closer to toes at IMP
Late and rapid movement
to-wards toes near TB and closer
to heels at IMP
3
14.8 Timing and rate of change
towards heels from TA to
TB and position at IMP
Greater movement from toes
to heels in backswing and
closer to toes at IMP
Stable position until near TB
and less shift towards toes at
IMP
4
11.4 Position in backswing and
rate of change towards
toes before IMP
-
-
COG
ML1
83.8 Position throughout swing Less movement towards
back foot in backswing and
closer to front foot at IMP
More movement towards
back foot in backswing and
closer to mid-stance at IMP
2
10.4 Timing towards front foot
before TB and position
between TB to IMP
Early movement to front foot
before TB and closer to front
foot at IMP
Late movement
to front foot
after TB and closer to mid
foot at IMP
COG
AP1
83.5 Position throughout swing Nearer toes. In downswing,
shifted slightly towards heels
before movement to toes
Further towards heels. In
downswing, shifted slightly
towards heels before
move-ment to toes
2
12.1 Timing of movement
be-tween TA and TB and
po-sition between TB - IMP
COG
APpositioned towards
toes mid-backswing and near
toes between TB and IMP
COG
APpositioned towards
heels mid-backswing and
closer to mid foot between
TB and IMP
Original article published in European Journal of Sport Science, 2016, DOI: 10.1080/17461391.2016.1240238
Golfers typically positioned COPAP closer to the toes
at TA (∼60%) before a slight shift to the heels in the backswing, moving towards the toes in the downswing and remaining relatively stable through IMP (Figure 1(b)). The movement pattern varied in magnitude in the backswing (PC1), timing of COPAP movement before TB
(PC2) and range of COPAP movement in the late
back-swing to early downback-swing (PC3). Lynn et al. (2012) re-ported similar timings of peak vertical and peak poste-rior force in early downswing differentiated high- and low-skilled golfers and was thought to help create a force couple to facilitate body rotation. Whilst the measures used in this study are not directly comparable to Lynn et al.’s (2012) study, there is evidence to support that the timing of AP COP (PC2 scores) can also distin-guish between golfers of similar ability and hence may be used to identify strengths or weaknesses in golfers movement patterns. In the downswing, there was a small shift in COGAP movement which varied in
magni-tude (PC1 and PC2) (Figure 2(b) and 2(d)). This COG movement may indicate a golfer’s ability to react to the high forces of the club (radial and centripetal) before impact (Hellström, 2009) and PC scores could identify golfers who can reasonably do this. The relationship between AP COP and COG PC1 (r = 0.81) scores shows that the small shift in COGAP during the downswing
(Figure 2(b)) coincides with a relatively stable period in COPAP (Figure 1(b)). This relationship may further
sug-gest that at this swing instance, the greatest require-ment is to resist the large club forces rather than gener-ate forces to cregener-ate body rotation.
From regression analysis, 74% of clubhead velocity was explained by three PCs. The range in COPML in the
backswing and rate of change in COPML in the
down-swing (PC3) were the greatest predictors of clubhead velocity. Ball and Best (2012) found that a larger medi-olateral COP velocity at early downswing was an im-portant predictor of clubhead velocity for some golfers. The results of this study would support the coaching notion that increasing the rate of COPML towards the
front foot during early downswing could increase club-head velocity (Jenkins, 2008). A more positive COPML
PC2 score (i.e. early movement of COP to front foot in backswing) was positively related to clubhead velocity. This finding is similar to Lynn et al.’s (2012) PCA results where they observed early unloading of vertical force under the back foot in the backswing of highly skilled golfers. The authors concluded that early movement of vertical force onto the front foot was more effective in allowing the sequence of body rotations. Conversely, early COG movement towards the front foot (+ve COGML PC2) was found to decrease clubhead velocity.
This finding could relate to Lynn et al.’s (2012) study that found the timing and direction of ground reaction forces was a key feature of highly skilled golfers. Force couples that encourage too early lateral movement of COG could hinder generation of clubhead velocity. Whilst there is a strong relationship between COP and COG PC1 scores neither were significant predictors of
clubhead velocity. Interestingly Golfer 7 and Golfer 8, with opposing PC1 scores, had similar average clubhead velocity (49.6 ± 0.5 ms−1 and 48.4 ± 0.6 ms−1,
respec-tively) and were both approximately 3 ms−1 quicker
than the overall average across all golfers. Similarly, AP PCs were also not related to clubhead velocity. As coaches also stated that dynamic balance could affect accuracy (Smith et al., 2015), future studies should in-vestigate the relationship between COP and COG PCs and other measures of performance related to shot ac-curacy.
In conclusion, this study used PCA and showed the greatest variation in COP movement patterns in ML and AP directions was related to magnitude, timing and rate of change throughout the golf swing. The golfers’ COG movement patterns were relatively similar in shape and typically differed in magnitude or timing of movement. The relationship between COPML and
COGML PC1 scores identified different extremes of COP
and COG movement in golfers and could be an indica-tion of how golfers achieve dynamic balance either with more lateral or rotational movement. Golfers displaying early movement of ML COP to the front foot in the backswing (PC2) or greater range and rate of movement to the front foot in the downswing (PC3) were more likely to have higher clubhead velocity. Golfers that moved their COG towards the front foot earlier in the backswing, however, were more likely to have lower clubhead velocity. Future studies using PCA should in-vestigate the relationships between these PCs, golfer kinematic variables and other measures of performance.
References
Ball, K., & Best, R. (2007a). Different centre of pressure pat-terns within the golf stroke I: Cluster analysis. Journal of Sports Sciences, 25(7), 757–770. Retrieved from http://www.ncbi.nlm. nih.gov/pubmed/17454544
Ball, K., & Best, R. (2007b). Different centre of pressure patterns within the golf stroke II: Group-based analysis. Jour-nal of Sports Sciences, 25(7), 771–779. Retrieved from http://www.ncbi.nlm. nih.gov/pubmed/17454545
Ball, K., & Best, R. (2012). Centre of pressure patterns in the golf swing: Individual-based analysis. Sports Biomechanics,
11(2), 175–189. Retrieved from http://www.ncbi.nlm.nih.gov/ pubmed/22900399
Barrentine, S., Fleisig, G., & Johnson, H. (1994). Ground re-action forces and torques of professional and amateur golfers. Pa-per pre- sented at the meeting of World Scientific Congress of Golf, Scotland.
Betzler, N. (2010). The effect of differing shaft dynamics on the biome- chanics of the golf swing (Unpublsihed doctoral disser-tation). University of Ulster, N.Ireland.
Burden, A., Grimshaw, P., & Wallace, E. (1998). Hip and shoulder rotations during the golf swing of sub-10 handicap players. Journal of Sports Sciences, 16(2), 165–176. Retrieved from http://www.ncbi.nlm.nih.gov/pubmed/9531005
Caron, O., Gelat, T., Rougier, P., & Blanch, T.-P. (2000). A com- parative analysis of centre of grvaity and centre of pres-sure tra- jectory path lengths in standing posture: An estima-tion of active stiffness. Journal of Applied Biomechanics, 16,
234–247. Retrieved from
http://www.ncbi.nlm.nih.gov/pubmed/ 11757569
Choi, A., Kang, T., & Mun, J. (2016). Biomechanical evalua-tion of dynamic balance control ability during golf swing.
Journal of Medical and Biological Engineering, 36, 430–439. Re-trieved from http://link.springer.com/article/10.1007/s40846-016-0141-0
Dancey, C., & Reidy, J. (2011). Statistics without maths for psy-chology (5th ed.). London: Prentice Hall.
Deluzio, K. J., & Astephen, J. L. (2007). Biomechanical fea-tures of gait waveform data associated with knee osteoarthri-tis: An application of principal component analysis. Gait &
Posture, 25(1), 86–93. Retrieved from
http://www.ncbi.nlm.nih.gov/pubmed/ 16567093
Donà, G., Preatoni, E., Cobelli, C., Rodano, R., & Harrison, A. J. (2009). Application of functional principal component analysis in race walking: An emerging methodology. Sports
Biomechanics, 8(4), 284–301. Retrieved from
http://www.ncbi.nlm.nih.gov/ pubmed/20169759
Exell, T., Gittoes, M. J. R., Irwin, G., & Kerwin, D. G. (2012). Considerations of force plate transitions on centre of pressure calculation for maximal velocity sprint running. Sports Biomechanics, 11(4), 532–541. Retrieved from http://www.ncbi. nlm.nih.gov/pubmed/23259242.
Hanavan, E. (1964). A mathematical model of the human body
(AMRL-TR-64-102, AD-608-463). Aerospace Medical Re-search Laboratories.
Harper, T. E., Roberts, J. R., & Jones, R. (2005). Driver swing weighting: A worthwhile process? Proceedings of the Institution of Mechanical Engineers, Part B: Journal of Engineer-ing Manufacture, 219(5), 385–393. Retrieved from http://pib. sagepub.com/lookup/doi/10.1243/095440505X32247
Hellström, J. (2009). Competitive elite golf: A review of the relationships between playing results, technique and phy-sique. Sports Medicine, 39(9), 723–741. Retrieved from http://www. ncbi.nlm.nih.gov/pubmed/19691363
Helwig, N. E., Hong, S., Hsaio-Wecksler, E. T., & Polk, J. D. (2011). Methods to temporally align gait cycle data. Journal of Bio-mechanics, 44(3), 561–566. Retrieved from http://www. ncbi.nlm.nih.gov/pubmed/20887992
Hsue, B., Miller, F., & Su, F.-C. (2009). The dynamic balance of the children with cerebral palsy and typical developing during gait. Part I: Spatial relationship between COM and COP trajec- tories.
Gait & Posture, 29, 465–470. Retrieved from http://www. ncbi.nlm.nih.gov/pubmed/19111469
Jenkins, S. (2008). Weight transfer, golf swing theory and coaching. International Journal of Sports Science and Coaching, 3, 29–51.
Lynn, S. K., Noffal, G. J., Wu, W., & Vandervoort, A. A. (2012). Using principal components analysis to determine differences in 3D loading patterns between beginner and collegiate level golfers.
Journal of Golf Science, 25–41. Retrieved from
http://www.humankinetics.com/acucustom/sitename/Docume
nts/ DocumentItem/04_lynn_IJGS_05_25-41.pdf
Robertson, G., Caldwell, G., Hamill, J., Kamen, G., Whittlesey, S. (2014). Research methods in biomechanics (2nd ed.). Champaign, IL: Human Kinetics.
Smith, A., Roberts, J., Wallace, E., Wah Kong, P., & Forrester, S. (2015). Golf coaches’ perceptions of the key technical swing parameters compared to biomechanical literature. International Journal of Sports Science and Coaching, 10(4), 739–755.
Taliep, M. S., Galal, U., & Vaughan, C. L. (2007). The position of the head and centre of mass during the front foot off-drive in skilled and less-skilled cricket batsmen. Sports Biomechanics, 6
(3), 345–360. Retrieved from http://www.ncbi.nlm.nih.gov/ pubmed/17933197
Wallace, E., Grimshaw, P., & Ashford, R. (1994, July). Discrete pressure profiles of the feet and weight transfer patterns during the golf swing. Paper presented at the meeting of World Scientific Con-gress of Golf, Scotland.
Welch, C. M., Banks, S., Cook, F. F., & Draovitch, P. (1995). Hitting a baseball: A biomechanical description. The Journal of Orthopaedic and Sports Physical Therapy, 22(5), 193–201. Re-trieved from http://www.ncbi.nlm.nih.gov/pubmed/8580946 Winter, D. (1995). Human balance and posture control during standing and walking. Gait & Posture, 3(4), 193–214. doi:10.1016/0966-6362(96)82849-9
Wrobel, J., Marclay, S., & Najafi, B. (2012). Golfing skill level pos- tural control differences: A brief report. Journal of Sports Science and Medicine, 11(3), 452–458. Retrieved from http://www.ncbi. nlm.nih.gov/pmc/articles/PMC3737932/
Original article published in European Journal of Sport Science, 2016, DOI: 10.1080/17461391.2016.1240238
Appendix 1
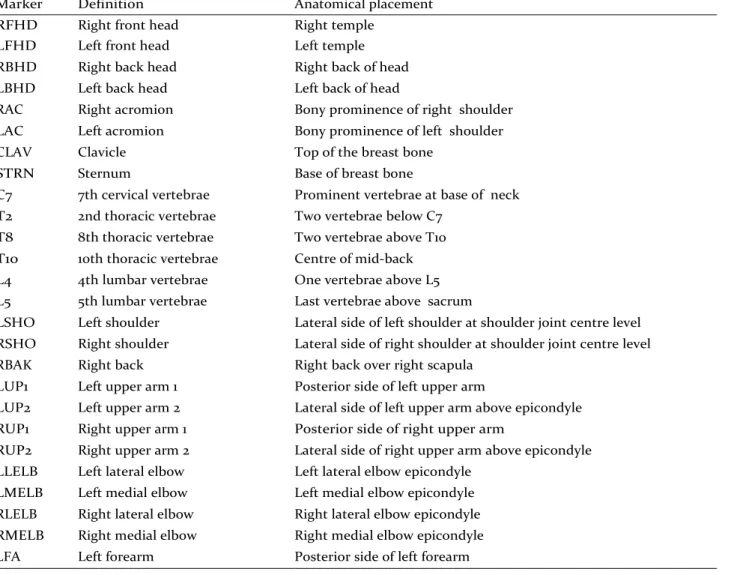
Table AI. Golfer marker set including marker names, definitions and anatomical placements.
Marker Definition Anatomical placement
RFHD Right front head Right temple
LFHD Left front head Left temple
RBHD Right back head Right back of head
LBHD Left back head Left back of head
RAC Right acromion Bony prominence of right shoulder
LAC Left acromion Bony prominence of left shoulder
CLAV Clavicle Top of the breast bone
STRN Sternum Base of breast bone
C7 7th cervical vertebrae Prominent vertebrae at base of neck T2 2nd thoracic vertebrae Two vertebrae below C7
T8 8th thoracic vertebrae Two vertebrae above T10 T10 10th thoracic vertebrae Centre of mid-back
L4 4th lumbar vertebrae One vertebrae above L5
L5 5th lumbar vertebrae Last vertebrae above sacrum
LSHO Left shoulder Lateral side of left shoulder at shoulder joint centre level RSHO Right shoulder Lateral side of right shoulder at shoulder joint centre level
RBAK Right back Right back over right scapula
LUP1 Left upper arm 1 Posterior side of left upper arm
LUP2 Left upper arm 2 Lateral side of left upper arm above epicondyle RUP1 Right upper arm 1 Posterior side of right upper arm
RUP2 Right upper arm 2 Lateral side of right upper arm above epicondyle LLELB Left lateral elbow Left lateral elbow epicondyle
LMELB Left medial elbow Left medial elbow epicondyle RLELB Right lateral elbow Right lateral elbow epicondyle RMELB Right medial elbow Right medial elbow epicondyle
RFA Right forearm Posterior side of right forearm
LRAD Left radius Left radial epicondyle
RRAD Right radius Right radial epicondyle
LULN Left ulna Left ulna epicondyle
RULN Right ulna Right ulna epicondyle
LHA Left hand Dorsum of left hand below head of 2nd metacarpal
RHA Right hand Dorsum of right hand below head of 2nd metacarpal
LASIS Left anterior superior illiac spine Bony prominence of the left anterior superior iliac RASIS Right anterior superior illiac spine Bony prominence of the right anterior superior iliac LPSIS Left posterior superior iliac spine Bony prominence of the left posterior superior iliac RPSIS Right posterior superior iliac spine Bony prominence of the right posterior iliac
LTH1 Left thigh 1 Lateral side of left thigh ≈0.1m under greater trochanter
LTH2 Left thigh 2 Medial side of left thigh between vastus medialis and rectus femoris
LTH3 Left thigh 3 Left vastus lateralis tendon
RTH1 Right thigh 1 Lateral side of right thigh ≈0.1m under greater trochanter
RTH2 Right thigh 2 Medial side of right thigh between vastus medialis and rectus femoris
RTH3 Right thigh 3 Right vastus lateralis tendon
LLK Left lateral knee Left lateral knee epicondyle
RLK Right lateral knee Right lateral knee epicondyle
LMK Left medial knee Left medial knee epicondyle
RMK Right medial knee Right medial knee epicondyle
LSK1 Left shank 1 Lateral side of left shank
LSK2 Left shank 2 Lateral side of left shank
LSK3 Left shank 3 Lateral side of left shank
LSK4 Left shank 4 Lateral side of left shank
RSK1 Right shank 1 Lateral side of right shank
RSK2 Right shank 2 Anterior side of right shank
RSK3 Right shank 1 Lateral side of right shank
RSK4 Right shank 1 Lateral side of right shank
LLA Left lateral ankle Left lateral malleolus
LMA Left medial ankle Left medial malleolus
RLA Right lateral ankle Right lateral malleolus
RMA Right medial ankle Right medial malleolus
LTOE Left toe Dorsum of left foot below 2nd metatarsal
RTOE Right toe Dorsum of right foot below 2nd metatarsal
RHEEL Right heel Posterior side of right heel