1
AgWater Solutions Project
Case Study
Accelerating Adoption of Drip Irrigation in
Madhya Pradesh, India
Ravinder P. S. Malik IWMI New Delhi, India M.S.Rathore
Centre for Environment and Development Studies, Jaipur, India
i Acknowledgment
The authors and project partners wish to thank the Bill & Melinda Gates Foundation for the generous grant that made this project possible.
The AWM Project
The AgWater Solutions project was implemented in five countries in Africa and two states in India between 2008 and 2012. The objective of the project was to identify investment options and opportunities in agricultural water management with the greatest potential to improve incomes and food security for poor farmers, and to develop tools and recommendations for stakeholders in the sector including policymakers, investors, NGOs and small-scale farmers.
The leading implementing institutions were the International Water Management Institute (IWMI), the Stockholm Environment Institute (SEI), the Food and Agriculture Organization of the United Nations (FAO), the International Food Policy Research Institute (IFPRI), International Development Enterprises (iDE) and CH2MHill.
For more information on the project or detailed reports please visit the project website http://awm-solutions.iwmi.org/home-page.aspx.
Disclaimers
This report is based on research funded by the Bill & Melinda Gates Foundation. The findings and conclusions contained within are those of the authors and do not necessarily reflect positions or policies of the project, its partners or the Bill & Melinda Gates Foundation.
Copyright © 2012, by IWMI. All rights reserved. IWMI encourages the use of its material provided that the organization is acknowledged and kept informed in all such instances.
ii
Contents
EXECUTIVE SUMMARY ... 1
1. RATIONALE AND SCOPE ... 4
1.1 Methodology ... 5
2. THE DRIP IRRIGATION TECHNOLOGY IN INDIA: SETTING, GROWTH AND POTENTIAL ... 6
2.1 Drip Irrigation in India: current status and potential application ... 7
2.1.1 Potential area that can be brought under micro irrigation ... 8
2.2 Impact of drip irrigation ... 10
2.3 Factors constraining uptake of drip irrigation by farmers ... 12
3. DRIP IRRIGATION IN MADHYA PRADESH: A STATUS REPORT ... 13
3.1 Market development for drip irrigation in Madhya Pradesh ... 14
4. SUBSIDIES FOR DRIP IRRIGATION TECHNOLOGY ... 15
4.1 Rationale ... 15
4.2 Evolution of subsidy program for drip ... 16
4.3 Current status of subsidies on micro irrigation in India ... 17
4.4 Subsidy on drip in Madhya Pradesh ... 19
4.5 Subsidy disbursal ... 20
4.6 Extent of subsidy available and uptake of drip technology ... 22
4.7 Availability of subsidy and uptake of drip ... 24
4.8 Towards an alternative model of subsidy delivery ... 28
4.8.1 An alternative model for subsidy delivery ... 29
4.9 Subsidy Regime and Development of Low Cost “Innovative Drip” Technologies ... 32
5. Summing Up ... 33
Appendix 1. District percent of beneficiaries using drip irrigation. ... 34
Appendix 2. Process for implementation of micro irrigation scheme ... 35
REFERENCES ... 38
1
EXECUTIVE SUMMARY
Rising demand for irrigation water in the face of its inefficient use amid concerns of growing water scarcity has brought into renewed focus the need for conserving water and improving water use efficiency. Given the difficulties and political considerations associated with bringing about effective policy reforms to achieve the objective of water conservation, the emphasis has generally focused on technological solutions. Micro irrigation technologies such as those based on drip and sprinkler systems are being increasingly propagated as ideal technological solutions for achieving water conservation. Of the two technologies, drip irrigation, in its various forms, has been a relatively more important mode of micro irrigation in India. Despite the numerous advantages and water saving potential drip technology offers, it has failed to capture the kind of market that would have been expected of such a technology. The present study attempts to enquire into some of the possible reasons for the slow uptake of this otherwise high potential water conserving technology and suggest interventions that could contribute towards accelerating the pace of adoption. Given that the main driver for the promotion of drip irrigation in India has been the provision of financial subsidies by the government, the study specifically assesses the efficacy of subsidies in promoting uptake of drip. While the present case study focuses primarily on the Indian state of Madhya Pradesh, the evidence drawn upon and the conclusions drawn from the study will have general applicability for other regions of the country.
Manufacturers and market estimates suggest that more than 95% of the drip sales in Madhya Pradesh are subsidy linked. Given that a substantial government subsidy to the tune of 70 to 80% of the capital cost of the system is available for purchase of a drip system, it is only natural that few farmers want to invest in a drip irrigation system without the subsidy.
The link between uptake of drip systems to the availability of the subsidy has stifled both the inertia of aggressive marketing strategies on the part of the manufacturers to promote sales of unsubsidized systems, and any attempts at bringing down the manufactured cost of drip systems through product designs or technological innovations. All efforts of manufacturers, dealers and other stakeholders are focused on making the most of the available government subsidy through sale of their products. The system has thus made manufacturers subservient to government favours and has led to a loss of their enterprise spirit. Similarly, the insistence on the drip products to carry the BIS mark as a seal of guarantee, and more so as a pre- condition for qualifying to become eligible for a government subsidy on drip, has led to adoption of unfair business practices.
Our assessment of the prevailing subsidy regime of the government together with the procedures set and manner in which subsidy disbursal takes place, suggest a strong connection between manufacturers and government departments entrusted with the administration of the subsidy program. The subsidy as currently administered is actually going to the manufacturers who claim it in the name of the farmers. The business model followed by companies is governed more by the state subsidy system and companies operate more like a cartel to benefit from the subsidy provisions of the program. Producers
2
and the chain of sellers involved in marketing micro irrigation technology emphasize building contacts with government officials at different levels to get their maximum share of the subsidy kitty. At the farm level, the aim is to convince the farmer that he/she would get a high cost product without having to pay the full amount. Rather than emphasizing the benefits that the farmer might get from use of the technology or details about maintenance, the focus is entirely on getting the necessary papers prepared for release of the subsidy amount. Even the decision about the choice of product and the company is determined by the agent who succeeds in approaching the farmer and getting his papers cleared. The farmer is often a passive participant in the entire process. The presence of a number of companies leads to competition among firms producing equipment and services of varying quality. The subsidy system is also responsible for unhealthy competition. Generally in any business, revenue is generated by the companies through sales and support, the cost structure of the product, and targeted profit. But in case of micro irrigation systems, the adoption of high cost drip equipment is directly related to the provision of subsidies.
Given the strong connection that has developed over time between different players involved in disbursing and receiving the available drip subsidies, in shaping the subsidy delivery system of the government to their advantage and indirectly constraining the spread of drip irrigation technology, one often wonders is the government, by providing subsidies, trying to promote a specific drip system kit or the concept of drip system in general? Why should eligibility conditions for a subsidy bind a farmer to a specific drip system configuration and not let a farmer choose components which in his view could serve the same purpose but at a somewhat lower cost without the use of all the pre-specified components? Is there a way to use the available government subsidies to achieve the goals they are intended to achieve? We propose that if the government were to dispense completely with the existing mechanism of subsidy delivery to the manufacturer and intermediary and arrange to make direct delivery of the drip subsidy to the beneficiary farmers themselves, the market prices and uptake of drip may change considerably.
Based on feedback from stakeholders, we postulate that if the subsidies on drip in its present form were to be withdrawn by the government, it is likely that the open market unsubsidized prices of manufactured drip systems will fall by at least 40 %. Increased open market competition may reduce further the cost of a system by another 5-10 %. The net result is a likely reduction in prices of manufactured drip systems by about 50%. This perception is shared by almost all the market players including some of the leading manufacturers and sellers of drip systems. This is also evidenced by the open market prices of drip systems being sold by the manufacturers and assemblers of non-BIS drip systems in the study region, although there may be some differences in the quality of equipment and performance between the two types of drip systems.
We propose an alternative subsidy delivery model. Rather than giving a one-time capital cost subsidy for investing in a drip system, the government gives an interest cost subsidy to farmers willing to invest in a drip system. Under the proposed scheme the government gives interest free loans for the entire cost of a drip system to all farmers large or small, who belong to a Scheduled Caste or Scheduled Tribe category and are willing to buy a drip system. These loans can be administered through the existing financial institutions in rural areas. The government provides interest free loans with capital repayable after five years.
3
The farmer is free to a buy drip system from any dealer or manufacturer, choose any configuration, and negotiate a price and after sales service conditions with the dealer. The farmer does not need to visit government offices to obtain approval, clearances or no-objection certificates before buying a system. The government plays its facilitative and regulatory role in ensuring that only good quality products are sold in the market and farmers are not cheated by manufacturers.
With a given amount of funds available, the proposed model can provide subsidies to a much larger number of farmers, can bring a much larger area under drip irrigation resulting in lower subsidy outgo per hectare of drip irrigated area, incentivise farmers to invest in drip systems, lower the cost of subsidy outgo, be more transparent, less prone to corruption, easy to manage and govern, less prone to interference and the whims and fancies of officials, and lead to more efficient use of available subsidy, without distorting the market for sales of drip systems. The proposed subsidy scheme of direct delivery of drip subsidy to farmers outweighs the existing subsidy scheme of subsidizing the manufacturers and providers of drip systems in the name of the farmers.
4
1.
RATIONALE AND SCOPE
Rising demand for irrigation water amid concerns of growing water scarcity has brought into renewed focus the need for improving water use efficiency and raising crop water productivity. Great emphasis is being made on achieving water conservation through various demand side management interventions encompassing technological options and policy measures. Given the difficulties and political concerns associated with bringing about effective policy reforms to achieve the objective of water conservation, this emphasis has generally focused on technological solutions backed by soft policy interventions to aid and facilitate adoption of technological solutions by farmers.
Micro irrigation technologies such drip and sprinkler systems are being increasingly promoted as technological solutions for achieving water conservation. Of the two technologies, drip irrigation, in its various forms, has been a relatively more important mode of micro irrigation in India. Enough empirical evidence is available from different parts of the country to suggest that drip technology saves water and is cost effective and has significant economic and social benefits. Drip irrigation saves water and electricity for pumping water, uses less labour and leads to higher crop productivity (Palanisami et al., 2012; Narayanamoorthy, 2009, 2004; INCID, 1994). In addition to these direct benefits, adoption of drip technology generates both positive and negative externalities (Dhawan, 2000). The positive externalities include reduction in well failure rates, reduction in the cost of deepening existing wells and cost of drilling new wells, and increased availability of irrigation water (Kumar et al., 2008). The negative externalities include reduction in labour employment due to shifts in cropping patterns (Dhawan, 2000).
Despite its apparent advantages, the technology has not found widespread favour with farmers and adoption rates continue to remain abysmally low. While an important factor constraining widespread adoption of drip technology has been its high cost, there are several technological, socio-economic and policy related factors which have also contributed to slow adoption by the farmers. Most common drip irrigation systems are designed to serve large areas and cannot be adjusted for use on small plots cultivated by the large majority of farmers. Lack of awareness about the benefits of the technology, the lack of extension support, poor after sales service, clogging of drippers, problems associated in using this technology, absence of institutional and credit support, lack of standardisation of the technology for use with different crops, and lack of good quality water have contributed to slow adoption. In addition, prevailing irrigation pricing policies, especially related to pricing of surface water for irrigation and electricity for groundwater pumping, have dissuaded adoption by the farmers. There is an impression that except in over-extracted groundwater areas, farmers in other regions do not see minor irrigation technologies as a technology of immediate need (Palanisami et al., 2012).
Of the various factors constraining widespread adoption, one of the most important factors has been its high cost. These water conserving irrigation technologies do not come without a price. They are expensive and require clean water to prevent clogging of delivery tubes.To partially offset the high capital cost and to encourage farmers to invest, the government in
5
India has been providing substantial financial incentives in the form of capital cost subsidies1 to farmers willing to invest. Despite the economic, financial, yield enhancing and water conserving advantages of drip technology, availability of substantial government incentives to encourage farmers invest, a favourable benefit-cost ratio of investment, and a short payback period, the uptake of this technology by farmers has been rather sluggish and far lower than its potential2.
To address the cost and some of the technological issues constraining adoption of drip technology by smallholder farmers, the International Development Enterprise (IDE) promoted low cost solutions to drip through affordable micro irrigation technologies (AMITs) suitable for even small parcels of land. The IDE claims to have successfully marketed this technology to a large number of farmers in several regions of the country without a government subsidy through donor supported programs. Available evidence shows that the adoption of even this low cost technology has also been much lower than the potential. The technology has failed to capture the kind of market that would have been expected given the significantly lower financial requirements in comparison with modern drip irrigation systems.
The present study enquires into the reasons for the slow uptake of this otherwise high potential water conserving technology and suggests some interventions that could contribute towards accelerating the pace of adoption. Given that the main driver for the promotion of drip irrigation in India has been the provision of financial subsidies from the government, the study assesses the efficacy of the subsidy instrument in promoting uptake. While the present case study focuses primarily on the Indian state of Madhya Pradesh, the evidence and the conclusions will have general applicability for other regions of the country.
1.1 Methodology
The study is based on extensive interviews with manufacturers, sellers, retailers and promoters such as NGOs and extension agencies of both high end and low cost drip technology in two selected regions of Madhya Pradesh. Officials of Madhya Pradesh Horticulture Department responsible for administering the subsidy program were interviewed. Individual farmers and farmer groups of adopters were interviewed to ascertain their experiences. The field survey was conducted in three locations,: Sagar, Dhar, and Indore districts of Madhya Pradesh. A total of 40 farmers (22 from Sagar, 10 from Dhar and 8 from Indore) were interviewed in addition to dealers and government officials in the districts. Identifying villages and farmers was not easy as the number of drip users are a few and spread over a wide area, hence, they were selected purposively depending on ease of operation and level of cooperation.
1
Some of the available studies demonstrate that the investment in drip technology remains cost effective and financially viable even without government subsidy (Narayanamoorthy, 2012).
2
Palinisami (2011) also notes that although the returns are high under minor irrigation (MI), farmers are reluctant to expand due to constraints like high initial capital cost, lack of technical knowledge and type of crops grown.
6
2.
THE DRIP IRRIGATION TECHNOLOGY IN INDIA: SETTING, GROWTH AND
POTENTIAL
Farmers in India generally practice flood irrigation resulting in low water application and use efficiency. The estimated surface irrigation water use efficiency in India is 35-40 %. With deteriorating surface water infrastructure and rapid declines in groundwater tables in large parts of the country, and in the face of increasing demand for water from all sectors of the economy, there is a widespread concern for using the available water more efficiently. Micro irrigation systems, comprised of drip and sprinkler technologies, have emerged as an effective tool for water conservation and improving water use efficiency. While drip irrigation is ideally suited for horticulture crops such as pomegranates, grapes, mangoes, bananas, guava, coconuts, amla, and cash crops such as sugarcane, it is being used for cultivation of other crops as well. Sprinklers are generally useful in undulating land planted with cereal crops. Despite substantial efforts in promoting demand side management technologies, in practice, drip and sprinkler technologies have been slow to be accepted by farmers. Of the two, drip irrigation is the more preferred technology.
Drip irrigation is an irrigation method which enables saving water by allowing water to drip slowly to the roots of plants, either on the soil surface or directly into the root zone. Drip irrigation methods range from simple bucket kit systems for small farms to automated systems linking release of water to soil moisture conditions measured continuously by tensiometers. Drip Irrigation technologies can be categorized into two groups based on their technical, economic and social attributes. These are low cost drip irrigation technologies and pressurised systems. The low cost drip irrigation technologies include the “pepsee3,” easy drip, various kinds of affordable drip irrigation systems designed by IDE, and micro tube drip systems.
While drip technology in various forms has been in use since ancient times, it is only with the advent of modern plastics that major improvements have become possible. Water in a modern day drip system is delivered through a network of valves, pipes, tubes and emitters. Most large drip irrigation systems also employ some type of screen filters to prevent clogging of the emitter flow path by small waterborne particles. These modern drip systems also permit delivery of liquid fertilizers and other nutrients along with the water in a process known as fertigation. Fertigation and chemigation use chemical injectors such as piston pumps or venturi pumps. Fertilizer savings of up to 95% have been reported from some of the recent field tests using drip fertigation and slow water delivery as compared to timed-release and irrigation by micro spray heads (http://en.wikipedia.org/wiki/Drip_irrigation). Drip systems have been shown to achieve up to 95% water use efficiency. In addition to conserving water and fertilizers, drip irrigation can also help reduce the problems of salinization and water logging.In water scarce environments, drip irrigation may allow for agriculture in areas where furrow or flood irrigation would not be possible.
3
7
2.1 Drip Irrigation in India: current status and potential application
It is now possible to use drip and sprinkler irrigation to a wide variety of crops. Various estimates of potential and actual area4 under micro irrigation technologies have been made available by different researchers and institutions.
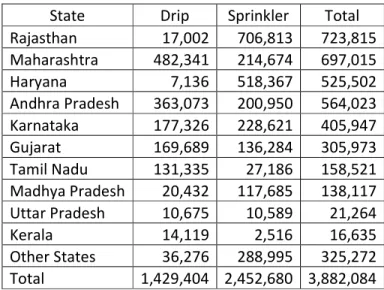
The use of drip irrigation in India, starting from initial testing at Tamil Nadu Agricultural University in Coimbatore in 1970, increased rapidly to 55,000 hectares by 1992 (Pollock and Sivanapan, 1998) ). The technology in India was introduced on a commercial scale only during the Eighth Five Year Plan (1993-98). Of the 69 MH net irrigated area in the country, only 0.5 MH had been brought under drip and 0.7 MH under sprinkler irrigation by 2003 (GOI, 2004). By the end of October 2008, the area under micro irrigation had risen to 3.88 MH, of which about 1.43 million (37%) was under drip and the remaining 2.45 million (63%) under sprinkler irrigation (Table 1). The task force on micro irrigation set up by Government of India had suggested a target of 17 MH to be brought under micro irrigation by 2012, of 12 MH would be under drip and 5 MH under sprinkler (GOI, 2004). The task force had hoped that this entire potential area would be under micro irrigation by 2030. Going by the progress made so far, these targets appear to be highly optimistic and nearly impossible to achieve.
Table 1. Selected area covered (in hectares) under micro irrigation as at 31 October, 2008
State Drip Sprinkler Total
Rajasthan 17,002 706,813 723,815 Maharashtra 482,341 214,674 697,015 Haryana 7,136 518,367 525,502 Andhra Pradesh 363,073 200,950 564,023 Karnataka 177,326 228,621 405,947 Gujarat 169,689 136,284 305,973 Tamil Nadu 131,335 27,186 158,521 Madhya Pradesh 20,432 117,685 138,117 Uttar Pradesh 10,675 10,589 21,264 Kerala 14,119 2,516 16,635 Other States 36,276 288,995 325,272 Total 1,429,404 2,452,680 3,882,084 Source: Indiastat.com 4
There is no systematic data collection and reporting of area brought under micro irrigation technologies in India.
8 Figure 1. Percent drip area by state
Of the total area under drip irrigation in the country, almost 34% is in Maharashtra and 25% in Andhra Pradesh (Figure 1). Karnataka, Tamil Nadu, and Gujarat Pradesh are the other important states in the country for drip irrigation accounting respectively for 12, 9 and 12 per cent of the drip irrigated area in the country. Madhya Pradesh accounts for just 1 percent of the country’s drip area.
2.1.1 Potential area that can be brought under micro irrigation
There are essentially two sets of estimates available on the potential area that can be brought under micro irrigation. The first set of estimates from GOI (2004) suggests the potential area that can be brought under micro irrigation to be 69.5 million hectares, of which, 39% can be brought under drip5 and the remaining 61% under sprinklers (Tables 2, 3 and 4). The second set of estimates provided by Raman (2010) put the estimated potential area at a much lower level of 45.1 million hectares, of which 26% can be brought under drip, 68% under sprinkler and the remaining 6% under micro sprinklers.
Going by the progress achieved in the last 15 years or so this expectation has so far been belied. Going by the coverage achieved as of October 2008, the proportion of actual to potential area amenable for drip irrigation has varied between 5% (as per GOI 2004 estimates) to 12% (as per Raman 2010 estimates). As per some of the more recent data available, during the period between 2008-09 and 2009-10, 0.53 million hectares of new area have been brought under drip irrigation (Source: Indiastat.com).
5
The Indian Committee on Irrigation and Drainage (ICID) estimates a potential of 10.5 million hectares for drip irrigation in India. Rajasthan 1% Maharashtra 34% Haryana 1% Andhra Pradesh 25% Karnataka 12% Gujarat 12% Tamil Nadu 9% Madhya Pradesh 1% Uttar Pradesh 1% Kerala 1% Other States 3%
9
Table 2. Theoretical potential area for drip and sprinkler irrigation in India (million hectares)
Source Drip Sprinkler Micro sprinkler Total micro irrigation
GOI (2004) 27.0 42.5 - 69.5
Raman (2010) 11.8 30.5 2.8 45.1
Table 3. Estimated potential of micro irrigation according to crop groups (million hectares)
As per GOI (2004) Raman (2010)
Crop Drip Sprinkler Total Drip Sprinkler Micro Sprinkler Total Cereals - 27.6 27.6 21.4 21.4 Pulses - 7.6 7.6 1.4 2.8 4.2 Oilseeds 3.8 1.1 4.9 1.3 4.5 0.4 6.2 Cotton 7.0 1.8 8.8 2.3 2.3 Fodder 1.8 1.8 Spices and condiments 1.4 1.0 2.4 0.7 0.7 1.4 Flowers and medicinal and aromatic plants - 1.0 1.0 Sugarcane 4.3 - 4.3 3.5 3.5 Fruits and vegetables 7.5 2.4 9.9 2.6 1.4 3.9 Coconuts, oil palm and other plantation crops
3.0 - 3.0
Others 0.4 0.4
Total 27.0 42.5 69.5 11-8 30.5 2.8 45.1
10
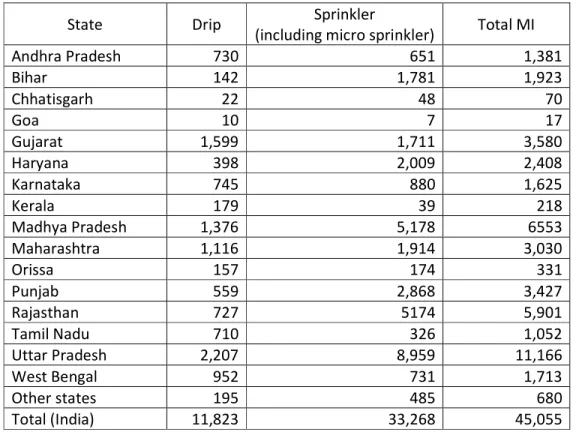
Table 4. State potential of micro irrigation in India (000 ha)
Source: Raman, 2010
2.2 Impact of drip irrigation
Various studies undertaken to assess the impact of drip irrigation have shown encouraging impacts on farm variables . Drip irrigation has helped bring about crop diversification from rainfed crops to horticultural crops and brought cultivatable waste lands under horticultural crops. Water saving6 expected from use of MIS has motivated the beneficiary farmers to shift from low duty crops to high duty crops. Savings in water due to the use of drip varied amongst horticultural crops in the range of 40-65% and in vegetables from 30-40%
6
On the question of water saving impacts of drip irrigation, the opinions differ. While a majority of the studies agree that adoption of drip leads to significant savings in water application and use, others say this is not necessarily so. It has been argued that while drip does reduce evaporative losses, it is often associated with a switch to high value crops, and reduces fertilizer use when liquid fertilizer is added to the mix and delivered precisely to the root of the plant. While these productivity gains are often seen, it is not as simple as that. It usually works for the farmer but can encourage an expansion or intensification of cultivation that often leads to an increase in the total volume of water used. Thus, major gains are possible if drip is used as part of a program to build a restriction on individual consumption in combination with increasing farm productivity (Julia Bucknall in http://blogs.worldbank.org/climatechange dated 22 March 2010). It has also been argued that improving the efficiency of irrigation systems alone does not translate in to real world savings in the hydrological cycle. Often, these improvements lead to an increase in water consumption and reductions in aquifer recharge/return flows. (Rita Cessti in http://blogs.worldbank.org/climatechange dated 24 March 2010).
State Drip Sprinkler
(including micro sprinkler) Total MI
Andhra Pradesh 730 651 1,381 Bihar 142 1,781 1,923 Chhatisgarh 22 48 70 Goa 10 7 17 Gujarat 1,599 1,711 3,580 Haryana 398 2,009 2,408 Karnataka 745 880 1,625 Kerala 179 39 218 Madhya Pradesh 1,376 5,178 6553 Maharashtra 1,116 1,914 3,030 Orissa 157 174 331 Punjab 559 2,868 3,427 Rajasthan 727 5174 5,901 Tamil Nadu 710 326 1,052 Uttar Pradesh 2,207 8,959 11,166 West Bengal 952 731 1,713 Other states 195 485 680 Total (India) 11,823 33,268 45,055
11
(Palanisami et al., 2012, INCID, 1994). Use of drip has also led to a significant reduction of labour in irrigation, weeding, harvesting and eliminated drudgery in farm management. Tables 5, 6 and 7 summarize some of the literature on impact of using drip on various farm variables, water use efficiency and the benefit-cost ratio of using drip technology under both subsidized and unsubsidized conditions. Estimates of impact of drip on different farm variables and economics of using drip varies, sometimes significantly, depending on the underlying conditions and crop regions being studied.
Table 5. Relative economics of drip and non-drip irrigated crops in Maharashtra (INR/ha)
Parameters Crops DMI FMI Gains over FMI
(%)
Cost of Cultivation Sugarcane 41,993 45,839 -13.50
Grapes 134,507 147,915 -9.00
Banana 51,437 52,739 -2.5
Cotton 42,989 42,467 1.00
Gross Income Sugarcane 106,366 85,488 24.00
Grapes 247,817 211,038 17.00
Banana 134,044 102,635 30.20
Cotton 95,558 44,151 116.00
Farm Business income Sugarcane 64,373 36,948 74.00
Grapes 113,311 63,123 44.00
Banana 82,607 50,196 64.50
Cotton 52,569 1,684 3021.00
DMI-Drip method of irrigation; FMI Furrow method of irrigation
Notes: Cost of cultivation refers to Cost A2, except cotton, which is Cost A2+family labour; In the case of sugarcane, cost of harvesting, transport and marketing are not included as sugar factories bear these costs. Source: Narayanmoorthy (2012)
12
Table 6. Benefit-cost ratio of drip irrigated crops under different scenarios in Maharashtra
Crop Subsidy category Life-period (years) Discount rate (%) BCR
Sugarcane With subsidy 5 15 2.098
5 10 2.289
Without subsidy 5 15 1.909
5 10 2.095
Grapes With subsidy 10 15 1.795
10 10 1.802
Without subsidy 10 15 1.767
10 10 1.778
Banana With subsidy 5 15 2.343
5 10 2.361
Without subsidy 5 15 2.288
5 10 2.253
Cotton With subsidy 10 15 1.956
10 10 1.983
Without subsidy 10 15 1.789
10 10 1.835
Source: Narayanamoorthy (2012)
Table 7. Water use efficiency with drip irrigation
Crop Yiled Increase % Water Saving % Increase in WUE %
Banana 52 45 176 Chilly 45 63 291 Grapes 23 48 136 Groundnut 91 36 197 Sweet Lime 50 61 289 Pomegranate 45 45 167 Sugarcane 33 56 204 Tomato 50 31 119 Water Melon 88 36 195 Source: INCID (1994)
2.3 Factors constraining uptake of drip irrigation by farmers
Despite the demonstrated impact of drip systems on water conservation, on crop yields, on other farm variables and financial viability of investment in drip, why is it that only a few farmers have so far invested? Uptake by farmers has been far lower than the potential this technology offers. Why is it that not many farmers are coming forward to invest in a drip system? What is constraining farmers from investing in drip systems? The available literature and our primary survey of farmers in the selected regions of Madhya Pradesh point to some of the following factors:
13 Technology related
Lack of awareness about the technology; Unsure about reliability of the technology;
The problems associated with the use of the technology (laying pipe lines, storage during periods of non -use, choking and cleaning emitters);
Poor quality of the system supplied;
Unreliable and poor quality spares and non-availability of standard parts;
Lack of knowledge of the users regarding the maintenance and operation of the system; and
Lack of access to technical support for running and maintenance of the system. Crop/farm size related
Small size of holding;
Drip system not suitable for cultivation of crops which the farmers are cultivating; Cost/subsidy/finance related
Non- access to government subsidy, difficult process to get a government subsidy; High upfront cost of investing in a drip system even with a subsidy; and
Lack of access to institutional finance/ cost of finance. Water related (quantity/quality/pricing etc)
Water source related constraints;
Water availability for irrigation not a problem; enough water available for growing crops and no need for water conservation; and
Subsidies on surface water or free electricity for irrigation pumping. Other
Non-availability and uncertainty of power supply.
While all or most of these factors affect to a varying extent the uptake of drip irrigation systems, one of the most important factors has been the high upfront cost of the technology.
3.
DRIP IRRIGATION IN MADHYA PRADESH: A STATUS REPORT
The agricultural policy of Madhya Pradesh emphasizes increasing area under horticultural crops and promotion of agro-processing industries. Encouraging cultivation of medicinal crops and floriculture in each district is also part of the policy. Achieving these objectives requires efficient water management as an integral part of the policy. Like other states, Madhya Pradesh is also promoting more efficient methods of irrigation such as drip and sprinkler.
The adoption of drip program in Madhya Pradesh is relatively recent. Appendix Table 1 provides by district the number of beneficiaries who have adopted drip irrigation during the last four years. Five of the 50 districts in the state account for almost 73% of the total drip users in the state in the last four years (Table 8). Although incentives for investment in drip are available for all the districts in the state, the state government has been pushing drip more vigorously in these five districts. All these five districts are located in the south-western part of the state bordering Maharashtra and Rajasthan and are in two agro-climatic
14
zones of the Nimar Plains and the Malwa Plateau. Both are experiencing severe shortages of groundwater (Figure 2).
Table 8. Important districts for uptake of drip irrigation in Madhya Pradesh: Number of users adopting drip irrigation in recent years]
2 AGRO CLIMATIC ZONES
1. Chattisgarh Plain Balaghat
2. Northern Hill Region of Chattisgarh
3. Kymore Plateau Satpura Hills
4. Central Narmada Valley
5. Vindhya Plateau 7. Bundelkhand 8. Satpura Plateau 9. Malwa Plateau 10. Nimar Plains 11. Jhabua Hills 6. Grid Region
Agro Climatic Zones in Madhya Pradesh
Figure 2. Agro-climatic zones of Madhya Pradesh
3.1 Market development for drip irrigation in Madhya Pradesh
The drip irrigation equipment market is fairly well developed in Madhya Pradesh. A number of large, medium and small companies provide irrigation equipment that includes drip and sprinkler sets. The available record shows there were 51 registered companies in the state engaged in the business. Most were selling sprinkler sets (45%), followed by both sprinkler and drip irrigation (43%) and exclusively drip equipment (12 %, Table 9).
District 2006-07 Beneficiaries 2007-08 Beneficiaries 2008-09 Beneficiaries 2009-10 Beneficiaries No % No % No % No % Badwani 39 8.7 205 8.4 932 9.4 1,253 10.0 Burhanpur 142 31.7 315 13.0 1,309 13.2 1,593 12.7 Dhar 12 2.7 333 13.7 1,884 19.0 2,231 17.8 Khargone 0 0.0 423 17.4 2,278 23.0 2,750 21.9 Ratlam 121 27.0 282 11.6 854 8.6 1,309 10.4 Other Districts 134 29.9 873 35.9 2,656 26.8 3397 27.2 Total State 448 100.0 2431 100.0 9913 100.0 12533 100.0
15
Table 9. Number of companies providing irrigation equipment Type of equipment No. of companies Distribution % Distribution of companies % Within the state Outside the state
Drip & sprinklers 22 43 27 73
Sprinklers 23 45 22 88
Drip 6 12 8 82
All 51 100 24 76
One-fourth of the total companies are based in Madhya Pradesh and the remaining are from Delhi, Maharashtra, West Bengal, Rajasthan and Gujarat. Competition among these companies is strong. The range in terms of quality and cost is quite substantial. A few companies such as, Jain Irrigation and Netafim Irrigation are recognized for maintaining the quality of their products. Other products are considered relatively inferior in quality but the range is large.
4.
SUBSIDIES FOR DRIP IRRIGATION TECHNOLOGY
4.1 Rationale
The decision of a farmer to invest in a new high cost technology such as drip irrigation is dependent on a large number of factors. Two factors that play a relatively more important role in decision making process are the financial viability of investing in the technology and the ease with which the technology can be used. Once a farmer is convinced of the economics of investment, the next important consideration is looking at the factors which could either constrain or facilitate the adoption of the technology. Availability of good quality equipment and access to financial resources7 for meeting the upfront cost of investing in the technology8 are some of the important factors that influence technology uptake and adoption.
Adoption of drip technology by farmers in India has been constrained by both set of financial concerns which influence its uptake– not too sure about the financial viability of the investment in the technology and lack of access to resources to invest in a high cost technology. While a number of studies have demonstrated the financial viability of investing in a drip technology the available evidence is specific to region, location, situation, farm size and crop (see, for example, Chandrasekaran and Kumar, 2012; Puran Mal et al., 2010; Malik and Luhach, 2002; Sivanappan, 1994). The methodology employed to determine the financial viability of drip suffer from serious limitations (Dhawan, 2000 ) and therefore do
7
Similar views have been expressed by the industry. Jain Irrigation, one of the leading players in the manufacture of drip irrigation products said that “The major obstacle we are facing in promotion of drip irrigation is availability of credit flow and finance to farmers. Although the governments are subsidizing the cost of drip irrigation systems by about 50%, the farmers need funds to meet the balance, which becomes a limiting factor. The governments and the banking sector need to look at this concept more pragmatically and increase their credit flow substantially. The banks should offer attractive interest rates and increase the allocation for financing drip systems.”
8
Palinisami (2011) also notes that although the returns are high under micro irrigation, farmers are reluctant to expand due to constraints like high initial capital cost, lack of technical knowledge and type of crops grown.
16
not instil the level of confidence that is required to encourage spontaneous and widespread adoption. For similar reasons farmers do not want to invest either their own money or borrow money to invest in the technology.
Given the pressing need for adoption of water conserving measures in the face of high upfront cost of the technology and not- too- certain private (and often social and water saving9) returns from adoption, the government has been using the capital cost subsidy as the primary vehicle for promoting uptake. The dual logic behind providing a capital cost subsidy is to reduce the high upfront capital cost of the technology and thereby make it possible for the farmer to invest with less personal capital and to improve the financial viability of private investment10. Subsidies have continued to be an important driving factor for promoting investments in and uptake of drip technology despite the limited funds allocated by the central and state governments, the institutional arrangements employed for subsidy disbursal, and the eligibility criterion and other conditionalities attached.
4.2 Evolution of subsidy program for drip
The subsidy for micro irrigation was introduced by the central and state governments between 1988-1991. A Centrally Sponsored Scheme (CSS) on use of plastics in agriculture was launched during the Eighth Five Year Plan (1992-97) of Government of India with an outlay of INR 2,500 million, of which an outlay of INR 2000 million was earmarked for promoting efficient methods of irrigation through drip and micro irrigation in the country. During 1994-96 the government was giving a subsidy at the rate of 50% of the cost of equipment to all categories of farmers. From 1997 to 1999-2000, for facilitating installation of drip systems, the government provided assistance at the rate of 90% of the cost of the system or INR 25,000 per hectare, whichever was less, for small and marginal farmers, Scheduled Tribe and Scheduled Caste farmers, and women farmers. For other categories of farmers the amount of assistance was limited to 70% of the total cost or INR 25,000 per hectare, whichever is less. Assistance was also provided for drip demonstrations at the rate of 75% of the system cost or INR 22,500 per hectare or whichever is less.
Following the above formula, the government disbursed subsidies uniformly irrespective of the size of the farm, the nature of the crop cultivated, or the amount of plant spacing. A Cost Committee constituted by the Ministry of Agriculture in 1997 suggested the following modifications to the disbursal program:
• Differential unit cost of systems for different plant spacing. The unit cost based on less than one hectare norms will be higher as compared to the unit cost for one hectare. There are also cost norms for 0.4 hectare, 1 ha and 4 ha.
• Components such as filters and venturi assemblies are to be included as optional items because of their restricted use by the farmers coupled with high cost.
• The cost of s drip irrigation system needs to be charged based on free competition and market forces.
9
A number of studies have shown that adoption of drip technology does not lead to any savings in water.
10
Some studies suggest that investment in unsubsidised drip systems is financially viable (see, e.g., Naryanamoorthy, 2012).
17
• The assistance needs to be lowered from 90% to 50% for Scheduled Tribes and Castes, small and marginal and women farmers, whereas it may be reduced from 70% to 35% for other categories of farmers subject to a ceiling of INR 25,000 per hectare.
• The assistance may be restricted for a maximum of 4 ha against the existing unlimited area rule.
• The registration of companies supplying imported and indigenous drip irrigation components needs to be done centrally at NCPA.
• Only those companies which manufacture at least two components of DIS i.e laterals and emitting devices, need be registered.
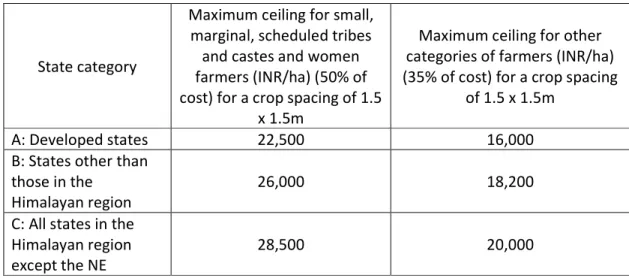
Based on the recommendations of the Committee, the pattern of assistance for micro irrigation was revised during the IX Five Year Plan (1997-2002) as per the details given below:
Table 10. Pattern of Assistance for Micro Irrigation in IX Plan
State category
Maximum ceiling for small, marginal, scheduled tribes
and castes and women farmers (INR/ha) (50% of cost) for a crop spacing of 1.5
x 1.5m
Maximum ceiling for other categories of farmers (INR/ha) (35% of cost) for a crop spacing
of 1.5 x 1.5m
A: Developed states 22,500 16,000
B: States other than those in the
Himalayan region
26,000 18,200
C: All states in the Himalayan region except the NE
28,500 20,000
This pattern of assistance continued until the end of Ninth Plan (2001-02). Thereafter, with effect from 2002-03 during the Tenth Plan, assistance was reduced to 25% of the cost of the system for all categories of farmers.
4.3 Current status of subsidies on micro irrigation in India
Continuing with the past approach of promoting the use of micro irrigation through the provisioning of financial subsidies on the cost of the equipment, the government launched in 2005-06 and subsequently upscaled during the Eleventh Five Year Plan (2007-12) a “National Mission on Micro Irrigation (NMMI)” as a Centrally Sponsored Scheme (CSS) for promotion and uptake of minor irrigation through provision of financial subsidies11. Under this CSS, 40% of the cost of a micro irrigation system is borne by the central government,
11
Components of drip and sprinkler irrigation systems are at present also included in some other CSS such as National Food Security Mission (NFSM), Integrated Scheme of Oilseeds, pulses, oil palm and maize (ISOPOM) and the technology mission on cotton (TMC). These programs however also conform to the same norms and pattern of assistance as stipulated under NMMI.
18
10% by the state government and the remaining by the beneficiary either through his or her own resources or through a loan from financial institution. Additional assistance of 10% of the cost of the system is borne by the central government in respect of small and marginal farmers. Many state governments are providing even higher than the required minimum subsidy of 10%. Some of the eligibility requirements and the institutional arrangement for the delivery of subsidies as per the NMMI scheme are12:
• All categories of farmers are eligible for assistance under this scheme.
• Assistance to farmers is limited to a maximum area of five hectare per beneficiary. • Assistance is available for both drip and sprinkler irrigation for widely spaced as well
as closely spaced crops. However, assistance for sprinkler irrigation systems is available only for those crops where drip irrigation is uneconomical. All types of drip irrigation systems such as on line drip, in line drip, sub-surface drip, and micro jets are eligible.
• Assistance is available for irrigation systems for protected cultivation including greenhouses, polyhouses and shadenet houses.
• Assistance is available for implementation of advanced technology like fertigation with fertilizer tanks, venturi systems, sand filters, media filters, hydrocyclone filters, sand separators and other types of filters and valves.
The NMMI also suggested an elaborate institutional arrangement and prescribed a set of procedures for disbursal of subsidies. The NMMI provided the estimates of the nominal cost of a micro irrigation system for different crop spacings and for different sizes of farms for use by states to calculate the eligible amount of subsidy. For the purpose of fixing the nominal price of a drip system and therefore for determining the amount of subsidy, the states have been categorized. States where more than 20,000 hectares have been brought under drip irrigation come under Category A for which the costs have been worked out by NMMI. This includes the states of Andhra Pradesh, Gujarat, Karnataka, Madhya Pradesh, Maharashtra and Tamil Nadu. All the states except those covered under Category A and those falling in the Himalayan region come under Category B. All the Northeastern states, Sikkim, Himachal Pradesh, Jammu and Kashmir, Uttarakhand and Darjeeling District of West Bengal come under Category C. Keeping in view the level of awareness, proximity to the manufacturing units, distance involved in transportation, potential for drip irrigation, the cost of drip systems in Category B states is estimated to be 15% higher than Category A states, while for Category C states it is estimated to be 25% .
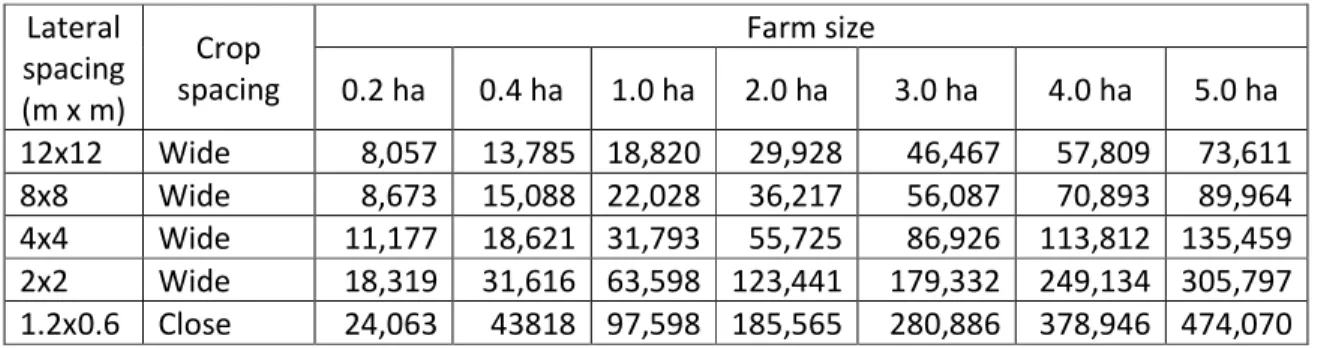
Table 11 provides illustration of the cost of drip irrigation systems, in respect of a few of the various farm sizes-crop spacing combination, that is used for calculating the amount of eligible subsidy in Category A states.
12
Source; Government of India. 2010. National Mission on Micro Irrigation: Operational Guidelines. New Delhi: Ministry of Agriculture, November 2010.
19
Table 11. Indicative Costs of Drip Irrigation Systems for subsidy calculation for different sizes of farms and different lateral spacing (Costs in Rs)
Lateral spacing (m x m) Crop spacing Farm size 0.2 ha 0.4 ha 1.0 ha 2.0 ha 3.0 ha 4.0 ha 5.0 ha 12x12 Wide 8,057 13,785 18,820 29,928 46,467 57,809 73,611 8x8 Wide 8,673 15,088 22,028 36,217 56,087 70,893 89,964 4x4 Wide 11,177 18,621 31,793 55,725 86,926 113,812 135,459 2x2 Wide 18,319 31,616 63,598 123,441 179,332 249,134 305,797 1.2x0.6 Close 24,063 43818 97,598 185,565 280,886 378,946 474,070
4.4 Subsidy on drip in Madhya Pradesh
Under the prevailing subsidy regime in Madhya Pradesh, the extent of the subsidy varies between 70 and 80% of the cost of the system shared between central and state governments. While the central government provides for 50% of the equipment cost in the case of small and marginal farmers, the subsidy is 40% in the case of other categories of farmers. The state government additionally provides between 20 and 30% of the cost as a subsidy. The total subsidy as a percentage of the cost of equipment thus varies between 70 and 80% for different categories of farmers (Table 12).
Table 12. Subsidy on micro irrigation in Madhya Pradesh (effective 1 January 2011)
Category of farmer Category % Subsidy
Central Govt State Govt Total Small and marginal Scheduled
Caste/Tribe 50 30 80
Other Scheduled
Caste/Tribe 40 30 70
Small and marginal General 50 20 70
Other General 40 30 70
Source : Office of the Micro Irrigation Committee, Bhopal.
For the purpose of calculation, the indicative cost for different farm sizes and different crop spacings are the same as suggested by NMMI and presented in Table 10. Table 13 shows the various components that form the standard drip irrigation system for two of the illustrative farm sizes and crop spacing combinations. These are the components which go into determining the cost of drip irrigation as given in Table 10 and thus for estimation of the eligible amount of the subsidy. The subsidy is available on the unit as a whole and not on individual components of the system.
20
Table 13. Components and material requirements for a standard drip irrigation system.13 Widely spaced crops 0.2 hectares Widely spaced crops 5 hectares
PVC Pipe 75 mm; Class II ; 4kg / cm2 PVC Pipe 90 mm; Class II ; 4kg / cm2 PVC Pipe 63 mm; Class II ; 4kg / cm2 PVC Pipe 75 mm; Class II ; 4kg / cm2 PVC Pipe 50 mm; Class II ; 4kg / cm2 PVC Pipe 63 mm; Class II ; 4kg / cm2 Lateral 16 mm Class II ; 2.5 kg / cm2 Lateral 16 mm; Class II; 2.5 kg / cm2 Lateral 12 mm Class II ; 2.5 kg / cm2 Lateral 12 mm; Class II; 2.5 kg / cm2
Emitter 4 / 8 lph Emitter 4 / 8 lph
Microtube 6 mm Microtube 6 mm
Control Valve 75 mm Control Valve 90 mm
Control Valve 63 mm Control Valve 75 mm
Control Valve 50 mm Control Valve 63 mm
Flush Valve 63 mm Flush Valve 75 mm
Flush Valve 50 mm Flush Valve 63 mm
Air Release Valve 1" Air Release Valve 1.5" Non Return Valve 1.5" Non Return Valve 1.5" Throttle Valve 1.5" Non Return Valve 2.5" Screen Filter 10 m3 / hr Throttle Valve 1.5" By-pass Assembly - 2" Throttle Valve 2" By-pass Assembly – 1.5" Throttle Valve 2.5"
Venturi & Manifold 2" Screen Filter 20 / 25 m3 / hr Venturi & Manifold 1.5" Screen Filter 10 m3 / hr
By-pass Assembly – 2.5" By-pass Assembly - 2" By-pass Assembly – 1.5" Venturi & Manifold 2.5" Venturi & Manifold 2" Source: Government of India (2010)
4.5 Subsidy disbursal
The Horticulture Department in the state government has issued detailed procedures and timelines for each stage, from submission of application to disbursal of the subsidy (Appendix II). To what extent these procedures and timelines are actually followed in practice is difficult to know, although several farmers and agents we spoke to suggested wide differences between the two. The salient features of the process are summed up in the following flow diagram. The complicated procedures prescribed for getting a subsidy entail filling out several forms14, attaching documentary evidence, obtaining ‘no-objection’ and clearances from different agencies, shunting documents between different government departments; a strong disincentive for an otherwise enthusiastic farmer to consider applying on his own without the assistance of an intermediary or an agent. Figure 3 provides a glimpse of the step-by-step process for subsidy application and approval.
13
Requirement may vary depending upon lateral to lateral dripper spacing
14
In all up to 14 documents are required to be arranged by the individual beneficiaries for self finance and about 18 for bank finance.
21
Estimation of area and cost on basis of received applications, formulation of District Action Plan and forward DMIC’s sanction plan to state Micro Irrigation Committee (SMIC).
Preparation and approval of state level action plan by SMIC. Forward to central government’s Department of Agriculture and Cooperation (DAC), New Delhi.
Field visit to the farm with Village Horticulture Extension Officer for information verification. Send applications in an ordered list to District Horticulture Officer.
MEMBER SECRETARY, DISTRICT MICRO IRRIGATION COMMITTEE (DMIC)
Receipt and registration of Gram Sabha approved applications with documents on “first come first served basis” from farmers through Village Horticulture Extension Officer, Horticulture Extension Officer and other sources like regional workers/dealers of micro irrigation companies.
BLOCK DEVELOPMENT OFFICER
MEMBER SECRETARY, STATE MICRO IRRIGATION COMMITTEE (DMIC)
Sharing of information received about district action plan approved by DAC with DMIC. MEMBER SECRETARY, DISTRICT MICRO IRRIGATION COMMITTEE (DMIC)
Forwarding of block applications to micro irrigation companies selected by farmers for survey drawing/design etc. along with bank loan application approved by bank for further action.
MICRO IRRIGATION COMPANY
Survey drawing/designing etc. and sending to BDO and Senior Horticulture Development Officer. BLOCK DEVELOPMENT OFFICER
Physical verification of irrigation water and energy for purposed micro irrigation system and sending documents with recommendations to Member Secretary, DMIC.
MEMBER SECRETARY, DISTRICT MICRO IRRIGATION COMMITTEE (DMIC) Issue of administrative approval and work orders to micro irrigation company.
MICRO IRRIGATION COMPANY
Establishment of irrigation system, training of farmer along with Hindi manual. Sending Satisfaction Certificate obtained from farmer and bills to Member Secretary, DMIC.
NOMINATED GROUP OF OFFICERS
Physical verification and inspection of system installed. Processing of payment to micro irrigation BENEFICIARY
Submission of affidavit with documents to Assistant Director, Horticulture and Joint Secretary, DMIC stating system installed will not be transferred or sold. Give in writing that no benefit has been drawn before from any similar government Scheme.
22
4.6 Extent of subsidy available and uptake of drip technology
The performance of the Drip Irrigation Program in Madhya Pradesh in recent years can be observed from Table 14. The table shows the status with respect to physical and financial targets and their achievement in the last five years.
Table 14. (title needed)
(Physical in hectares and financial in INR 100,000)
Year
Physical Financial
Target Achievement Achievement % Allocation Expenditure Total Proportionate share of Total Proportionate share of Expenditure as % of funds allocated Central State Central State
2006-07 3,528 875 25 704 82 18 165 82 18 23 2007-08 7,486 7,846 105 2,677 41 59 1,508 68 32 56 2008-09 30,153 38,146 127 8,534 54 46 7,516 58 48 88 2009-10 33,308 35,604 107 7,407 47 53 8,791 49 51 119 2010-11 42,166 9,382 22 6,580 56 44 2,333 76 24 35 Total 116,641 91,853 79 25,903 52 48 20,313 57 43 78
Source: Presentation in Annual meeting 2010-2011, of Department of Horticulture, M. P.
The data Table 14 shows there is no consistency in allocation of funds and the physical targets specified. The program is significantly dependent on the availability of central funds that may or may not be released on time due to several administrative reasons such as non-availability of previous year’s use and audit certificates or for deficiencies found in implementing the program according to central government guidelines. Except in 2009-10 when use was more than funds allocated, in all other years use varied between a low of 23% in 2006-07 to a high of 88% in 2008-09. Government officials during discussions accepted that there is the potential for realising improved physical targets for micro irrigation, but for lack of availability of funds at the required time. Generally, the subsidy fund available in a given year is quite low compared to the demand.
In terms of the number of new adopters of drip irrigation, during 2006-07, 448 new farmers adopted drip irrigation which number increased to 12,533 new users during 2009-10 as a result of greater availability of subsidies (see Table 15). A majority of the drip sales are concentrated in just five districts of the state. During the year 2009-10, 73% of new users of drip were located in these five districts: Badwant, Burahampur, Khargone, Dhar and Ratlam (Figure 4).
23
Table 15: Uptake of drip irrigation in important districts of Madhya Pradesh
Figure 4. Location of districts with highest number of beneficiaries of drip irrigation subsidy 2009-10 District 2006-07 Beneficiaries 2007-08 Beneficiaries 2008-09 Beneficiaries 2009-10 Beneficiaries No % No % No % No % Badwani 39 8.7 205 8.4 932 9.4 1,253 10.0 Burhanpur 142 31.7 315 13.0 1,309 13.2 1,593 12.7 Dhar 12 2.7 333 13.7 1,884 19.0 2,231 17.8 Khargone 0 0.0 423 17.4 2,278 23.0 2,750 21.9 Ratlam 121 27.0 282 11.6 854 8.6 1,309 10.4 Other Districts 134 29.9 873 35.9 2,656 26.8 3397 27.2 Total State 448 100.0 2,431 100.0 9,913 100.0 12,533 100.0 12.7% 21.9% 10.4 % 17.8 10 %
24
4.7 Availability of subsidy and uptake of drip
Manufacturers and market estimates suggest that more than 95% of the drip sales in Madhya Pradesh are subsidy linked15,16. If the subsidy on drip were to be withdrawn, the sales of drip would collapse and there would be very few new buyers. This line of reasoning is being advanced to justify continuing with the existing subsidy regime and possibly to increase the percentage of subsidy to encourage more farmers to invest. This argument is also being advanced to encourage and persuade governments to increase the total amount of annual financial allocations for subsidy disbursal so that at the prevailing subsidy levels a much larger number of farmers could benefit. To support this line of argument, all the intermediaries involved in manufacturing and selling drip systems show a long list of pending farmer demand which indicates that a farmer has to sometimes wait for one to two years before his turn comes up. Given that substantial government funds to the tune of 70 to 80% of the cost of the system is available for purchase of a drip system, it is natural to expect that not many otherwise willing farmers would like to invest without a subsidy. The link between uptake of drip systems to availability of subsidy17 has stifled the inertia of developing aggressive marketing strategies on the part of the manufacturers to promote sales of unsubsidized systems, and any attempts at bring down the manufactured cost of drip systems through product designs or technological innovations. All efforts of manufacturers, dealers and other stakeholders are focused on making the most of the available government subsidy through sales of their brand. The system has thus made the manufacturers subservient to government favour and has led to the loss of their enterprise spirit and is impeding the growth of market for drip18. Similarly, the insistence that drip products carry the BIS mark as a guarantee and more so as a pre-condition to be eligible for a government subsidy has led to the adoption of unfair business practices19,20.
15
This in fact is true not only for Madhya Pradesh but all other states of India. With the introduction of the Centrally Sponsored Scheme, the implementation of micro irrigation has gradually accelerated in all states and the physical performance has been of the order of 800% in Madhya Pradesh during the period between 2006-08. (Palanisami et al., 20110).
16
The government data on area under drip irrigation in different states is also derived on the basis of systems sold through the subsidy program, implying the government also does not expect that any additional area will come under drip irrigation without subsidies.
17
Narayanamoorty (2009) said that “most of the development (in drip and sprinkler) has been due to support (subsidy) from State agencies.
18
Shah and Kellor (2002) note that “15 years ago when drip irrigation came to be commercially marketed for the first time, some of the leading players—especially, Jain Irrigation—invested heavily in market development and were beginning to reap the benefits. But in the 1990’s, GoI introduced the subsidy for drip systems. The major industry players—like Jain irrigation—. are frustrated by the distortions caused by the subsidy. In reality, it has increased competition for them. The subsidy has attracted a large number (40-50 companies are registered) of shady players in the drip business who peddle low quality products, and often claim a subsidy without selling systems. Getting the ISI registration involves a one-time bribe of INR 6-8 lakh; but then the manufacturer becomes entitled to market his products under the subsidy scheme. This has made big players uncompetitive; it has also created quality problems and impeded market growth due to diminishing farmers’ faith in the technology.”
19
Quoting the views of a dealer, Shah and Kellor (2002 ) refer this to “ISI mark + subsidy = fraud”.
20
The subsidy system breeds corruption and tends to benefit the least needy; see A Note on Drip Irrigation available at ifmr.ac.in/wiki/images/d/d4/Note_on_Drip_Irrigation.doc.
25
Our assessment of the prevailing subsidy regime of the government, together with the procedures set and the manner in which the subsidy disbursal takes place, suggests a strong connection between manufacturers and implementing agencies of the government entrusted with the administration of the subsidy program . The subsidy, as currently being administered, is actually going to the manufacturers who claim it in the name of the farmers21. Since a subsidy is provided as a percent of the price (which earlier used to be capped by the government department for the purpose of calculating the maximum amount of eligible subsidy but is no longer the case now) the higher the quoted price, up to the normative prices fixed by the government for the purposes of subsidy calculation, the higher the amount of subsidy. It is therefore in the interests of the manufacturers to jack up the prices of drip sets in the name of higher manufacturing costs and claim a bigger subsidy without any commensurate benefit going to the farmer.
The manufacturers have adopted competitive strategies to create a sustainable competitive advantage for promotion of their businesses. Companies follow various methods for delivering water saving technology at the farm level, such as demonstrations using outreach materials and establishing personal contacts between farmers and company representatives and dealers. Demonstrations of the technology on the farms of progressive and influential farmers are organized. This has had an unintended negative effect of excluding small farmers and thus depriving them of knowledge about the technology. The actual business model followed by companies is governed more by the state subsidy system. Demonstrations on big farms strengthen the connection between dealers, companies, officials and farmers.
Companies operate more like a cartel to benefit from the subsidy provisions of the program. Producers and the chain of sellers involved in marketing micro irrigation technology emphasize building contacts with government officials at different levels to get the maximum share out of the subsidy fund. At the farm level, the attempt is to convince the farmer that he/she will get a high cost product without having to pay the full amount, rather than emphasizing the benefits the farmer might gain from the technology or details about maintenance. The focus is entirely on getting the necessary papers prepared for release of subsidy from the government. Even the decision about the choice of product and of the company is determined by the agent who succeeds in approaching the farmer and getting
21
Shah and Kellor (2002) also refer to the strong connection between the subsidy regime and siphoning off the subsidies by both manufacturers and government officials involved in subsidy delivery. They say that “Governments are now cutting subsidies on drip irrigation and this is creating a new generation of problems for the industry mainstream which has got hooked on the opiate of subsidies over several years. Until last year when the subsidy was as high as 90%, the marketing dynamic of the drip system was fired by the subsidy culture. Indeed, the manufacturers and dealers, including the leading brands, were after the ‘unearned profit’ in the form of subsidies more so than manufacturing and marketing margins from serving satisfied customers. Since ISI-marked products enjoy a degree of monopoly in the form of subsidy access, their manufacturers hiked their prices pretty much to levels where they and the bureaucrats empowered to approve subsidies claimed the bulk of the subsidy. However, since claiming the subsidy involved between 1-3 years and 15-20% bribe money, there was always a market for non-subsidy drip systems and products. Now that the subsidy has been reduced to 30%, the profits in ISI marked drip systems have taken a plunge. All players with major names in the ISI-sector are facing declining fortunes; they have been progressively cutting their prices to stimulate their non-subsidy sales; but here they face stiff competition from the non-ISI players who sell unbranded products at rock bottom prices.”