An Oracle White Paper March 2013
Avoiding the Insurance Reporting Cliff
The importance of data management for
insurance regulatory reporting
Disclaimer Oracle
The following is intended to outline our general product direction. It is intended for information purposes only, and may not be incorporated into any contract. It is not a commitment to deliver any material, code, or functionality, and should not be relied upon in making purchasing decisions. The development, release, and timing of any features or functionality described for Oracle’s products remains at the sole discretion of Oracle.
Disclaimer PwC
© 2013 PricewaterhouseCoopers Advisory N.V. (Chamber of Commerce 34180287). All rights reserved. PwC refers to PricewaterhouseCoopers Advisory N.V., and may sometimes refer to the PwC network. Each member firm is a separate legal entity. Please see www.pwc.com/structure for further details.
This content is for general information purposes only, and should not be used as a substitute for consultation with professional advisors. You should not act upon the content of this publication without obtaining specific professional advice. No representation or warranty (express or implied) is given as to the accuracy or
completeness of the information contained in this publication, and, to the extent permitted by law, PwC does not accept or assume any liability, responsibility or duty of care for any consequences of you or anyone else acting, or refraining to act, in reliance on the information contained in this publication or for any decision based on it.
PricewaterhouseCoopers Advisory N.V. is the co-author of this publication and is co-owner of the copyright. Without written permission of PwC and the other authors, this publication may not be duplicated, copied, distributed or published.
Executive Overview ... 2
Introduction ... 2
A reporting cliff is emerging on the horizon ... 4
Insurance regulations create a high demand for reporting ... 4
Solvency II and IFRS ... 5
The impact of flawed data ... 5
Solvency II accelerates the push towards the reporting cliff ... 6
Key challenges ... 7
Challenges ... 8
Data challenges ... 8
Reporting challenges ... 13
Practical solutions ... 15
Solutions to the data challenges ... 15
Solutions process challenges ... 22
Beyond regulatory reporting ... 26
Executive Overview
With Solvency II (SII) and IFRS 4 Phase II on the horizon, the regulatory burden facing insurers continues to grow. Whilst there is some confusion as to the Solvency II
implementation timetable, insurers have little choice but to continue with their Solvency II programs and assesshow they integrate with IFRS programs as requirements evolve.
To be successful, data must be at the heart of SII and IFRS programs - and proper data management entails:
• Defining the data required
• Gathering the data from a multitude of systems and individual contributors
• Cleansing and authenticating the data through various data quality checks
• Consolidating data to populate management and regulatory reports
• Maintain data security for the better governance and auditability
Indeed it could be argued that data is the main challenge insurers face in both SII and IFRS programs.
Introduction
In this paper we examine the challenges relating to data management, including defining critical risk/capital data, improving its quality and providing the audit trails and lineage required for governance. One of the key challenges is that a significant amount of the required data is new to the organization (e.g. the Quantitative Reporting Templates [QRT] templates) and new processes and tools may be required to generate it. Furthermore, many insurers will seek to drive business benefits from their regulatory programs and require additional risk/capital data to support better informed business decisions and the Use Test. Defining the data
requirements and putting the tools in place to meet them will again be a new process.
Whilst data is critical, new reports and process are also essential to shortening close timetables and integrating the processes for producing SII, IFRS and financial reports. The
challenge is heightened by the need to combine large amounts of qualitative and quantitative data, generate XBRL (for the regulators) as well as support the Use Test and ORSA
processes.
The principle of proportionality is wholly relevant, as the challenges of data and reporting increase with the size of the insurer. For medium and large insurers, an analytical data repository is essential to providing the industrial strength data management needed to support regulatory reporting and improved decision making throughout the business. This paper also outlines the principles of an analytical data repository, explains how it supports the reporting process and improves data quality and lineage.
If insurers are to avoid the reporting cliff, they must quickly get to grips with the data management and quality issues they face today.
A reporting cliff is emerging on the horizon
To illustrate the importance of understanding the data and the reporting challenges boards face today, we use an example from the oil industry that is also pertinent to insurance. Some years ago Shell was not reporting the correct numbers on their oil reserves. When this came out, the stock price
plummeted and it took years for the company to recover. There have been similar cases in the insurance industry, such as AIG, that have taught CEOs and CFOs the critical lesson that the final numbers can only be correct if the underlying data is validated and accurate. Inaccurate data may lead to investigations and loss of trust by regulators, as well as the public at large. Such outcomes tarnish the brand and cause market capitalization to tumble. It is more important today than ever before to have the correct figures in reports. Analysts, rating agencies and regulators demand that insurers take full ownership of data management and report transparently. Claiming that one is unaware of poor data quality is no longer an option. As the reporting requirements are clear and all reports must be analyzed and tested, there will be no tolerance for ignorance on the insurer’s side.
New insurance regulations heighten demands for reporting
The insurance market is now highly regulated and subject to a plethora of complex reporting regimes such as:
• Solvency II
• IFRS 4 Phase II and 9
• FATCA
• Retail Distribution Review (UK)
A common requirement emerging from these regulatory initiatives is the need for insurers to store and manage a broad range of new data to drive their regulatory and internal reporting processes. Data needs to be extracted at the appropriate level of granularity from numerous internal and external source systems, transformed and validated. As a next step, the data must be aggregated, modeled and consolidated and finally reported in multiple formats, including Excel, Word and XBRL.
If storage and reporting processes are flawed in any of the steps in the data management, reports will be inaccurate and the audit trail to source data broken. In such cases, individual regulatory reports may not be able to be validated or reconcilable, thus jeopardizing the reputation of the department
producing the reports and the company brand. Moreover, business benefits can only be derived from the investment in regulatory compliance if the quality of data is enhanced to support better and more informed business decisions.
Hence data management is critical not only to regulatory compliance, but also to the organization’s own success. The problem is compounded by the fact that data quality is generally poor amongst insurance companies, which requires risk and finance experts to spend considerable time validating and cleaning data instead of analyzing data, drawing conclusions, and creating reports to support
Solvency II and IFRS
Solvency II is a critical initiative for European insurers. With the delays in the Solvency II
implementation, IFRS 4 Phase II may well come into effect before Solvency II; as a result, managing the interdependencies between the two projects is becoming increasingly important. As many insurers are investing significantly in upgrading systems and processes to implement Solvency II, it is urgent to understand and address the implications of IFRS 4 Phase II in parallel. There are considerable similarities between the requirements for IFRS Phase II and Solvency II in some areas, creating potential implementation synergies. However, there are also significant differences and IFRS 4 Phase II introduces a number of requirements that go beyond the scope of Solvency II. Insurers need to take a strategic view on the impact of these changes and build flexibility into their current solutions to reduce investment in future years.
There is some common ground between Solvency II and IFRS 4 Phase II, but IFRS also requires new data to produce mandatory financial information, including:
• Underwriting margin • Residual margin
• Experience variances and changes in assumptions • Day one losses on insurance sold
• Interest expense from discount unwinding (ideally paired with an asset investment income line to display an investment margin).
All of these will have an impact on the running of actuarial and profit earning models. The impact of flawed data
The risk that a data management process is flawed starts with the information stored in the underlying source systems. If the underlying data is inaccurate, the reports produced cannot be accurate either. PwC analysis has shown that a simple mistake, such as incorrect gender or birth year, can have a significant impact on technical provisions and SCR value.
The scope for error is heighted by the challenge of creating the industrial strength processes needed to run underlying models in multiple stress configurations in tandem with the calibration of Economic Capital models. Strong data management processes are needed to ensure such errors do not occur. The data quality of underlying contract and asset systems also needs to be taken into consideration within the context of data proportionality:
Case study showing that poor data quality can significantly impact reserves and SCR:
A standard administration system for individual life insurance policies was used to run several tests. In each run, the age, gender, insured capital, premium amount and premium date was slightly altered. For instance the birth date was increased by one year. After running multiple scenarios, it became clear that a relatively simple mistake could have a significant impact on reserves and SCR. See table below for details (note: TP is the abbreviation for Technical Provision).
Table 1: Sample data quality report
Solvency II accelerates the collision course with the reporting cliff
Despite on-going uncertainty as to the final Solvency II implementation date, regulators have made clear that there is a delay, but not a cancellation. Large insurers continue to invest significantly in their Solvency II programs.
Although the deadline for Solvency II implementation is now likely to be 2016, the delay will make little practical difference on most Solvency II projects in light of their current state. For some insurers, the project will simply be extended with increased costs. However others insurers will leverage the two year breathing space to implement more robust data management and reporting solutions to replace the spreadsheet-spaghetti and sellotape approaches adopted to meet the initial deadline with insufficient time to do little else.
In any event, insurers are now moving from an actuarial centric approach primarily focused on calculating Pillar I analytics to a process and technology centric approach, with broader focus on Pillar II & III governance, data, disclosure and regulatory reporting requirements within a “business as usual” (BAU) target operating model.
Further challenges lie ahead, particularly in terms of ensuring data quality, meeting the Own Risk & Solvency Assessment (ORSA) and Use Test requirements, integrating financial and regulatory reporting, compliance and generating tangible business benefits from a Solvency II program. Key challenges
It has emerged from discussions with insurers from across Europe and in all market segments that these are the key Solvency II/IFRS related data management and reporting process challenges experienced to date:
Data Management Challenges
• Confidence in critical data – The European Insurance and Occupational Pensions Authority (EIOPA) requires that Solvency II data used in technical provisions be accurate, complete and appropriate! Do you trust the actuarial, asset, risk and finance data you have?
• Data quality – The data quality in many insurance companies is poor and much time and effort is already being spent on improve it – but is it enough?
• Metadata – Do you leverage a single Solvency II data dictionary and metadata model across all reporting purposes?
• Lineage & Audit - How do you demonstrate both internally and to the regulators data lineage and that you have a full audit trail across the financial, actuarial, investment and risk management systems and processes?
Reporting Challenges
• Reporting Processes - What is your regulatory reporting process and how can you automate it to reduce costs and improve close times? This is particularly important as the complexity of the reports is increasing while reporting timescales are decreasing.
• Business Benefits - How can you convert the Solvency II/IFRS from costly compliance exercises into programs that deliver tangible business benefits? This is primarily achieved by defining and sourcing the additional data needed to make better capital/risk based decisions.
• Integration - How can you leverage common technology, processes and resources across financial (IFRS) and Solvency II reporting projects?
A reporting cliff is created by the combined challenge of complex regulations, heightened governance requirements, interdependencies between IFRS and Solvency II and the daunting need for data. Insures must successfully scale the reporting cliff or bear the risk of slipping into a reporting quagmire. In the next section we will elaborate upon data management and reporting processes. As Solvency II is the regulation that has received the most attention to date, we will use it as the basis for detailing our options.
Challenges
Data challenges
Confidence in critical data
Solvency II requires that a plethora of actuarial, finance, investment and risk data be collected from multiple sources, transformed and consolidated. This data will then form the basis for meeting Solvency II reporting requirements – the Quantitative Reporting Templates (QRTs), Solvency and Financial Condition Report (SFCR) and Regular Supervisory Report (RSR). IFRS reporting will utilize some of this data, but additional data items will also be required. All the collected data is critical for management and regulatory reporting.
Extracting and collecting the data for Solvency purposes is just one aspect of the complexity; most insurers also struggle with the quality of the data itself. EIOPA sets down standards for data quality and requires insurers to ensure that data is accurate, complete and appropriate. EIOPA also requires a data directory and periodic data quality assessments. Thus data is critical from both an internal and a regulatory perspective. The illustration in figure 1 below shows the EIOPA data requirements that will be finalized in the Omnibus 2 Directive:
Figure 1. Data Quality Management Framework & Policy
QRT Templates
The complexity of Solvency data requirements is exemplified by QRT reporting. The full set of Group and Solo QRTs requires tens of thousands of data items, and the number grows with each additional Solo entity.
Moreover, the ORSA must make reference to the insurers’ risk management framework, including data quality standards and practices.
Data quality is not solely about quantitative data. Solvency II also requires a vast amount of narrative text for the SFCR, RSR and ORSA documents. These narratives and their supporting data are compiled by a variety of actuarial, investment, risk and finance personnel from different parts of the organization. Quality assurance entails more than simply drafting and approving the narratives; the underlying process must be addressed to ensure timely production, which is not easily accomplished. It is important to recognize that much of the data currently used in the arenas of risk, finance and actuarial services, is manually entered into spreadsheets and then undergoes significant manipulation. Going forward, data will have to be validated and signed-off at the appropriate level – hence the importance of implementing new processes to ensure data quality and approvals.
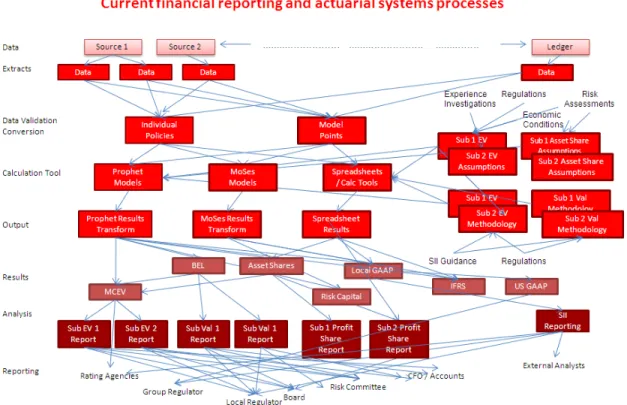
Insurers may use hundreds of actuarial models to produce data and they are often developed using different underlying systems and starting templates. Beyond the requirement to adapt these different models for Solvency II, there are additional requirements for extracting and transforming the model outputs required for QRT templates as well as other reports. The complexity of the task grows in proportion to the number of models deployed, each producing results with potential differences in variable names, level of granularity and output formats.
The complexity of the existing solution architecture oftentimes hinders the efficiency of processes to manage data and collate results, as illustrated in the Figure 2. The reality can be much more complex, especially in the case of large, multi-entity multi-product insurers.
Applying the Principle of Proportionality to Data
EIOPA provides the following guidelines for applying Proportionality to data:
•The degree of appropriateness, completeness and accuracy of data expected from the insurer should be consistent with the principle of proportionality and with the purpose of the analysis. •Analysis/valuation: For portfolios with underlying risks that are considered simple in terms of
nature, scale and complexity, “appropriate” would automatically be interpreted differently than in a situation where there are complex risks (since it would be expected that less data is needed to evaluate simple risks).
•Past data may become relevant in the future if the way in which the principle of proportionality applies for that line of business changes.
•Where the nature, scale and complexity of the underlying risks are high, companies should pay increased attention to the standards and requirements regarding data quality management. •In cases where there is not enough internal empirical data, efforts to look for relevant external
information to allow the understanding of the underlying risks and to use extensively adequate expert opinion and judgments are required.
Figure 2. Current Actuarial Spaghetti Data Management
Improving data quality
Although data collection is just the starting point of the Solvency II process, most insurers already struggle with data quality at this initial step. EIOPA requires insurers to ensure that data used for Solvency is accurate, complete and appropriate. Furthermore, the insurers’ data quality standards and practices have to be stated in the ORSA
Beyond the need to comply with EIOPA requirements, maintaining data quality is critical to prevent financial misstatements, which can be significantly amplified by cascading Solvency II calculations. This is illustrated in the example below.
Figure 3. Impact of poor data quality in Solvency II
The actuarial function above has a number of dependencies, including data quality. In this example, there is an error in the average age in the finance and administration department, which creates a bias. The employees in this department were all recorded as being 10 years older than their actual age. As a result of this error, the model predicts that people will die sooner, resulting in a change in the Loss distribution.
In such cases the loss distribution can shift left or right depending on the type of insurance product under simulation. When the distribution function shifts to the right, the best estimate (and thus the technical provision) and the SCR will be higher. The actual technical provision and SCR will be understated under these conditions. The consequences of this shift are presented in the table below:
POTENTIAL CONSEQUENCES OF UNDERSTATING TECHNICAL PROVISION POTENTIAL CONSEQUENCES OF UNDERSTATING SCR
• Pricing too low resulting in losses • Probability of default
• Risk of regulatory fines • Reputation risks
Had the average age been understated, the calculated technical provision and SCR would be too high. The consequences of this case are presented in the table below:
As shown in the example, the financial impact of misstating variables such as gender and age can be significant. In practice positive and negative errors tend to offset one another, but there is reasonable possibility that the overall results will have a positive or negative bias. Results can also be skewed through application defaults, for example when a system initializes the gender to be “male” or the birthday to “1-1-1900 in the absence of known data.
Metadata
As previously indicated, EIOPA requires insurers to create a data directory for Solvency II, that describes all the data elements used to meet the regulation. This is a sound practice, but we recommend that insurers go a step further and develop a common meta-data model for all the analytical data needed for the combined purposes of Solvency II, finance, and management reporting. The metadata model is essentially the blueprint for the underlying structure in which insurers hold their analytical data. This delivers significant business benefits by:
• Establishing a common business and data language across the organization for analytical data. • Facilitating the merging and combining of data, avoiding costly reorganizations of data at a later
stage.
• Ensuring that business users can get answers to all their legitimate business questions.
Business metadata is logically linked to technical metadata, which in turn is linked to XBRL for external reporting. It is important that data exchanged with external organizations adhere to a standard definition that enables regulators and analysts to compare and combine reports from multiple
organizations on a meaningful basis.
Lineage & Audit
In addition to the data management and data quality challenges associated with entering, storing and validating data from multiple sources, there is an additional requirement to be able to trace data used to populate reports. Compliance with Solvency II data lineage/audit requirements, as depicted in Figure 4, is complicated by the plethora of manual actuarial and finance processes that exist in most insurance companies.
Metadata Example
The power of metadata can be illustrated by a practical example. Typical insurance companies may have multiple legal entities, subsidiaries and branches with insurance portfolios rolling up to discrete product lines. The organizational structure determines the different data sources and each organizational unit potentially has its own nomenclature. To add to the complexity, finance, risk and actuarial services invariably have their own version of the base nomenclature as well. As a result, reconciling premiums between finance, risk and actuarial services can yield multiple interpretations of the same underlying data. Metadata enables a common understanding of data throughout the enterprise and also tracks any reclassification and/or restructuring of source data that occur.
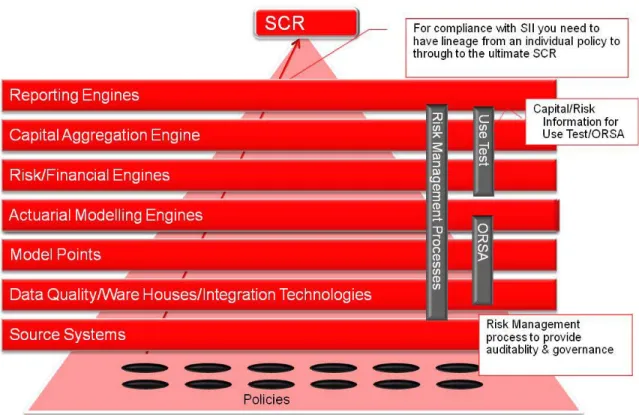
Figure 4. SCR Data Lineage Example
In theory, there should be full lineage from each insurance policy to the SCR figure through all the various processing layers. In practice this will prove difficult because the individual policy link is lost once policy data is processed through the actuarial engines. Nonetheless it should be possible to track all data that is input and output from the actuarial engine.
Reporting challenges
Reporting processes
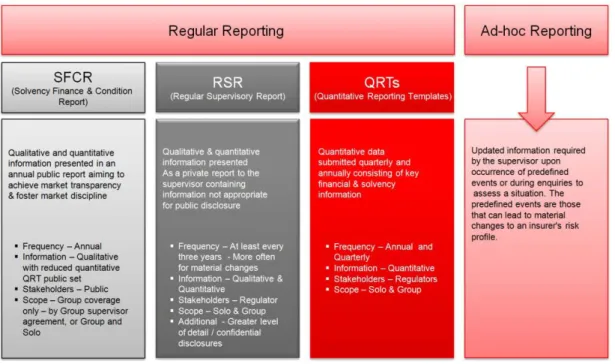
Solvency II will substantially increase the reporting workload, by requiring a new series of annual and quarterly regulatory reports, including new QRTs, SFCR and RSR - all of which must be submitted under challenging deadlines. The reports are defined by EIOPA, but local regulators may have
End to End Processes
Insurers must be able to show all aspects of the end-to-end solvency calculation process. This, in turn, implies that they must store all aspects of the calculation, including input data for parameter estimation, details of the statistical models, the model runs that provide input for the stochastic risk management and capital models, details of the assumptions that were included in the stochastic model runs, and the detailed output from the model runs themselves (sometimes called the database of the future). It is impossible to trace the end-to-end Solvency II process across multiple platforms and without storing all aspects of the calculation.
Figure 5. Solvency II Reporting Requirements
As the finance function is typically responsible for Solvency II reporting, it will need to rethink its operating model to enable faster reporting on a “business as usual basis” and enhance integration with other key functions, such as risk, actuarial and investment management.
Business Benefits
For most insurers, Solvency II implementation costs are justified as a compliance requirement. However as the costs are staggering, many insurers wish to see a return on the investment beyond mere compliance and leverage Solvency II to gain some form of competitive advantage.
The ability to drive business benefit stems from a better understanding of risk within the business and its relationship to capital. Achieving a better understanding of risk requires that accurate and timely information on risk and capital be accessible throughout the enterprise in a readily understandable format. This presents a number of challenges:
1.The business has to precisely define the information it requires to facilitate better decision making – no easy task!
2.The insurer has to put (actuarial) tools and models in place to generate the required information – which invariably requires new actuarial models
3.Data has to be stored, queried and made available to the business as a whole - which necessitates some form analytical data repository.
4.Insurers need to maintain the traceability of data moving to and fro between actuarial engines and the reporting engines- which will make manual adjustments/interventions processes more transparent
One must also reconsider the process of producing such business reports. Currently, too much “hand crafting” exists within business report production. Meeting the combined requirements of Solvency II and internal management reporting means that reporting teams will need to either ramp up resources or industrialize the reporting process to become more efficient. Data management technology is a fundamental enabler for automating the reporting process and making it efficient, which in turn translates into tangible benefit.
Integration
As regulatory reporting processes move into a “business-as-usual” mode under the control of finance departments, insurers are exploring ways to integrate financial and regulatory reporting. In some cases this means extending their existing financial reporting consolidation solutions to regulatory reporting. In others, insurers are seeking to leverage Solvency II reporting as a catalyst for implementing a new integrated financial and regulatory reporting system to replace existing disparate processes with significant manual intervention.
Practical solutions
Solutions to the data challenges
We believe that insurers should seize this opportunity to step beyond mere compliance and deliver real benefits to the business. By managing and understanding risk and better using risk information, insurers will be able to make more informed business decisions across functions ranging from product pricing and reinsurance to capital allocation and ultimately profitability.
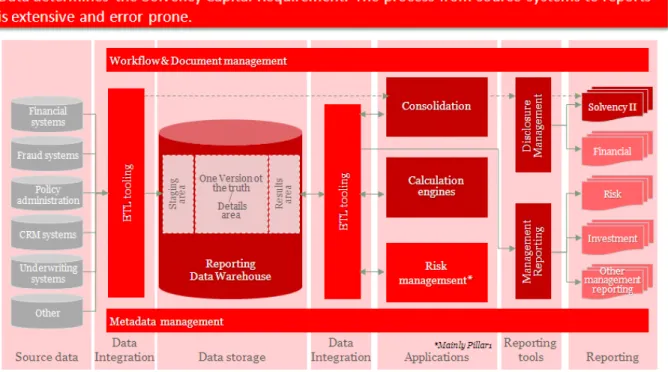
Addressing the challenges identified in this paper will require a new internal business model and organizations are rethinking their IT technologies and architecture for finance, risk management and actuarial services to support it. The following illustration represents the architecture insurers are striving to achieve. One of the key elements is the analytical repository, or data warehouse, which lies at the heart of process.
Figure 7: Data journey in Solvency II
We see the development of an analytical data repository that acts as single source of the truth to drive both regulatory and management reporting as the optimal means to address the reporting issues insurers are currently facing. In addition to providing a repository the overall solution must deliver the data quality, lineage, auditability and ETL capabilities required for corporate governance and Pillar II/III controls.
To illustrate the concept of an analytical data repository we reference the Oracle Insurance Data Foundation (OIDF). OIDF is a data management and storage platform that was specifically designed to meet the analytical data requirements for Solvency II as well as to support better business decision making.
The key features of an analytical repository such as OIDF are as follows:
1.Logical & physical data models for all types of insurance analytical data – which is primarily comprised of Actuarial, Asset, Financial and Risk data
2.Underlying metadata model that spans across all analytical data sources Analytical vs. Transactional Data Repositories
Risk analytical data repositories, as opposed to warehouses built upon specific transactional data, focus on building analytic reporting upon data that is already highly refined (I.e. the results from modeling and/or risk systems). Transactional data encompasses all policy, client and CRM data. A risk analytical repository is capable of performing business logic in addition to storing data. It needs to be able to aggregate data, do calculations (such as stresses) based on the data and transform data into appropriate feeds for actuarial and finance engines. This is very different to a transactional repository.
3.Staging and results area for the management, process flow and lock down of data 4.Integrated ETL, Data Quality, Auditability, Lineage and Approval tools
5.Integrated calculation engine with pre-built applications for such requirements as stress testing, operational risk, economic capital etc.
Whilst the OIDF is designed to operate independently, it is recognized that insurers have existing components and tools that meet their needs. In addition to operating on a standalone basis, the OIDF can integrate with any existing transactional warehouse and data management tool such as Informatica, Oracle Data Integrator (ODI) and actuarial engines.
Perhaps the greatest advantage of a centralized analytical repository is that it enables the data stored for Solvency II to be leveraged for the benefit of the entire organization. There is considerable overlap between the data used for risk and capital management purposes and that required for other business purposes, such as actuarial pricing and product development, reserve calculations, underwriting selection, and reinsurance optimization. Therefore investing in a solution such as OIDF inevitably creates business benefit in other areas over time.
Data Integrity
Implementing a central analytical repository such as OIDF will improve the organization’s confidence in its critical data. This is because the data management process will be better controlled.
• Extracted data will be subject to a range of industry standard and user defined quality checks – this coupled with the approach should provide a significant improvement in quality.
• The tools associated with the repository provide full lineage and audit capabilities. Thus the auditors and the regulator can drill down and see where data has come from, what quality checks have been undertaken and who approved the data.
• There is capability for authorized users to view and approve data, and if necessary “lock-down” data sets.
• Users can slice and dice the data in numerous ways to check its suitability and validity.
• Perhaps the most important aspect of an analytical repository such as OIDF is the fact that it has a pre-built logical and physical data model. In the case of OIDF we believe that in excess of 80% of the analytical data that an insurer requires is present. No data model though can meet all an insurer’s
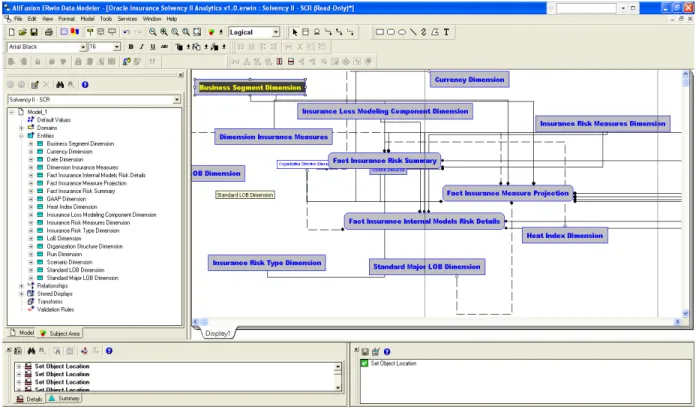
The ability to extract and transform data from multiple source systems is critical to the Solvency II reporting process. Many insurers already use an existing ETL tool for this purpose, such as Informatica or ODI from Oracle. These tools can import data in multiple formats and provide data reconciliation, validation, and certification as standard features. They also provide full data drill through with complete audit trails and drill back capabilities. Data can be sourced in multiple formats with both configurable automated uploads and data entry.
Figure 8: Pre-built data model in OIDF that relates to SCR
Four step data quality approach
To improve data quality in underlying core systems (that feed the analytical repository) the following 4 phase approach can be used.
Phase 1: Measure
Prior to embarking on a program to improve data administration, the insurer must first know where to focus as the number of data elements and systems involved can be considerable.
• The first step is to create insights in the data elements that impact the Technical Provision and the SCR (for the sake of simplicity, only the SCR is mentioned in the rest of this section and TP should be handled similarly). In general, existing metadata dictionaries can be leveraged.
• Once the elements impacting SCR are identified, the insurer should assess which controls (both internal as well as external) are needed to ensure data quality
• The third step is to determine the level to which data elements impact the SCR. This can be
accomplished by organizing expert meetings involving actuaries, business decision makers and the IT department. Simplified models can be used in this step.
The insight built up in the previous steps can be used to help prioritize the data elements and systems that need to be reviewed.
Measuring the quality of data administration can be achieved by a combination of: • Data analysis
• Smart sampling
Data analysis is generally preferred over sampling as it usually requires less effort. Furthermore, data analysis scripts can be rerun where available to repeat the analysis.
Phase 2. Improve
After the insurer has precisely determined the quality of the data and where the deficiencies lie, the process should be improved to minimize the potential for errors occurring in the future.
Information from “smart samples” can be used to improve data analysis. When data analysis is producing multiple errors, it can be implemented in production systems and system controls. The final step in this phase is to adjust the product and market mix; when certain products create more issues than insights they should be avoided.
Employee behavior is also an important aspect to consider. When employee performance is measured by the quantity of mutations rather than the quality of mutations, it will motivate employees to focus on producing as many mutations as possible and detract attention from quality.
A further advantage of focusing on quality upfront is to get things right in the first time and avoid rework.
Phase 3. Clean up
In the clean-up phase, the insurer needs to decide which errors will be addressed. The actual data cleansing should be carried out according to priority.
determining the feasibility and effort needed for data cleansing, the impact on the SCR and the potential for reputational damage.
Data cleansing can be done automatically or manually.
Automaticcleansing: An example of automatic cleansing within the OIDF is the Oracle Financial Services Analytical Applications Infrastructure (OFSAAI), which leverages a Data Quality (DQ) Framework to define and execute rules to query, validate, and correct data. The OIDF comes pre-populated with a set of Data Quality rules that can be readily supplemented with rules that are specific to an insurers needs in relation to their underlying source data.
Manual cleansing: Not all cleansing can be done automatically. Manual cleansing is also required that is very time consuming. It is therefore essential to have a process in place to identify these errors and define the processes for manual intervention.
Phase 4. Monitor
Data quality should be consistently monitored to ensure that quality improves and remains at an acceptable level. Monitoring should also be used in the cleansing phase to measure the effects of the data cleansing.
Multiple tools exist for monitoring data quality, including the OFSAAI Data Quality Framework. Data sampling can also be carried out to gain additional assurance and insight into data quality. Sampling should be embedded into processes as part of the data governance framework.
Ultimately data monitoring will be used for financial audits as well as meeting EIOPA Solvency II requirements.
Metadata solutions
Metadata and metadata management data are critical to the successful deployment of an analytical data repository across multiple analytical functions. For example, OIDF has built-in metadata capabilities with the following features:
• Pre-built metadata model that is comprehensive and ready to deploy
• User friendliness that enables business users to understand and manage the analytical repository and masks the complexity of the underlying OIDF Data Model
• Trace and manage data flow capabilities from source to results • Impact analysis of model changes
• A rich, business metadata layer that provides a common and unified business language across the entire analytical applications footprint
• Rapid deployment of new or extended applications by implementing only those data elements that are required within a specific application or group of applications
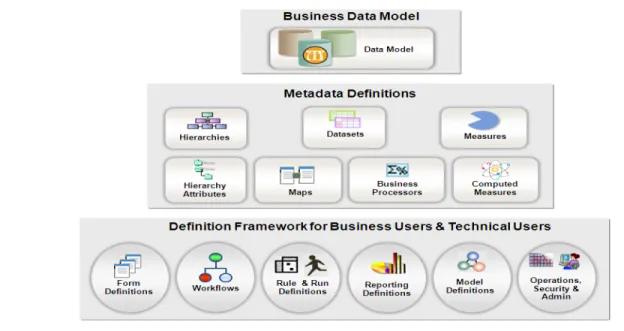
The diagram below illustrates the interaction between the metadata and the data model in OIDF.
23
Figure 10: Interaction between the metadata and the data model in OIDF
Lineage & Audit solutions
With the concept of a centralized analytical repository such as OIDF it is possible to provide full lineage and audit trails for all data. Auditability is extended by a look though capability to data source systems and the ability to store Excel spread sheets. It is also possible to record the approvals processes for a data set and provide reports.
The ability to track and audit data sets, record approvals and generate relevant reports is essential for good governance and the ability to demonstrate sound data governance practices to the regulator.
Group Data Consolidation
The importance of auditing and tracking data changes in group consolidations also needs to be emphasized. Managing data at the group level is significantly more complicated than at the solo level due to barriers that often exist between data auditors and business users. A centralized view of data across the entire group ensures consistency between the data used to calculate solvency capital in decentralized entities and the head of the group. This approach supports the auditing process, especially when the regulator makes enquiries such as “Who changed the data in this entity, and why?” Or “Did the group-level calculation involve the new or the old version of the data?”
Solutions process challenges
Reporting processes solutions
To drive consistent reporting, many insurers are striving for a single source of the truth across the organization, which in reality often means an analytical repository. It is critical to ensuring that the data used for regulatory disclosure can be readily reconciled to the data used for local/solo and group internal and external financial reporting. This should significantly reduce the amount of time and resources that finance and actuarial teams are spending on reconciliation.
In practice many insurers will have to implement a new analytical data and reporting infrastructure. A robust infrastructure to support efficient Solvency II/IFRS reporting should:
• Contain the Solvency II/IFRS reporting processes and work flows with the relevant audit, lineage and security controls;
• Aggregate and consolidate data from multiple sources and entities; • Support a data quality framework and policy;
• Have the capability to handle quantitative data in combination with a large amount of narratives; • Manage intergroup transactions, equity eliminations, currency conversions and computations
required for the QRTs – e.g. SCR/MCR calculations;
• Produce physical reports, dashboards and XBRL output for the regulator;
• Integrate with the insurer’s annual financial reporting and IFRS Phase 4 processes. The reporting process presents three major challenges:
1.Identifying all the data required, sourcing the data, transforming it and finally aggregating and consolidating that data. This is primarily performed by the analytical repository that provides data needed for the reports.
2.Combing quantitative data with the narratives for more textual based reports – e.g. SFCR. Whilst the data will be stored in the repository, some form of reporting engine is required to formulate and generate the report. The reporting engine is intrinsically linked to the analytical repository
3.Executing the underlying reporting process. This is particularly complex as both quantitative and qualitative data is required from various actuarial, finance, asset and investment functions within the business for producing reports at both solo and group levels. The process can literally break down into hundreds of tasks and sub-tasks. Given the pressure on close timescales, insurers ultimately need to automate and incorporate controls in the underlying reporting process. This essentially requires that a workflow engine be embedded into the process. Several financial consolidation engines, such as Oracles’ Hyperion engine, have built in flows specifically designed for reporting. Alternatively, an existing work flow engine might be linked to the repository and utilized.
Driving Business Benefits
As previously highlighted, some insurers are justifying the cost of the Solvency II project as a
compliance exercise. However in light of the considerable expense, many insurers will also wish to see a greater return on the investment by leveraging Solvency II to gain some form of competitive advantage.
Driving business benefits is principally achieved by gaining a better understanding of risk within the business and its relationship to capital. To acquire this understanding, you need accurate and timely risk and capital data, as well as the ability to make it available to the business in a readily understandable format.
Reporting Capability
The ability to produce regulatory and internal reporting is critical for both Solvency II and IFRS. Regulatory reporting must fully comply with prescribed requirements and the reporting engines must produce narrative output as well as XBRL for the regulators.
The data needed for Solvency II reports is preferably stored in an analytical repository. Alternatively, a reporting engine can link directly to the underlying financial consolidation and actuarial engines.
Whilst regulatory reporting is important, many insurers are seeking to derive business benefits beyond compliance from their Solvency II programs. This essentially boils down to gaining a better understanding of risk and allocation of capital, and to achieve this insurers must define precisely the information they need, adapt their actuarial and financial engines to produce it, store the data in an analytical repository and generate the reports. The reporting engine must support a wide variety of needs and formats, but can only produce meaningful reports if the appropriate data is available.
The diagram above illustrates how an analytical repository can be utilized to store not only regulatory data but also the data required to support decision making within the business. This operates at two levels; firstly to provide the capital/risk information to support the Use Test and secondly to provide information to support the business in other areas - for example:
• Better use of Reinsurance
• Alternative Risk Transfer mechanisms • Profitable Capital allocation
• Product and pricing strategy • Business transformation/expansion • Mergers and acquisitions
• Investment strategy
• Maintaining adequate ratings
Integration of Solvency II and Financial Reporting
The finance departments in most insurance companies use a financial consolidation engine, such as Oracle’s Hyperion Financial Management, to generate both their financial and IFRS reports. In most cases, finance will also be responsible for Solvency II reporting and leverage a common consolidation engine to produce all reports. We believe this is the right approach as it offers significant advantages: reinforced consistency between reporting regimes, standardization on common business processes and enhanced communication throughout the organization.
Whilst a consolidation engine can operate independently of the analytical repository (as shown below) we believe that it is beneficial to implement an integrated solution to reinforce consistency, data lineage, auditability and governance, as required by Solvency II.
Beyond regulatory reporting
By leveraging an analytical repository, Solvency II programs can readily be extended to meet additional management reporting objectives. In light of the delay in Solvency II implementation, many insurers are refocusing on other challenges and if they have adopted an analytical repository strategy their solution will be extendable to meet both their management objectives and regulatory reporting requirements once finalized.
Some of these additional solutions are described below:
Actuarial Model Data Management
Actuarial models produce vital input for Solvency II reporting and actuarial applications such as MoSes, Prophet, Igloo and ReMetrica have traditionally been desktop based systems that are solely in the domain of the actuarial department. Controls around input data, assumption files, and model versioning have been quite rudimentary and manually performed. This must change under the Solvency II regime and can be remedied by extending the scope of an Analytical Repository to the actuarial domain.
With this approach the analytical repository can be leveraged to:
• Store and manage actuarial model inputs, such as mortality tables, ESG files, assumption sets, run parameters etc.
• Manage and version control model inputs • Store model versions and model results • Provide audit, security and lineage controls
In addition to these benefits, the technical performance of a modern analytical repository will vastly outperform desktop based systems and create new scenario analysis opportunities.
The adoption of mainstream enterprise technology managed by IT is in itself is a major step towards Solvency II compliance. It will also to some degree transform the actuarial practice.
Financial Consolidation Engines
As previously highlighted, Solvency II reporting requires complex interactions between financial, actuarial and risk data, and many insurers plan to manage this complexity with a financial consolidation engine Leading solution providers have enhanced their financial consolidation engines to meet the requirements for QRT solo and group reporting templates as well as the SFCR and RSR templates. Other key Solvency II reporting functionality provided by a consolidation engine includes group consolidation, inter-company reconciliation and eliminations and full currency conversion. Best in breed applications also address industry specific IFRS, Local GAAP and other reporting regimes including internal management reporting.
Technical provisions and other actuarial calculations are important aspects of Solvency II reporting. They are usually calculated in actuarial engines such as MoSes, Igloo, Prophet and ReMetrica, prior to being imported into a financial consolidation engine. A more advanced solution is to store actuarial results in an analytical repository as an intermediary step.
Enterprise Risk Management
Similarly to actuarial data, risk, operational management and compliance data can be added to the analytical repository. In addition, as an alternative to or as a check on third party risk aggregation engines, risk aggregation analytics can be performed within the financial consolidation engine using the standard formula calculations included which are typically included. These analytics can be extended to meet company specific requirements.
Using the business intelligence reporting tools, risk dashboards can easily be created leveraging the same data as used in regulatory reporting thereby ensuring consistency and resource efficiency savings.
Key Conclusion
The magnitude of regulatory change in the insurance industry is putting enormous pressure on the entire organization, and especially on the Actuarial, Finance and Risk functions. These departments are already saddled today with poor data quality and sub-optimal processes. The new wave of regulatory requirements makes the reporting cliff even higher.
However running into this cliff can be avoided, provided that the underlying issues relating to data management and the reporting processes are addressed.
The key challenges for data management relate to data availability, data quality, the metadata model and the lineage & audit. From a reporting processes perspective, the overriding challenge is to
establishment of a single version of the truth and the stakes are heightened by demanding closing timelines.
In order to overcome these challenges the following steps are needed: • Create confidence in critical data
• Improve data quality • Implement good metadata • Create data lineage
• Once the data is trustworthy, technical solutions can be implemented to monitor, sustain and leverage this asset:
• Implement an analytical data warehouse
• Implement the reporting processes as an integral part of the analytical data warehouse • Proactively fulfill ORSA and Use Test requirements
• Fully capitalize on the business benefits offered by Solvency II • Integrate the Solvency II and IFRS processes.
All of these solutions have been detailed in the previous chapters.
Although many challenges remain, the time and solutions are available to overcome them. For insurers the moment is now to act or to have a deeper look at the reporting cliff.
Avoiding the Insurance Reporting Cliff March 2013 Oracle Corporation World Headquarters 500 Oracle Parkway Redwood Shores, CA 94065 U.S.A. Worldwide Inquiries: Phone: +1.650.506.7000 Fax: +1.650.506.7200
Copyright © 2013, Oracle and/or its affiliates. All rights reserved. This document is provided for information purposes only and the contents hereof are subject to change without notice. This document is not warranted to be error-free, nor subject to any other warranties or conditions, whether expressed orally or implied in law, including implied warranties and conditions of merchantability or fitness for a particular purpose. We specifically disclaim any liability with respect to this document and no contractual obligations are formed either directly or indirectly by this document. This document may not be reproduced or transmitted in any form or by any means, electronic or mechanical, for any purpose, without our prior written permission.
Oracle and Java are registered trademarks of Oracle and/or its affiliates. Other names may be trademarks of their respective owners.
Intel and Intel Xeon are trademarks or registered trademarks of Intel Corporation. All SPARC trademarks are used under license and are trademarks or registered trademarks of SPARC International, Inc. AMD, Opteron, the AMD logo, and the AMD Opteron logo are trademarks or registered trademarks of Advanced Micro Devices. UNIX is a registered trademark licensed through X/Open