TOWN OF FALMOUTH
HOUSING DEMAND STUDY &
NEEDS ANALYSIS
Town of Falmouth – Falmouth Housing Trust
Odd Fellows Hall: Site of Proposed Local Initiative Program (LIP) 4-Unit Affordable Rental Development
I.
Executive Summary ... 1
A. Key Findings ... 2
1. Demographic (*Chapter 2) ... 2
2. Housing Supply and Demand (*Chapter 3) ... 3
B. Key Issues ... 5
1. Local Capacity (*Chapter 4) ... 5
2. Community Development (*Chapter 4)... 6
3. Planning and Land Use (*Chapter 4) ... 7
II.
Demographic Profile ... 9
A. Key Findings ... 9
B. Population Characteristics ... 10
1. Population Growth and Change ... 10
2. Population Age ... 10
3. Race, Ethnicity, and Culture ... 11
4. Geographic Mobility ... 13
C. Household Characteristics ... 13
1. Household Types... 13
2. Householder Ages ... 15
3. Household Size and Composition ... 15
4. Family Characteristics ... 16
5. Households and Housing Tenure ... 16
6. Income and Poverty ... 17
D. Group Quarters Populations ... 20
E. Economic Characteristics ... 20
1. Labor Force and Unemployment ... 21
2. Establishments ... 21
3. Employment ... 21
4. Seasonal Changes in Jobs and Labor Force ... 22
III.
Local Housing Conditions ... 25
A. Key Findings ... 27
B. Housing Supply and Vacancy Trends ... 29
1. Overview ... 29
2. Permit Activity ... 31
3. Chapter 40B Subsidized Housing ... 31
C. Residential Property Characteristics ... 33
1. Trends in Residential Parcels and Assessments ... 33
2. Residential Components of the Tax Base ... 35
3. Housing Characteristics of Falmouth Neighborhoods ... 36
4. Single-Family and Other Residential Properties by Ownership and Values ... 37
5. Post-1980 Housing Production ... 39
D. Homeownership Characteristics ... 41
1. Homeowner Households by Age ... 41
2. Homeowner Household Incomes ... 42
3. Value of Owner-Occupied Housing ... 43
4. Owner Households by Period Moved into Unit ... 44
E. For-Sale Market ... 45
1. Single-Family Sales ... 45
3. Short Sales ... 48
F. Renter Households Characteristics ... 49
1. Renter Households by Age ... 49
2. Renter Households by Income ... 50
3. Renter Households by Rent ... 51
4. Renter Households by Period Moved into Unit ... 52
G. Rental Market Conditions ... 53
IV.
Issues & Opportunities ... 55
A. Housing Needs ... 56
B. Housing Preservation ... 58
1. Modest Housing ... 58
2. Monitoring and Enforcement ... 59
3. Expiring Use Restrictions ... 61
4. Housing Coordinator ... 62
C. Zoning for Housing Choice ... 62
1. Inclusionary Zoning ... 63
2. Other Regulatory Techniques ... 64
D. Development Review, Permitting, Roles & Responsibilities ... 66
1. Educational Opportunities ... 66
2. Comprehensive Permit Guidelines ... 67
E. Local Resources for Affordable Housing... 68
F. Local Capacity ... 71
V.
Information Resources ... 73
I.
EXECUTIVE SUMMARY
Falmouth is one of four towns located in the Upper Cape section of Cape Cod. As host community for Woods Hole Oceanographic Institute (WHOI) and other marine research organizations, Falmouth has both special qualities and unique challenges. On one level, Falmouth functions as a specialized sub-regional economic center, yet on another level, it has a limited employment base and a small labor force for a town of its size. Falmouth also has many well-preserved historic structures, scenic features, and coastal resources that contribute to its beauty. However, the very beauty that makes Falmouth so appealing also masks the degree of economic hardship that exists in the town, especially in East Falmouth.
The concerns that led Falmouth to prepare this housing study are shared, at least to some extent, by its neighbors and the Cape as a whole. The interdependence of education, housing, jobs, and living wages is not lost on policymakers anywhere on the Cape, though the region’s imbalances occur in different degrees from town to town. Falmouth’s attractiveness to retirees, small employment base, comparatively low wages, and limited housing options have made it increasingly difficult to lure and keep young people. On these points, most observers seem to agree. Most observers seem to agree about the need for decent rental housing, too. Nevertheless, there are noticeable disagreements about the roles and responsibilities of local government, other public agencies, and private organizations; what “housing affordability” actually means in Falmouth; and the best ways to reduce housing barriers. Unless the groups with an interest in housing policy settle their disputes and work together as a team, Falmouth will find it difficult to move forward with a coherent, effective plan for fair and affordable housing.
At the heart of any housing plan or strategy are questions about need: who needs housing? Who needs to be creating, regulating, managing, maintaining, monitoring, and protecting the supply of safe, decent, and sanitary affordable housing – and who needs resources to carry out these tasks? As used in this report, housing need refers to households lacking their own housing or living in units that are unsuitable for the size and composition of their households, or who cannot meet their needs in the housing market without some assistance. Housing demand is the quantity and type/quality of housing that households want to purchase or rent and are able to afford. Housing market areas are geographical areas that are relatively self-contained in terms of housing demand, i.e. a large percentage of people moving or settling in the area will have sought a dwelling only in that area.
The purpose of this report is to help Falmouth understand the needs that exist in the community, the market dynamics and other factors that contribute to those needs, and opportunities to address the town’s unmet needs despite the power of market forces. It is undeniably true that Falmouth’s Cape Cod location plays a significant role in defining the
There are noticeable disagreements about the roles
and responsibilities of local government, other
public agencies, and private organizations …
unless groups with an interest in housing policy
settle their disputes and work together as a team,
Falmouth will find it difficult to move forward
with a coherent, effective plan for fair and
affordable housing.
local housing market. However, communities do influence the make-up of their populations by the choices they make to control housing development, even on Cape Cod. Falmouth is no exception. An economy cannot thrive without the capacity to house workers at a variety of skill and wage levels. In Falmouth, housing is an issue both for social equity and an economic development.
A.
KEY FINDINGS
1.
Demographic (*Chapter 2)
Between 2000 and 2010, Falmouth’s year-round population decreased by 3.5 percent,
much like Barnstable County, but all of Falmouth’s Upper Cape neighbors experienced population growth.
The projected population growth rate for 2018 is 1.4 percent for Falmouth and 2.1 percent
for Cape Cod.
The average household income in Falmouth exceeds that for Cape Cod, although the
percent change is similar. The number of households earning less than $50,000 has decreased since 2000 and will continue to decrease (2018) both for Falmouth and Cape Cod.
Both median household and per capita incomes in Falmouth are greater than Cape Cod,
though historic and projected rates of income growth are similar. The rates of growth in the number of households are similar, too, with Falmouth households accounting for about 13 percent of Cape Cod households.
More households are projected to earn $100,000 or more, from 26 percent of the Falmouth
households in 2010 to 32 percent in 2018. For Cape Cod as a whole, 24 percent of all households earned $100,000 or more in 2010; this is expected to reach 30 percent by 218.
In Falmouth, about 32 percent of all homeowner households moved into their unit over
the last decade. This equates to an annual average of approximately 370 owner households per year, indicating an annual turnover rate of 3.4 percent.
The number of homeowner households fell slightly over the last decade, but major
changes occurred in age and income groups. Most of the increases occurred in the three cohorts, age 55-and-older, as a result of attracting new retirees or the aging in place of the existing elderly. These increase came at the expense of the loss of owner households in the three cohorts younger than age 55. As a result, approximately two-thirds of the year-round owner households were age 55-and-older including 20 percent age 75 and older, while owner households younger than age 35 decreased to less than 4 percent of owner households in 2010.
The median homeowner household income, $70,350 in 2010, has increased by 29 percent
since 2000. The number of homeowners earning less than $75,000 decreased over the last decade, while increases were indicated for owners in the income groups earning $100,000
or more. These changes varied between census tracts. For example; homeowners earning less than $50,000 accounted for 52 percent of all homeowners in Tract 148.
Most of Falmouth’s employed residents work locally. Many parts of Cape Cod tend to
have large percentages of people who live and work in the same community (larger than the statewide average of 31.6 percent), but Falmouth has an unusually large percentage of local workers (59.7 percent). Much of this can be attributed to Woods Hole and, to a lesser extent, large local employers like Falmouth Hospital and allied health care providers.
2.
Housing Supply and Demand (*Chapter 3)
Since 2000, nearly all residential construction in Falmouth has involved single-family
homes and condominiums, though it appears that a small increase in two- and three-unit structures and mixed-use properties occurred as well.
The supply of single-family homes, condominiums, small multi-unit buildings, and
properties with multiple dwellings includes a combined total of about 20,970 units. Together, they are characterized as selected residential properties in this report: selected because they lend themselves to comparative analysis, which is not really true for large investor-owned apartment buildings. The selected residential properties represent about 94.5 percent of Falmouth’s entire housing supply (22,200 units).
Approximately 39 percent of the selected residential parcels were built within the last 35
years or since 1980, including 10 percent built since 2000. About 24 percent of the multi-unit parcels were developed since 1980, but only 8 percent since 2000. Housing production over that last few years slowed considerably in comparison with activity in the 1980s or late 1990s.
HOUSING VALUES
The assessed value of residential properties more than doubled over the last decade, but
a decrease was evident after 2010. The assessed value of residential properties represents over 92 percent of Falmouth’s tax base, so housing is a very important source of revenue for the town.
According to estimates from the Census Bureau, the median value of owner-occupied
housing (all housing types) in Falmouth is $428,200, but the median varies considerably between census tracts. Moreover, the Census Bureau estimates that less than 4 percent of the owner-occupied housing in Falmouth is valued below $200,000: a sale price that would be affordable to many moderate-income people. Another 15 percent falls in the $200,000
The Census Bureau estimates that less than 4
percent of the owner-occupied housing in
Falmouth is valued below $200,000: a sale price
that would be affordable to many
moderate-income people.
to $300,000 range, and over 80 percent of owner-occupied housing is valued at $300,000 or more.
These statistics appear to be supported by the assessor’s parcel data, which indicate that
36 percent of the select residential parcels were valued at less than $300,000, including 21 percent used as a local residence. The assessor’s database also indicates that the average assessment of single-family parcels town-wide is $481,300, but again, the average varies by neighborhood and in some cases quite significantly. Land assessment for single-family homes accounted for 56 percent of the total, town-wide, but in selected neighborhoods influenced by the water, land values are much higher.
According to the assessor’s database, the supply of residential properties valued at less
than $200,000 – that is, properties that would probably be affordable to a moderate-income homebuyer – accounts for over 7 percent of the selected residential properties. Almost half are seasonal homes or rentals. This supply is concentrated primarily in five of Falmouth’s eighteen neighborhoods. Fifteen percent of the selected residential properties have a value in the $200,000 to $250,000 range, and another 14 percent in the $250,000 to $300,000 range. The remaining 64 percent are assessed at over $300,000, and only 47 percent are occupied as a residence.
SEASONAL HOUSING
The supply of seasonal housing may have increased by 10 percent or so since 2010, for the
assessor estimates that Falmouth has 7,800 seasonal units today compared with 7,100 seasonal units reported in Census 2010. The assessed value of second homes is generally higher than that of year-round residences. Assessments vary by neighborhood, with Pinecrest, Teaticket, and Ashumet being the most affordable.
If the number of seasonal homes has increased as suggested by data from the assessor’s
office, Falmouth’s actual Chapter 40B “shortfall” may be smaller than it appears, given that the official percentage is based on federal census data, not records of the local assessor. Any change in seasonal housing will not affect Falmouth’s Chapter 40B status until Census 2020.
While an increase in seasonal homes may reduce the Town’s 10 percent minimum under
Chapter 40B, the same condition exacerbates the problems caused by a limited supply of affordable housing. This is because in general, seasonal homes are often more valuable and less available to low- or moderate-income homebuyers and renters.
HOUSING SALES
The for-sale market showed signs of improvement as the number of sales of single-family
homes and condominiums increased in the last few years, and conversely the number of short-sales decreased. On average, approximately 57 percent on the single-family sales over the last five years were bought by a non-local owner, which further increased the supply of seasonal housing, or reduced the year-round supply. In most cases, the median prices paid by non-local buyers were 10 to 25 percent higher than local buyers paid for single-family homes. The reverse however was indicated for condominiums as local
buyers, which accounted for 50 percent of the sales activity, paid 20 percent more than non-local buyers in some cases. Local buyers also outnumbered non-local buyers for short-sales; however, some were converted to rentals or subsequently resold. Short-sales represented about 12 percent of total activity on average over the last five years, but activity over the last year represented less than 3 percent.
The median single-family sale price in 2014 was $385,000 and only seven out of 18
neighborhoods have a median below this level. For condominiums, the median price in 2014 was $362,500 and only three out of eight neighborhoods have a median value below this level. The number of current listings for single-family and condominiums at less than $500,000 represented less than a one-year supply in most cases; however, properties listed in excess of $500,000 indicate a two-year or more inventory based on historic activity.
RENTAL HOUSING
Renter households increased by eight percent over the last decade, accounting for almost
24 percent of occupied housing but only 15 percent of total housing in 2010. An estimated 84 percent of the renters in Falmouth moved into their unit over the last decade, and indicated a renter turnover rate of 9 percent. The median income level for renter households was $33,480 in 2010, and it would support rent of $840 to be affordable. However, the median gross rent was $960, and over 20 percent of renters incurred rents of $1,500 or more, while 26 percent paid $1,000 to $1,499. A sample of current rents indicated a median rent of $1,200 and in most cases the median rent from the sample was fairly similar to Fair Market Rent, determined by HUD.
The rental market in Falmouth is more informal and affected by seasonal influences. Most
of the rental stock was contained in single-family homes and to a lesser extent small 2-or-3 unit properties whose owners sometimes charged lower rents to keep long-term tenants. Second homes were reportedly rented out as well as owner residences to help defray housing cost during the off-season. In other words the rental market was more dynamic during the season than in the off-season, and as such difficult to quantify, since pricing and availability fluctuates throughout the year.
B.
KEY ISSUES
1.
Local Capacity (*Chapter 4)
Collaboration: There is considerable tension in Falmouth, especially tension about
housing. None of the ideas contained in this report can be carried out without a significant improvement in relationships between citizen activists, developers, staff, and town officials. Everyone has a role to play and everyone can help, but the Town and private organizations need to work on trust-building. They should identify where the greatest capacity and expertise are for a variety of housing strategies, collaborate, and share information and resources. A summit of the key people with an interest in housing policy (elected and appointed town officials, town staff, and private groups) to work on a strategic plan with someone trained in facilitation and conflict resolution would be a wise “first step” toward forging better relationships. The Planning Board and Board of
Selectmen have already been working to improve communications and coordinate their efforts. A similar initiative is needed with the Affordable Housing Committee and possibly the Community Preservation Committee, and others.
Use of Housing Development Resources: Falmouth has an affordable housing fund that
was created by a special act of the legislature in 2011. It needs to be reconceived because it does not provide all of the powers and duties that a board needs in order to create or facilitate the production of affordable housing. A better model than the structure created by Falmouth’s home rule petition is the Municipal Affordable Housing Trust law that went into effect in 2004. The Town (by Town Meeting vote) would need to adopt the provisions of G.L. c. 44, c.55C and also adopt a local implementation bylaw.
2.
Community Development (*Chapter 4)
Housing and the Local Economy: Many people in Falmouth seem to recognize, at least
intuitively if not from experience, that housing affordability is an economic development issue. A shortage of affordability hinders job growth and employee recruitment and retention. The absence of a diverse labor force will discourage prospective employers from doing business in Falmouth and prevent business growth for the Town’s limited number of existing employers.
Housing Needs: Falmouth’s housing needs are not limited to the number of affordable
units required to meet the 10 percent statutory minimum under Chapter 40B. While knowledgeable residents, town officials, and staff understand this, the general public may not. It could take considerable public education and a united front to build support for land use policy changes that would create more housing without ensuring that the additional units will “count” on the Chapter 40B Subsidized Housing Inventory (SHI). Efforts to provide for more housing diversity through zoning amendments may be met with some resistance.
Seniors. Falmouth’s housing market is increasingly dominated by older homeowners who
find the town’s scenic beauty and amenities very appealing. Many of them may have summered in Falmouth and eventually chose to retire here, but others are relative newcomers. The presence of an increasingly large percentage of residents over 55 years may imply that Falmouth does not have any senior housing problems, but the opposite is actually true. Falmouth has a shortage of affordable, suitable housing both for retirement-age residents and frail elders. Developing this kind of housing is very difficult because seniors who need affordable housing often need deeply subsidized housing.
Housing Preservation: Falmouth has at least three types of housing preservation needs.
First, the Town still has some small, older homes – some of which are substandard – with relatively low tax assessments. Since these lower-value properties are not subject to any type of deed restriction, they will most likely be altered, expanded, or torn down and rebuilt because land values are so high.
Second, Falmouth has affordable units that “count” on the SHI, yet there is no systematic monitoring process in place to ensure that the properties comply with their affordable housing deed restrictions. There are different monitoring agents for different projects and, it seems, some confusion about who is actually responsible for monitoring the units.
Third, just over 16 percent of the units on Falmouth’s SHI are subject to expiring use restrictions that are scheduled to lapse in the next ten years. The restrictions may be extended (as often happens with rental housing), but the Town needs to monitor these projects and develop working relationships with the owners. There may be opportunities for Falmouth to intervene and provide financial support to extend the term of affordability, as other towns have done.
3.
Planning and Land Use (*Chapter 4)
Zoning: Falmouth’s predominantly single-family residential zoning is not designed to
encourage a mix of housing, especially the small rental units that many people say the Town needs in order to attract and keep young workers. The vast majority of the town is zoned for large-lot residential development, and existing zoning provisions for affordable housing have not worked.
Zoning effectively creates or constrains land by regulating how much development can occur as of right. Falmouth does have options for allowing a broader range of housing types and making it easier to create them, but it is not clear that enough broad-based community support exists to bring them to fruition. Overall, the central policy of the Falmouth Zoning Bylaw seems to be limited change – and tightly controlled change when it does occur. The Zoning Bylaw did not happen in a vacuum. It expresses the will of the Town over a very long time.
Land for Multifamily Housing. Falmouth has little if any land zoned for multifamily
development. To provide for more types of housing in a broader range of price points, Falmouth needs to “create” land by zoning for a mix of housing types. The other option is to recruit and work with Chapter 40B developers, thereby “creating” land through comprehensive permits.
Development Review, Permitting, and Roles & Responsibilities: There are complaints in
Falmouth about the time required to obtain permits and approvals, lack of coordination in the permitting process, and onerous or unpredictable requirements. Falmouth should examine how it conducts land use permitting, as many towns do from time to time. Just as town boards would benefit from an assessment of how their procedures are actually working, there seems to be a need for public education about the roles and responsibilities of town boards and the permitting framework within which they operate. Sometimes
Falmouth has options for allowing a broader
range of housing types and making it easier to
create them, but it is not clear that enough
broad-based community support exists to bring them to
fruition.
what appears to be a needless delay is actually the normal course of a public hearing and decision process. Similarly, sometimes town officials need to remember that their job is to administer the community’s land use regulations – and the state’s Chapter 40B regulations – in a fair and impartial way.
II.
DEMOGRAPHIC PROFILE
The relationship between the economy, household composition, and housing is interactive and complex. Economic trends such as changes in interest rates can affect the operation of housing markets by altering the pace of sales, increasing (or decreasing) a homebuyer’s purchasing power, or stimulating development by reducing the cost of capital. Just as economic and demographic changes affect demand, the housing market can influence household formation rates and the overall health of the economy, e.g., when high housing costs depress household spending on goods and services.
The interplay of these forces can be seen in Falmouth, where a combination of expensive homes, a limited range of housing options, the allure of Cape Cod, and a small, specialized employment base have made the town a magnet for well-off retirees and seasonal residents. Falmouth’s loss of young people is echoed throughout Cape Cod, which experienced a net population decline of over 4,000 people between 2000 and 2010 in part because the region’s youth cannot find work or year-round housing they can afford.1 An economy cannot thrive
without the capacity to house workers at a variety of skill and wage levels. In Falmouth, housing is an issue both for social equity and an economic development.
A.
KEY FINDINGS
Between 2000 and 2010, Falmouth’s year-round population decreased by 3.5 percent,
much like Barnstable County, but all of Falmouth’s Upper Cape neighbors experienced population growth.
The projected population growth rate for 2018 is 1.4 percent for Falmouth and 2.1 percent
for Cape Cod.
Both median household and per capita incomes in Falmouth are greater than Cape Cod,
though historic and projected rates of income growth are similar. The rates of growth in the number of households are similar, too, with Falmouth households accounting for about 13 percent of Cape Cod households.
The average household income in Falmouth exceeds that for Cape Cod, although the
percent change is similar. The number of households earning less than $50,000 has decreased since 2000 and will continue to decrease (2018) both for Falmouth and Cape Cod.
More households are projected to earn $100,000 or more, from 26 percent of the Falmouth
households in 2010 to 32 percent in 2018. For Cape Cod as a whole, 24 percent of all households earned $100,000 or more in 2010; this is expected to reach 30 percent by 2018.
1 See Renski, Koshgarian, and Strate, Long-Term Population Projections for Massachusetts Municipalities and Regions, UMass
Donohoe Institute for Commonwealth of Massachusetts, Secretary of State (November 2013), and Northeastern University, Dukakis Center for Urban and Regional Policy, Shape the Cape: Executive Summary, for Cape Cod Young Professionals (June 2014).
Most of Falmouth’s employed residents work locally. Many parts of Cape Cod tend to
have large percentages of people who live and work in the same community (larger than the statewide average of 31.6 percent), but Falmouth has an unusually large percentage of local workers (59.7 percent). Much of this can be attributed to Woods Hole and, to a lesser extent, large local employers like Falmouth Hospital and allied health care providers.
B.
POPULATION CHARACTERISTICS
1.
Population Growth and Change
Over the past several decades, Falmouth’s population has fluctuated due to periods of growth and decline. From 2000 to 2010, other Upper Cape towns absorbed year-round population growth, but Falmouth witnessed a 3.5 percent population decline (1,129 people), much like Barnstable County as a whole (-2.9 percent). The most significant population growth period in Falmouth occurred after World War II, when the population increased 51 percent from 1950-1960. A similar growth rate occurred again between 1970 and 1980 (48 percent) due to the then-emerging “Echo Boom” and an increase in year-round moves to the Cape. Despite its recent population decrease, Falmouth has gained year-round population since 1990 by 12.8 percent. Its projected population growth rate to 2018 is 1.4 percent, and for Cape Cod overall, 2.1 percent. By 2030, however, Falmouth is expected to have a somewhat smaller population (30,618) than the total reported in 2010.2
Population Changes, 1980-2010 Trends and 2020-2030 Projections
Decennial Census (Actual) Population Projections
Geography 1980 1990 2000 2010 2020 2,030 Massachusetts 5,737,037 6,016,425 6,349,097 6,547,629 6,757,574 6,838,260 Barnstable County 147,925 186,605 222,230 215,888 215,584 216,646 Bourne 13,874 16,064 18,721 19,754 20,838 22,033 Falmouth 23,640 27,960 32,660 31,531 31,086 30,618 Mashpee 3,700 7,884 12,946 14,006 15,923 18,159 Sandwich 8,727 15,489 20,136 20,675 21,420 23,655 Source: U.S Census Bureau, Massachusetts State Data Center and UMass Donohue Institute.
2.
Population Age
Consistent with national trends, Falmouth’s population is aging. As the “Baby Boom” generation matures through retirement age, communities everywhere will witness significant growth in the 65-and-over population, and some communities will witness a disproportionate share of that growth. Many Falmouth residents and others affiliated with the town say it has absorbed more retiree population growth than the communities around it, and there is evidence to support this belief. The increase in people 75 years and over in Falmouth is
2 UMass Donohue Institute, “Population Projections for Massachusetts Municipalities,” Population Estimates Program (November
particularly noteworthy. Between 1980 and 2010, the number of people in this age group increased from 1,600 to 4,062, or 142 percent.
Since 1980, the age-dependent population in Falmouth – the sum of people under 18 and people 65 and over – has increased 38 percent, nearly all due to growth in the senior population. The number of seniors has steadily increased, yet the number of children under 18 has steadily decreased. Primarily due to senior population growth, Falmouth’s age dependency ratio has increased from .715 in 1980 to .764 in 2010. The ratio means the population percent of working-age people is not much larger than those who depend on their economic productivity. The Massachusetts State Data Center predicts that Falmouth’s total population will decline 2.9 percent between 2010 and 2013, yet the number of people 65 and over will increase by almost 50 percent.3 Moreover, the age dependency ratio will exceed 1.00,
which means the town’s working-age population will be smaller than the combined population of dependent children and people 65 and over.
3.
Race, Ethnicity, and Culture
Race and Hispanic or Latino. Compared with the nation as a whole, Massachusetts has much less racial, ethnic, and cultural diversity, and Cape Cod is less diverse than the state. Regional parity is important because it may point to local barriers to fair housing – not necessarily intentional barriers, but regulations and policies that may have the effect of housing discrimination. Racial and ethnic minorities comprise almost one-fourth of the Commonwealth’s Census 2010 population, yet just 9 percent (rounded) of Cape Cod’s. Falmouth and Mashpee have somewhat larger minority populations than the Cape-wide experience, but the make-up of their minority groups is different. Most of Falmouth’s minority population is composed of African Americans and Asians, and there is a somewhat higher concentration of African Americans in East Falmouth. A majority of Mashpee’s
3 UMass Donohue Institute, “Population Projections for Massachusetts Municipalities: Age and Sex,” Population Estimates
Program (November 2013). See Appendix X for detailed projections.
Figure 1
minority residents are Native American. The Hispanic populations are very small throughout the Upper Cape and across Cape Cod.
TABLE 2.1. RACE AND HISPANIC OR LATINO POPULATIONS
Geography Total
Population White-Non Hispanic Hispanic White Minorities Racial (Hispanic and Non-Hispanic) Minority Percent Massachusetts 6,547,629 4,984,800 280,436 1,282,393 23.9% Barnstable County 215,888 197,327 2,867 15,694 8.6% Bourne 19,754 18,261 206 1,287 7.6% Falmouth 31,531 28,612 367 2,552 9.3% Mashpee 14,006 12,281 203 1,522 12.3% Sandwich 20,675 19,817 180 678 4.1%
Sources: Census 2010, RKG Associates, Inc.
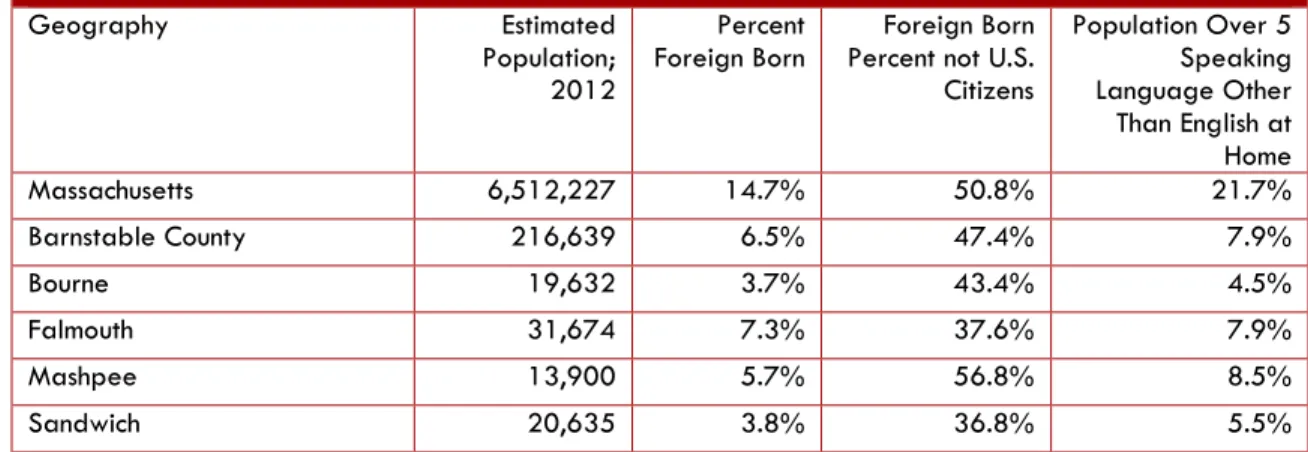
Foreign-Born Population. Falmouth has a larger proportion of foreign-born residents than the surrounding towns or Barnstable County, but smaller than Massachusetts. Recent estimates from the American Community Survey (ACS) indicate that about 7 percent of Falmouth’s residents were born outside the U.S., and 38 percent of the foreign-born population does not have U.S. citizenship. Though not significantly concentrated in any particular area, Falmouth’s foreign-born residents tend to live in East Falmouth and the upper-central part of town, generally around the village of Hatchville. However, noticeably larger percentages of residents without U.S. citizenship live around Falmouth Village and North Falmouth.4 Over
half of Falmouth’s foreign-born population emigrated here from East Asian, South East Asian, and South Central Asian countries and Southern Europe.
TABLE 2.2. INDICATORS OF CULTURAL DIVERSITY: FOREIGN-BORN POPULATION AND NON-NATIVE SPEAKERS OF ENGLISH
Geography Estimated
Population; 2012
Percent
Foreign Born Percent not U.S. Foreign Born Citizens Population Over 5 Speaking Language Other Than English at Home Massachusetts 6,512,227 14.7% 50.8% 21.7% Barnstable County 216,639 6.5% 47.4% 7.9% Bourne 19,632 3.7% 43.4% 4.5% Falmouth 31,674 7.3% 37.6% 7.9% Mashpee 13,900 5.7% 56.8% 8.5% Sandwich 20,635 3.8% 36.8% 5.5%
Sources: 2007-2011 American Community Survey Five-Year Estimates, and RKG Associates.
4 Falmouth Village refers to Barnstable County Census Tracts 148 and 149. North Falmouth is largely contained within Census
Languages Spoken at Home. Another measure of population diversity is the presence of families whose native language is not English. Given the small percentages of foreign-born residents in Falmouth, it is not surprising to find small percentages of people who speak languages other than English at home. In Falmouth, the most common non-English languages spoken at home are Portuguese, French, and Chinese. In most cases, those who preserve their traditional language customs at home are also fluent or near-fluent speakers of English. Still, planning to address a town’s housing and community development needs should be conscious of cultural barriers (including but not limited to language) that can make it difficult for people who need housing to be accounted for through ordinary means.
4.
Geographic Mobility
There does not appear to be significant population turnover in Falmouth. Over 92 percent of the Town’s estimated population in 2012 had lived in the same house for at least one year, compared with 91 percent for Barnstable County and 86 percent for Massachusetts. The ACS estimates that the overwhelming majority of residents who lived in a different house the previous year relocated to Falmouth from some other part of Barnstable County (including moves that may have occurred within Falmouth).
C.
HOUSEHOLD CHARACTERISTICS
The size and make-up of a community’s households, the age of its householders, and the distribution of households in owner- and renter-occupied units matter more for a housing study than population change per se. A household is a single person or two or more people living in the same housing unit as their usual place of residence. From 2000 to 2010, Falmouth gained 210 households, or a 1.5 percent increase in ten years, despite its slight population decline. Compared with Falmouth’s neighbors, 1.5 percent is a very slow rate of household growth, but it is similar to the county-wide experience.
1.
Household Types
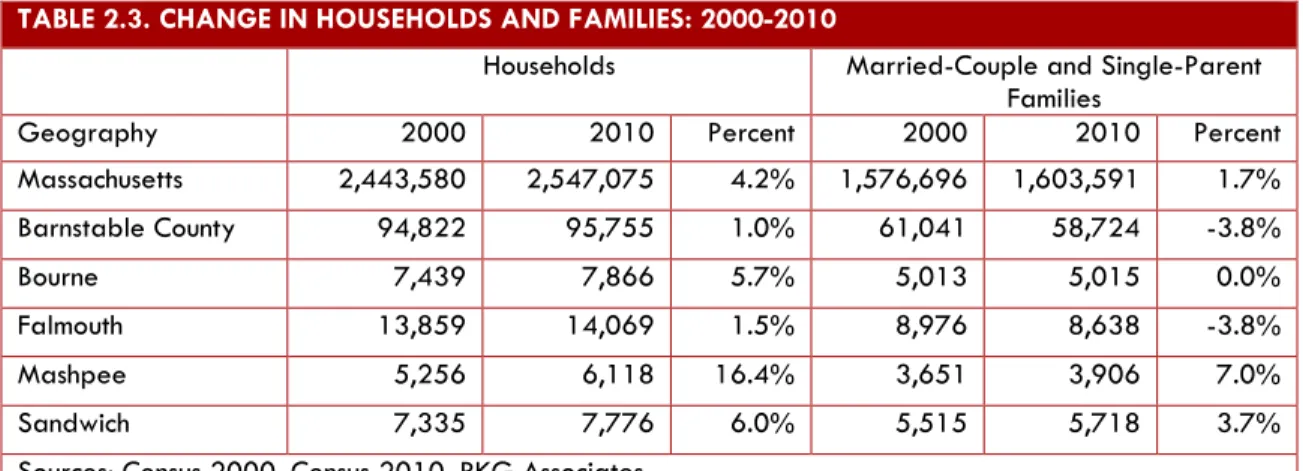
According to the Census Bureau, in the same ten-year period that Falmouth gained a small number of households, it also witnessed a decrease in number of families. The Census Bureau defines a family as a householder and one or more people in the same household who are related to the householder by birth, marriage, or adoption.5 Though the Cape overall
5 The Census Bureau’s household definitions differ from the definitions of family and household in the federal Fair Housing Act
(FFHA) regulations adopted by HUD in July 2013. For census purposes, households include single people living alone and two or more people occupying the same housing unit, while families are households of two or more people related in some way: blood, adoption, marriage. Households that include both related people and an unrelated person, such as an unmarried partner household in which one partner has dependent children, or unrelated partner households without children, are not counted as families in the decennial census or the American Community Survey (ACS). These households, along with single people living alone, are reported as nonfamily households. Under FFHA regulations, however, “family” includes single people living alone and groups of people living together, regardless of actual or perceived sexual orientation, gender identity, or marital status, such as families with or without children, seniors, people with disabilities, and displaced families (those who have lost housing for any reason). The Census-FFHA distinctions matter because on one hand, communities need to understand the interplay between demographics, housing supply, and housing demand, but on the other hand, they need to understand how “targeting” housing to certain groups may conflict with the FFHA.
experienced a decline in number of families, too, the towns next to Falmouth did not, as shown in Table 2.3.
TABLE 2.3. CHANGE IN HOUSEHOLDS AND FAMILIES: 2000-2010
Households Married-Couple and Single-Parent Families
Geography 2000 2010 Percent 2000 2010 Percent
Massachusetts 2,443,580 2,547,075 4.2% 1,576,696 1,603,591 1.7% Barnstable County 94,822 95,755 1.0% 61,041 58,724 -3.8% Bourne 7,439 7,866 5.7% 5,013 5,015 0.0% Falmouth 13,859 14,069 1.5% 8,976 8,638 -3.8% Mashpee 5,256 6,118 16.4% 3,651 3,906 7.0% Sandwich 7,335 7,776 6.0% 5,515 5,718 3.7%
Sources: Census 2000, Census 2010, RKG Associates.
Nonfamily households consist of single people living alone and households of two or more unrelated people. Both nationally and statewide, singles account for about 79 percent of all nonfamily households, but they represent somewhat larger shares in Falmouth and Mashpee: 84 and 85 percent, respectively. Households of two unrelated people are the second most common nonfamily type, accounting for 16 percent of nonfamilies nationally and 18 percent in Massachusetts, yet here again, Falmouth is somewhat different, at 13 percent. These differences are not all that significant. Still, they point to questions that may be appropriate for a housing demand study, especially one that seeks to analyze not only housing affordability needs, but a broader slate of housing needs that are not being met by ordinary operations of the market.
What is significant about the living-alone population in Falmouth (and most of Cape Cod) is that seniors account for a much larger percentage than national or state averages. It appears that working-age singles have trouble finding housing on Cape Cod, or living-wage jobs, or both. In Massachusetts, the living-alone population under 64 represents 49 percent of all nonfamily households, but in Falmouth they are only 40 percent. In fact, Falmouth has a smaller percentage of singles under 64 of any of the Upper Cape towns.6 Many people
interviewed for this housing study describe Falmouth’s loss of young workers as a major social problem and barrier to economic development. They attribute it to the Town’s narrow employment base and expensive housing relative to the wages paid by local employers.
What is significant about the living-alone
population in Falmouth (and most of Cape Cod)
is that seniors account for a much larger
percentage than national or state averages. It
appears that working-age singles have trouble
finding housing on the Cape, or living-wage jobs,
or both.
2.
Householder Ages
To some extent, the decrease in families in Falmouth can be attributed to a gradual decline in number of young households, i.e., householders under 35, coupled with significant growth among seniors. Most of the Cape has lost young households, and it is important to note that the rate of decline in Falmouth is not as great as in neighboring Sandwich and Bourne. However, Falmouth has seen the largest decrease
in households of childrearing age – meaning householders under 55 years – and this is closely linked to the drop in family households. From 2000 to 2010, the number of households under 55 decreased 16.6 percent in Falmouth: more than all of the surrounding towns, Barnstable County, and the state as a whole. Today, Falmouth’s household profile is quite different from that of the U.S., for almost 60 percent of the nation’s householders are people of childrearing age yet in Falmouth, they represent just 40 percent. Though fairly consistent with Barnstable County (34.2 percent), Falmouth has a larger share of 65-and-over householders than any of the other Upper Cape communities.
3.
Household Size and Composition
Falmouth households tend to be small. In fact, its average household size is smaller than that of all surrounding towns and Barnstable County (which has smaller households than the state). Table 2.4 shows that Falmouth’s families are small, too, so the overall average is affected by more than simply a large percentage of living-alone seniors.
Table 2.4. Household Sizes
Geography Total
Households 1 Person 2 People People 3-4 People 5+ Household Avg. Family Avg. Massachusetts 2,547,075 28.7% 31.9% 30.3% 9.1% 2.48 3.08 Barnstable County 95,755 31.8% 39.3% 23.1% 5.8% 2.21 2.77 Bourne 7,866 29.8% 37.8% 25.6% 6.8% 2.30 2.85 Falmouth 14,069 32.5% 38.8% 22.8% 5.8% 2.21 2.77 Mashpee 6,118 30.6% 38.1% 24.7% 6.6% 2.27 2.81 Sandwich 7,776 21.3% 36.3% 32.3% 10.1% 2.61 3.06
Sources: Census 2010, RKG Associates, Inc.
Less than one-fourth of all households in Falmouth consist of three or more people, and Barnstable County as a whole is similar. Falmouth’s Upper Cape neighbors are different, however: larger households and larger families, more like the profile of households throughout Massachusetts.
4.
Family Characteristics
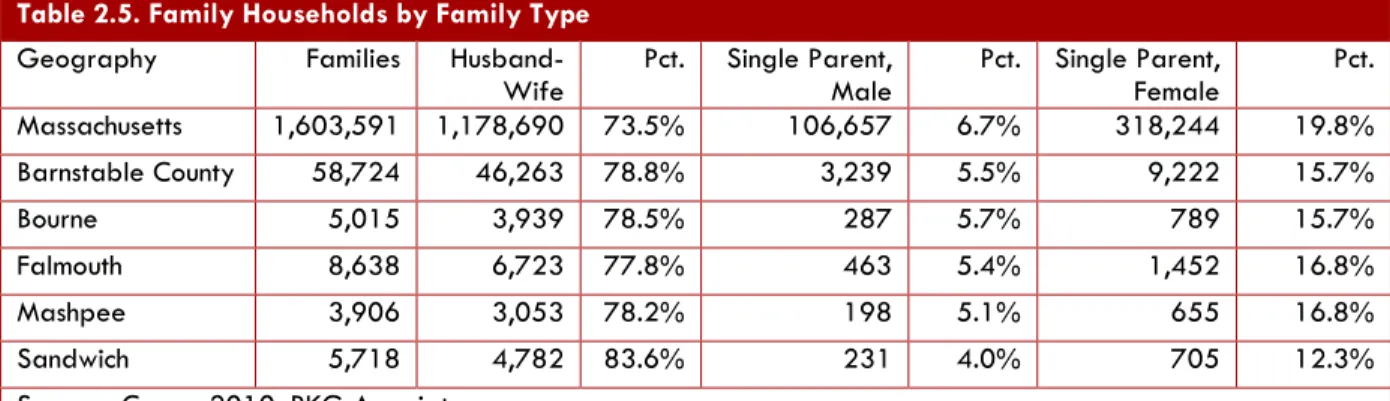
The composition of Falmouth’s family households is similar to that of Barnstable County and the state. Husband-wife families make up the vast majority of the family households in Falmouth, and this is typical of communities where most of the housing is owner-occupied and most of the housing stock is single-family homes, both of which apply in Falmouth. While Falmouth and most towns have experienced growth in single-parent families – especially families headed by a single father – the traditional family structure tends to prevail in communities with traditional housing.
Table 2.5. Family Households by Family Type
Geography Families
Husband-Wife Pct. Single Parent, Male Pct. Single Parent, Female Pct. Massachusetts 1,603,591 1,178,690 73.5% 106,657 6.7% 318,244 19.8% Barnstable County 58,724 46,263 78.8% 3,239 5.5% 9,222 15.7% Bourne 5,015 3,939 78.5% 287 5.7% 789 15.7% Falmouth 8,638 6,723 77.8% 463 5.4% 1,452 16.8% Mashpee 3,906 3,053 78.2% 198 5.1% 655 16.8% Sandwich 5,718 4,782 83.6% 231 4.0% 705 12.3%
Sources: Census 2010, RKG Associates.
Very few families in Falmouth are multigenerational households. The national average of multigenerational households is only 4.4 percent (of all households), so Falmouth’s 2.6 percent, though small, is not really significant, especially since the proportion of multigenerational households is so small in all of the surrounding towns.7
5.
Households and Housing Tenure
Falmouth’s household characteristics are not all that surprising when viewed against basic housing tenure statistics. Nationally, 35 percent of all households regardless of age and 63 percent of all young households are renters. In Falmouth, less than 24 percent of all households are renters, and in some census tracts the percentage of renters is much smaller.8 Since the
supply of rental housing is so limited, Falmouth does not offer many options for young people to move to or stay in the community. Throughout the country and in Massachusetts, over 35 percent of all rental units are occupied by young households and 14-18 percent, respectively, by seniors. In Falmouth, the corresponding statistics are 24 percent of all rental units are occupied by young households and 25 percent by seniors.9 There is a significant housing
opportunity gap for young people in Falmouth and across Cape Cod, and the housing gap is
7 Census 2010, PCT16. 8 Census 2010, H16.
exacerbated by limited diversity in the employment base, as discussed more in Section X below.
In Falmouth and most towns on the Cape, the homeownership rate among seniors – generally 85 to 90 percent - is much higher than for the state as a whole (69 percent). The region’s high elderly homeownership rate most likely explains the large percentage of homeowners who own their home free and clear, i.e., without a mortgage. In Falmouth, a strikingly high 35 percent of all homeowners have no mortgage or loan on their property. Although the local percentage is similar to that of Barnstable County (33.5 percent), it surpasses all of the other Upper Cape communities and it is much higher than that of the state (25.8 percent).10 The
homeownership rate for young households is also high, yet this seemingly beneficial condition contributes to the small percentage of young people on Cape Cod. The disproportionate share of owner-occupied housing in Falmouth probably correlates with the changes in householder ages that happened over the past decade, but it is not the only factor. The number of rental units actually increased in Falmouth – modestly – between 2000 and 2010. More compelling, though, is the increase in seasonal units (see Section 2).
6.
Income and Poverty
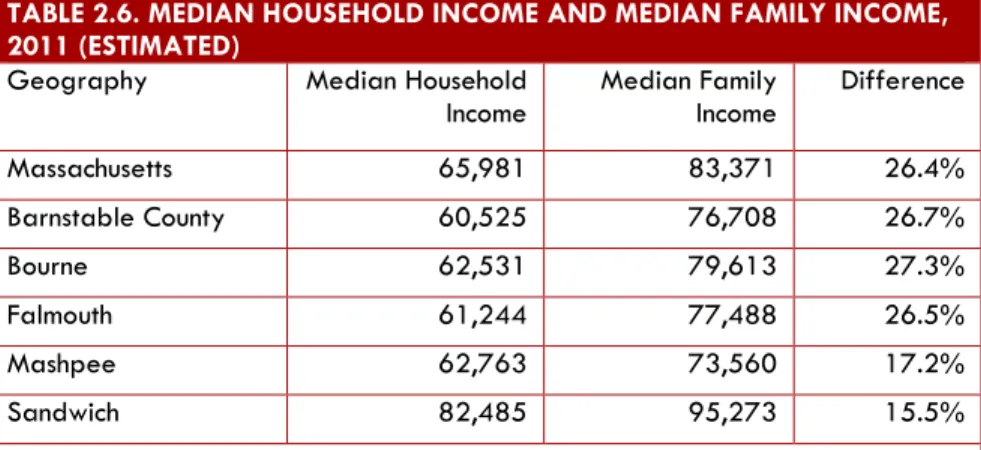
The ACS places Falmouth’s median household income is $61,224, which is about 93 percent of the statewide median ($65,981), Falmouth households have a somewhat higher economic position than their counterparts elsewhere in Barnstable County, where the median is $60,525, but they are not as affluent as the households in other Upper Cape communities.
TABLE 2.6. MEDIAN HOUSEHOLD INCOME AND MEDIAN FAMILY INCOME, 2011 (ESTIMATED)
Geography Median Household
Income Median Family Income Difference
Massachusetts 65,981 83,371 26.4% Barnstable County 60,525 76,708 26.7% Bourne 62,531 79,613 27.3% Falmouth 61,244 77,488 26.5% Mashpee 62,763 73,560 17.2% Sandwich 82,485 95,273 15.5%
Source: 2007-2011 ACS 5-Year Estimates, RKG Associates, Inc.
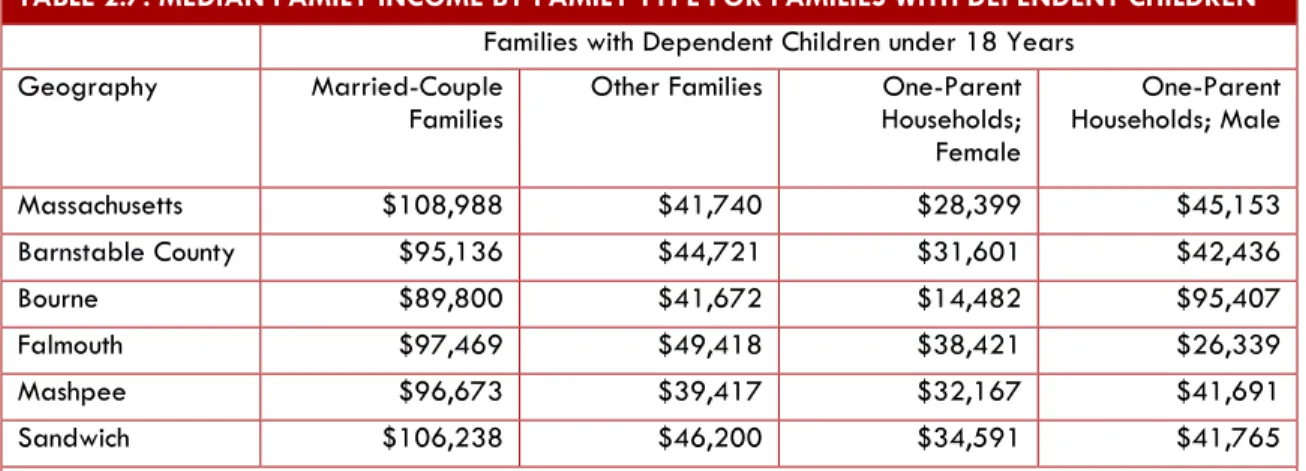
As in most communities, the economic position of families in Falmouth is generally better than that of all households (including families and nonfamilies). This is true for a few reasons: first, family households tend to be younger, so they are more likely to be in the labor force, and second, families often have more than one wage earner. Accordingly, there are significant income disparities between family types statewide, throughout Cape Cod, and in Falmouth, as shown in Table 2.7. Notably, single women with children under 18 have conspicuously low incomes compared with married-couple families and single men with children under 18. Falmouth is an exception, for single women with children here have higher incomes than
10 Ibid.
single men with children. However, their median income is less than half that of all family households (with or without children) and less than 40 percent of the median income of married-couple families with dependents.
TABLE 2.7. MEDIAN FAMILY INCOME BY FAMILY TYPE FOR FAMILIES WITH DEPENDENT CHILDREN
Families with Dependent Children under 18 Years Geography Married-Couple
Families Other Families Households; One-Parent Female One-Parent Households; Male Massachusetts $108,988 $41,740 $28,399 $45,153 Barnstable County $95,136 $44,721 $31,601 $42,436 Bourne $89,800 $41,672 $14,482 $95,407 Falmouth $97,469 $49,418 $38,421 $26,339 Mashpee $96,673 $39,417 $32,167 $41,691 Sandwich $106,238 $46,200 $34,591 $41,765
Source: Source: 2007-2011 ACS 5-Year Estimates, RKG Associates, Inc.
Also noteworthy in Falmouth’s household income characteristics is the relationship between senior household incomes and household incomes overall (including families and nonfamilies). The incomes of over-65 households are usually lower than those of working-age households, and this is true in Falmouth, too. However, the ratio of median household income for seniors to the community-wide median is quite a bit higher in Falmouth than in neighboring towns (though comparable to the ratio for Barnstable County). This means more Falmouth seniors have incomes closer to the community-wide median than seniors elsewhere in the Upper Cape. The issue is not that Falmouth’s seniors are wealthier than their counterparts nearby. Rather, it is that seniors make up a large share of all households in Falmouth, and Falmouth’s younger households in the workforce – householders between 25 and 44 years – tend to fall below the median for the Town as a whole. As for the latter, Falmouth is regionally unique.11
TABLE 2.8. INCOME RATIOS BY AGE OF HOUSEHOLDER
Median Household Income
Under 25 25 to 44 45 to 64 65 and over
Massachusetts $65,981 46.5% 113.7% 124.0% 55.0% Barnstable County $60,525 66.0% 107.0% 124.6% 74.4% Bourne $62,531 59.1% 121.2% 138.8% 56.5% Falmouth $61,244 56.7% 98.0% 123.8% 73.8% Mashpee $62,763 27.8% 121.1% 110.7% 73.3% Sandwich $82,485 26.8% 112.7% 113.2% 56.8%
Sources: 2007-2011 ACS Five-Year Estimates; RKG Associates, Inc.
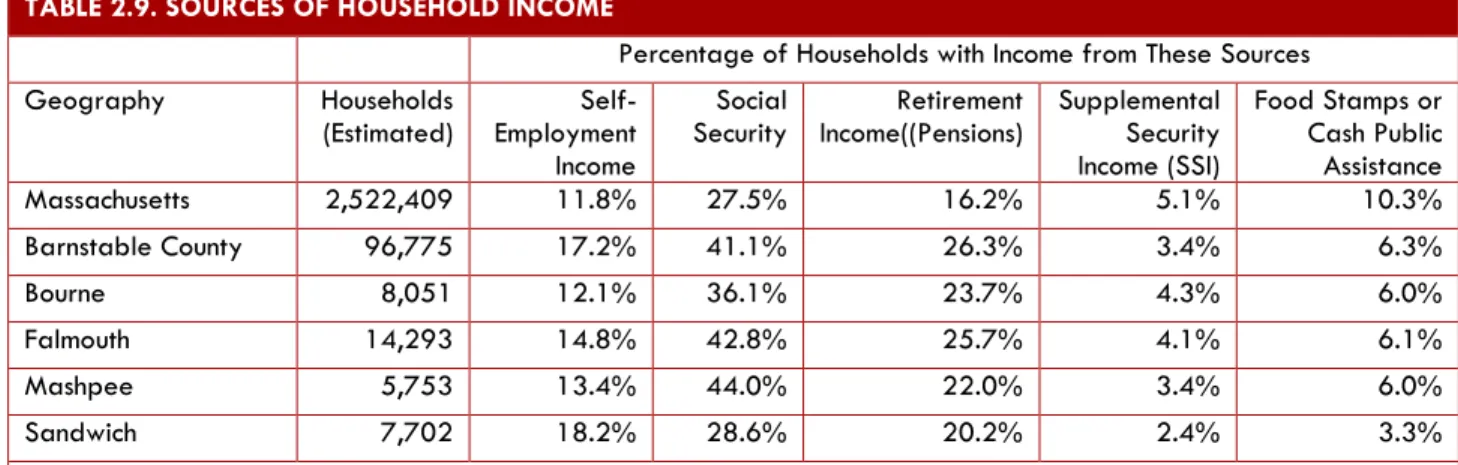
The sources of income that most households rely on differ by part of the country and region within Massachusetts. This is very obvious in the Commonwealth’s largest tourism areas, Cape Cod and Southern Berkshire County. Table 2.9 shows that households with self-employment income tend to be more common on Cape Cod, and households receiving Social Security payments or pension distributions are far more common on the Cape.
TABLE 2.9. SOURCES OF HOUSEHOLD INCOME
Percentage of Households with Income from These Sources Geography Households
(Estimated) Employment Self-Income
Social
Security Income((Pensions) Retirement Supplemental Security Income (SSI) Food Stamps or Cash Public Assistance Massachusetts 2,522,409 11.8% 27.5% 16.2% 5.1% 10.3% Barnstable County 96,775 17.2% 41.1% 26.3% 3.4% 6.3% Bourne 8,051 12.1% 36.1% 23.7% 4.3% 6.0% Falmouth 14,293 14.8% 42.8% 25.7% 4.1% 6.1% Mashpee 5,753 13.4% 44.0% 22.0% 3.4% 6.0% Sandwich 7,702 18.2% 28.6% 20.2% 2.4% 3.3%
Sources: 2007-2011 ACS Five-Year Estimates; RKG Associates, Inc.
Note: this table reports different numbers of households than previous tables because the data are not based on the same sources.
The U.S. Department of Housing and Urban Development (HUD) publishes estimates of the number of low- and moderate-income households in each city and town in the nation. According to the most recent Comprehensive Housing Affordability Strategy (CHAS) data, about 40 percent of the households in Falmouth have incomes at or below the median family income for Barnstable County as a whole. Thirty-three percent are homeowners and 65.6 percent are renters, many of whom live in housing they cannot really afford. Table 12 summarizes the income limits that are currently in effect for a majority of subsidized housing programs serving low- and moderate-income people. The income limits are adjusted for household size.
TABLE 2.10. HUD LOW- AND MODERATE-INCOME LIMITS FOR BARNSTABLE COUNTY (2014)
Number of People in Household
Income Tier 1 2 3 4 5 6 7 8
Very Low Income
(30%) $18,050 $20,600 $23,200 $25,750 $27,910 $31,970 $36,030 $40,090 Low Income (50%) $30,100 $34,400 $38,700 $42,950 $46,400 $49,850 $53,300 $56,700 Moderate Income
(80%) $44,750 $51,150 $57,550 $63,900 $69,050 $74,150 $79,250 $84,350 Source: HUD/PDR, Income Limits.
The individual poverty rate in Falmouth, 7.8 percent, is not as high as that of Massachusetts, 10.7 percent.
D.
GROUP QUARTERS POPULATIONS
Just about every community has residents – both permanent and short-term – who are not part of the local household population. Rather, they occupy some type of shared living arrangement or
group quarters, which may be involuntary or institutional, such as a prison, or voluntary (non-institutional), such as a group home, a college dormitory, or a shelter for homeless people. The group quarters population is generally a very small percentage of the total population in any city or town, and this is true for Falmouth. According to the federal census, group quarters residents (508 people) make up
1.6 percent of Falmouth’s total population. The vast majority (82 percent) reside in one of the town’s nursing homes. The others include residents of group homes or emergency shelters, people attending a residential treatment program, hospice patients, and people temporarily residing on a maritime vessel.
E.
ECONOMIC CHARACTERISTICS
Access to employment – particularly access to jobs with decent wages – plays a crucial role in a community’s ability to attract and keep working-age people. Almost 60 percent of Falmouth’s employed population also works in Falmouth,12 so characteristics of the local
employment base are very important and clearly have an impact on what residents can afford to spend on housing. Below is an overview of business and employment trends, by selected industry sector, for Falmouth and all of Cape Cod, based on data for the Cape and Islands Workforce Investment Area (WIA).13 Employment levels by sector are also projected for 2022.
12 2007-2011 ACS Five-Year Estimates, B08009, and “Commuter-Adjusted Daytime Population: Minor Civil Divisions
(MCD)”at Commuting: Journey to Work (Main), www.census.gov.
Figure 3
1.
Labor Force and Unemployment
Today, Falmouth’s labor force consists of almost 17,000 residents. As defined by the Bureau of Labor Statistics (BLS), the labor force includes a community’s resident population 16 years and older, either employed or looking for work. Over the past few years, the average unemployment rate in Falmouth, 6.3 percent, has been somewhat better than that of the WIA (6.9 percent) and the state (6.8 percent). The unemployment rate in Falmouth has consistently been at or below the rate for the WIA and generally consistent with but somewhat above the state in the off-season.
2.
Establishments
Between 2007 and 2012, the number employers in Falmouth declined by 81, or 6.7 percent, from 1,202 to 1,121. Most industry sectors experienced a decrease in number of businesses with the exception of information services, arts and entertainment, and accommodations and food service. By contrast, there was an approximate decline of 318 businesses in the WIA, or a 2.8 percent decline. In general, there were fewer declining industry sectors in the WIA compared with Falmouth, although the WIA also experienced growth in information services, arts and entertainment, and accommodations and food service. Other industry sectors realizing growth in the WIA include management, administrative, and educational services.
3.
Employment
Total payroll employment in Falmouth declined from 14,525 in 2007 to 14,295, or 230 jobs, for a 1.6 percent loss. Not all industry sectors realized a loss in employment, however. Some sectors such as real estate and wholesale trade experienced significant decline. Throughout the WIA, employment decreased by 2.2 percent, or 2,363 jobs, with most industry sectors experiencing employment losses. WIA-wide, total employment was 104,647 in 2012, down from 107,010 in 2007.
Relative to the total number of households in Falmouth, the employment base is fairly limited. Falmouth has just over one job for every one occupied housing unit, and while the jobs-housing ratio is usually based on a community’s entire jobs-housing stock, this approach makes very little sense in a vacation/seasonal resort town. Even focusing on occupied units, however, the employment base in Falmouth is not really large enough to support the Town’s labor force. Moreover, many of the jobs do not pay high enough wages to support the cost of living in Falmouth. This is a persistent problem in vacation/resort areas like Cape Cod, and it contributes to the large percentages of households with self-employment income. It is not uncommon for year-round residents on the Cape and other tourist areas to have both a payroll job and part-time work as a self-employed individual.
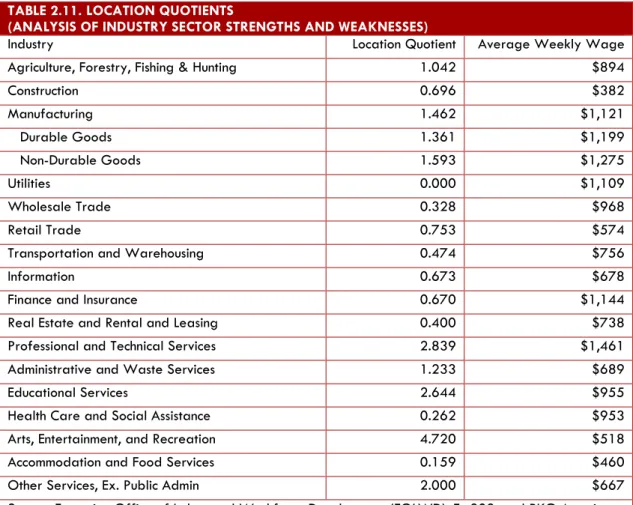
Location Quotients. Location quotients provide a reasonable way of estimating strengths and weaknesses in a town’s economy. A location quotient compares the percentage of jobs in a given sector at the local level to the percentage of jobs in the same sector in a larger comparison area (known as a reference economy), in this case the WIA. When the ratio in employment approximates 1.0, Falmouth is generally performing on par with the WIA. If the ratio for an industry is less than 0.80, that industry is probably underperforming in Falmouth relative to the WIA. Similarly, a location quotient greater than 1.20 usually indicates better performance locally than regionally. A very high location quotient could mean a very strong
industry, but it can also mean a specialized economy that may be vulnerable in an economic downtown. Overall, the available employment data for Falmouth and the WIA support several findings about the Town’s economic base:
Compared with the WIA, Falmouth is stronger in manufacturing, professional/technical
services, and educational services, arts and entertainment, and personal services.
Falmouth is generally on par with but somewhat weaker than the WIA in retail trade. Although Falmouth has many health care jobs and they tend to pay good wages, health
care employment is not as strong in Falmouth as in the WIA as a whole.
Industries such as transportation, information, and finance are underrepresented in
Falmouth’s economy. Some of these sectors provide high-paying jobs. TABLE 2.11. LOCATION QUOTIENTS
(ANALYSIS OF INDUSTRY SECTOR STRENGTHS AND WEAKNESSES)
Industry Location Quotient Average Weekly Wage
Agriculture, Forestry, Fishing & Hunting 1.042 $894
Construction 0.696 $382 Manufacturing 1.462 $1,121 Durable Goods 1.361 $1,199 Non-Durable Goods 1.593 $1,275 Utilities 0.000 $1,109 Wholesale Trade 0.328 $968 Retail Trade 0.753 $574
Transportation and Warehousing 0.474 $756
Information 0.673 $678
Finance and Insurance 0.670 $1,144
Real Estate and Rental and Leasing 0.400 $738
Professional and Technical Services 2.839 $1,461
Administrative and Waste Services 1.233 $689
Educational Services 2.644 $955
Health Care and Social Assistance 0.262 $953
Arts, Entertainment, and Recreation 4.720 $518
Accommodation and Food Services 0.159 $460
Other Services, Ex. Public Admin 2.000 $667
Source: Executive Office of Labor and Workforce Development (EOLWD), Es-202, and RKG Associates.
4.
Seasonal Changes in Jobs and Labor Force
Comparing monthly employment statistics (jobs in place) with labor force and unemployment statistics from January 2007 through September 2013 illustrates the challenges of trying to live and work in Falmouth. The number of jobs in Falmouth increased from
anywhere between 21 percent and 27 percent depending on the year, while the labor force increased between 25 percent and 28 percent. The labor force peaked at nearly 20,000 persons in 2007 and 2008 (July), and subsequently declined to about 18,500 in 2010 (July). By 2013 (July) it had recovered to nearly 20,000 people. However, the unemployment rate increased from about 3 percent in 2007 to over 5 percent in 2013. In the winter (January), averaged at 6 percent in 2007 and 2008, but increased to 11 percent in 2010 (January), and subsequently declined to over 9 percent in 2013 (January).
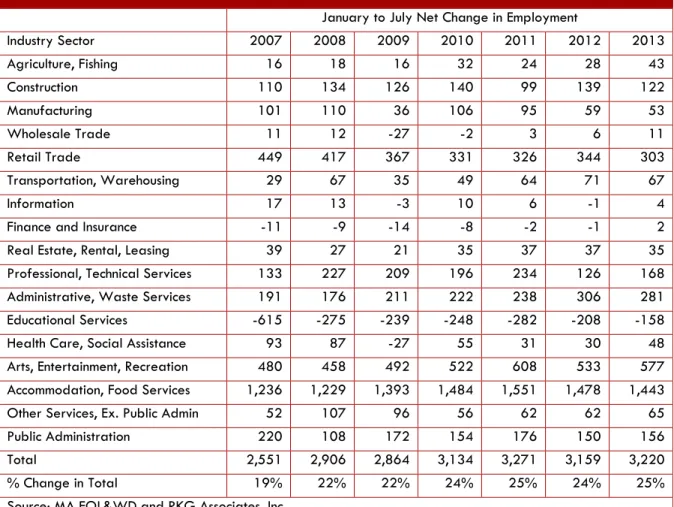
Table 2.12 reports change in employment between January and July of any given year by major sector in Falmouth. Total employment increased between 20-25 percent by July, and gains were indicated in nearly all industry sectors with exception of educational services (because of summer). Summer employment in Accommodation and Food Services ranged between 1,230 and 1,550 jobs depending on the year, and accounted for 42-49 percent of the total increase in employment. Arts, Entertainment and Recreation employment had seasonal gains ranging from 480 to nearly 610 jobs, and Retail Trade had seasonal gains ranging from 300 to 450 jobs depending on the year. A seasonal increase was also indicated in the Administrative and Waste Services sector, likely associated with additional trash collection, and Public Administration likely associated with public safety and the ferry terminal.
TABLE 2.12. SEASONAL EMPLOYMENT CHANGES IN FALMOUTH
January to July Net Change in Employment
Industry Sector 2007 2008 2009 2010 2011 2012 2013 Agriculture, Fishing 16 18 16 32 24 28 43 Construction 110 134 126 140 99 139 122 Manufacturing 101 110 36 106 95 59 53 Wholesale Trade 11 12 -27 -2 3 6 11 Retail Trade 449 417 367 331 326 344 303 Transportation, Warehousing 29 67 35 49 64 71 67 Information 17 13 -3 10 6 -1 4
Finance and Insurance -11 -9 -14 -8 -2 -1 2
Real Estate, Rental, Leasing 39 27 21 35 37 37 35 Professional, Technical Services 133 227 209 196 234 126 168 Administrative, Waste Services 191 176 211 222 238 306 281 Educational Services -615 -275 -239 -248 -282 -208 -158 Health Care, Social Assistance 93 87 -27 55 31 30 48 Arts, Entertainment, Recreation 480 458 492 522 608 533 577 Accommodation, Food Services 1,236 1,229 1,393 1,484 1,551 1,478 1,443 Other Services, Ex. Public Admin 52 107 96 56 62 62 65 Public Administration 220 108 172 154 176 150 156
Total 2,551 2,906 2,864 3,134 3,271 3,159 3,220
% Change in Total 19% 22% 22% 24% 25% 24% 25%
Summer employment causes the employment base in Falmouth to increase by nearly 25 percent. Gains are typically highest in the tourism-related industries, i.e., Accommodation and Food Services; Arts, Entertainment and Recreation; and Retail Trade. Still, nearly all the other sectors experience increases during the summer, mainly associated with public services and waste services.
III.
LOCAL HOUSING CONDITIONS
It is harder to confirm the number of housing units in a community than many people realize. To the general public, a housing unit is a single-family home or two-family home, an accessory apartment, an apartment in a multi-family building or a townhouse condominium: fully enclosed spaces with facilities for “one family or household for living, sleeping, cooking, and eating” – that is, a dwelling unit as defined in Falmouth’s zoning bylaw. However, the “official” housing count reported by the Census Bureau every ten years is a little different. Under the Census Bureau’s broad definitions of “housing,” rooms in boarding houses and retirement homes can qualify as housing units. The federal definition also includes structures or portions thereof that are not classified (or regulated) as housing under the State Building Code, e.g., mobile homes, recreational vehicles, and boats, and rooms or groups of rooms without separate cooking or sanitation facilities. For purposes of this study, “housing unit” means what most people generally think of as housing, i.e., it does not include recreational vehicles. It could include shared quarters, however, such as single-room occupancy (SRO) units.
Falmouth’s total housing inventory increased 9.5 percent in the past ten years. As of Census 2010, the inventory includes 21,970 units. Falmouth’s experience is generally consistent with that of Barnstable County, which absorbed a 9 percent increase in housing stock between 2000 and 2010. Growth in seasonal housing occurred throughout Massachusetts in the past decade, and certainly in Falmouth, too. By 2010, Massachusetts had absorbed a 23 percent increase in seasonal units, from 93,771 in 2000 to 115,630 in 2010. Cape Cod continues to account for roughly half of all seasonal or vacation units in the state. The increase in Falmouth is noteworthy – 26.4 percent – a higher rate of seasonal housing growth than that of any neighboring town, and higher than the Barnstable County average, 20.9 percent. Today, over 32 percent of all housing units in Falmouth are owned for seasonal use.
The Census Bureau divides Barnstable County into fifty-one census tracts, including seven in Falmouth. A census tract is a small, relatively permanent area used by the Census Bureau to report demographic and housing data. Since census tract areas do not change very often, they make it possible to trace population and housing trends in geographic units that are delineated by natural features, development patterns, and roads more than by political boundaries. Due to the variety of local government types found throughout the United States, census tracts are actually subdivisions of counties, not cities or towns. In Massachusetts, however, virtually all census tracts fall entirely within municipal boundaries, as is the case in Falmouth. (See Fig. 4)
A.
KEY FINDINGS
Since 2000, nearly all residential construction in Falmouth has involved single-family
homes and condominiums, though it appears that a small increase in two- and three-unit structures and mixed-use properties occurred as well.
The assessed value of residential properties more than doubled over the last decade, but
a decrease was evident since 2010. The assessed value of residential properties represents over 92 percent of Falmouth’s tax base, so housing is a very important source of revenue for the town.
According to information in the assessor’s database, the average assessment of
single-family parcels town-wide is $481,300, but it varies by neighborhood and in some case quite significantly. Also, land assessment for single-family homes accounted for 56 percent of the total, town-wide, but in selected neighborhoods influenced by the water, land values are much higher.
The supply of single-family homes, condominiums, small multi-unit buildings, and
properties with multiple dwellings includes a combined total of about 20,970 units. Together, they are characterized as selected residential properties in this report – selected because they lend themselves to comparative analysis, which is not really true for large investor-owned apartment buildings. The selected residential properties represent about 94.5 percent of Falmouth’s entire housing supply (22,200 units).
The supply of seasonal housing may have increased by 10 percent or so since 2010, for
7,800 units were identified as second homes in the assessor’s file compared with 7,100 seasonal units reported in Census 2010. The assessed value of second homes is generally higher than that of year-round residences. Assessments vary by neighborhood, with Pinecrest, Teaticket, and Ashumet being the most affordable.
The supply of residential properties valued at less than $200,000 – that is, properties that
would probably be affordable to a moderate-income homebuyer – accounts for over 7 percent of the selected residential properties. Almost half are seasonal homes or rentals. This supply is concentrated primarily in five of Falmouth’s eighteen neighborhoods. Fifteen percent of the selected residential properties have a value in the $200,000 to $250,000 range, and another 14 percent in the $250,000 to $300,000 range. The remaining 64 percent are assessed at over $300,000, and only 47 percent are occupied as a residence.
Approximately 39 percent of the selected residential parcels were built within the last 35
years or since 1980, including 10 percent built since 2000. About 24 percent of the multi-unit parcels were developed since 1980, but only 8 percent since 2000. Housing production over that last few years slowed considerably in comparison with activity in the 1980s or late 1990s.
If the number of seasonal homes has increased as suggested by data from the assessor’s
office, Falmouth’s actual Chapter 40B “shortfall” may be smaller than it appears, given that the official percentage is based on federal census data, not records of the local