2014
I
NTEGRATED
R
ESOURCES
P
LAN
FOR
C
ONNECTICUT
P
REPARED BY:
T
HEC
ONNECTICUTD
EPARTMENT OFE
NERGY ANDE
NVIRONMENTALP
ROTECTIONE
XECUTIVE
S
UMMARY
In 2013, the Connecticut Department of Energy and Environmental Protection (DEEP or Department) released the state’s first-ever Comprehensive Energy Strategy (2013 CES), which detailed dozens of policy recommendations to secure a cheaper, cleaner, more reliable energy future for Connecticut. Analysis prepared for this Integrated Resources Plan (IRP) confirms that several of the key policy recommendations of the 2013 CES related to the electric sector — many of which have been enacted into statute and implemented by the Department and its Public Utilities Regulatory Authority (PURA), as well as the Energy Efficiency Board (EEB), and the Connecticut Green Bank — are providing important benefits.
These programs are more critical than ever now, as Connecticut ratepayers are being affected by critical developments in New England’s wholesale electricity markets that are challenging the affordability and reliability of the region’s electric system. The 2014 IRP analyzes these trends in the region’s electricity system over the next decade (out to 2024), and proposes eight key recommendations. These recommendations meet the state’s electricity needs in a way that provides affordable electricity to Connecticut customers over time and creates consumer benefits consistent with the state’s environmental goals and standards.
C
ONNECTICUT
E
NERGY
P
OLICIES
A
RE
S
ECURING
C
HEAPER
,
C
LEANER
,
M
ORE
R
ELIABLE
E
LECTRICITY
Connecticut’s Expanded Energy Efficiency Investment Is Flatttening Electricity Demand
Investment in the state’s popular energy efficiency and conservation programs nearly doubled in 2014, following the recommendations of the 2013 CES and 2012 IRP, and enactment of Public Act 13-298. Over the next ten years, this expanded efficiency investment is expected to nearly eliminate growth in the state’s annual electricity consumption (projected to rise an average of only 0.05% per year), and reduce growth in electricity consumption during peak demand periods to 0.5% per year. This is significant progress compared to the 2012 IRP, which projected an increase in consumption at approximately 1% per year and slightly higher growth rates for the annual peak load.
Connecticut’s Renewable Procurements and Programs Are Delivering Cheaper, Cleaner
Electricity. Since 2011, Connecticut has taken a more proactive role in the marketplace to keep
the state on track to meet its renewable energy commitments and seek the cleanest resources at a lower cost to ratepayers. Long-term contracts signed with large wind, solar, and biomass facilities under Public Act 13-303 Sections 6 and 8 are expected to save Connecticut ratepayers more than $235 million over the next two decades. Renewable development within the state has grown since 2011 as a result of programs such as the Low and Zero Emissions Renewable Energy Credit (LREC/ZREC) program; Project 150; the Connecticut Green Bank’s Residential Solar Incentive Program (Section 106 of Public Act 11-80); and the utility-owned renewable energy program (Section 127 of Public Act 11-80). Altogether, these programs and procurements
will provide about 2,400 GWh of renewable energy by 2020, or about 40% of Connecticut’s Class I Renewable Portfolio Standard (RPS) goal of 20% by 2020.1
Replacement of Coal and Oil Generation with Natural Gas Generation Has Lowered Costs
And Emissions from Historic Highs. Air pollution emissions in Connecticut have decreased
markedly, as low-cost natural gas-fired generation continues to displace coal and oil-fired generation. In 2013, natural gas generated 45% of the energy used in New England, a proportion that reflects the current generation capacity without additional gas infrastructure build-out. As a result of this move to gas generation, air pollution emissions from the electricity sector in Connecticut have decreased markedly: emissions of NOx, SO2, and CO2 fell 71%, 95%, and
28%, respectively, between 2007 and 2012.
R
EGIONAL AND
N
ATIONAL
C
HALLENGES
A
FFECTING
C
ONNECTICUT
R
ATEPAYERS
While Connecticut’s energy policies to date have delivered significant benefits to the state, the New England electric system is facing critical challenges that threaten to undermine the progress Connecticut has made.
Inadequate Natural Gas Delivery Infrastructure Is Threatening the Reliability and Affordability of New England’s Gas-Dependent Electric System During Peak Winter
Periods. Due to market structure, gas-fired generators — who now produce more than half of the
region’s electricity — are not contracting directly for the gas capacity they need to run. Demand for natural gas in New England has increased to a point that there is no longer enough “excess” pipeline capacity in the region to deliver the gas needed for reliable, competitively-priced electricity generation, particularly in the winter months when existing gas capacity is needed for building heating. Consequently, the wholesale spot market price of natural gas delivered to New England is significantly higher — from only about $1-3/MMBtu before 2012/13 to $8/MMBtu in 2012/13, and almost $14/MMBtu in December through February of 2013/14 — than the price of gas delivered to other regions in the country.2 During the winter of 2013/14, these increased delivered gas prices cost the New England region an additional $3 billion in wholesale electricity costs, driving up retail generation rates for families and businesses across the region.
This infrastructure challenge is expected to worsen as thousands of megawatts of non-gas power plants retire and are replaced with new gas generation. Gas pipeline capacity expansions that are expected to enter service in November 2016 as part of Connecticut’s Natural Gas Expansion Plan will provide some relief as gas demand continues to increase, but only temporarily. Near- and
1 Renewable procurements and programs to date will have attracted enough new resources to provide about 1,900
GWh by 2016, or approximately a third of Connecticut’s 20% Class I requirement in 2020.
2
This has also lifted annual average basis differentials from about $1/MMBtu before 2013 to about $3/MMBtu in 2013 and higher in 2014. Such high recent prices were driven largely by the extended “polar vortex” cold snap, but also by growing weather-normalized demand. Wholesale spot market prices have only a minimal impact on building heating rates.
longer-term measures instituted by the ISO New England (ISO-NE) rely primarily on backup oil generation to address the problem; these measures are likely to increase both emissions and electricity costs. Neither ISO-NE, the Federal Energy Regulatory Commission (FERC), nor key market actors such as electric generators or gas pipeline developers have proposed any meaningful market reforms that will cause electric market participants to invest in urgently needed, cost-effective gas pipeline infrastructure. Unless new infrastructure is built, the 2014 IRP projects average basis differentials of $4.6/MMBtu for winter months, or about $2/MMBtu on average annually (and this is roughly consistent with current futures prices for basis swaps as of the time of this writing). That exceeds historical annual average basis differentials by about $1/MMBtu, which adds as much as $8/MWh to wholesale electricity prices, 0.8¢/kWh to customer rates and approximately $250 million per year to Connecticut customer bills.3 If prices turn out to be higher, each additional $1/MMBtu would add up to another $250 million per year to Connecticut customer bills.
New Power Plant Needs Will Drive Up Capacity Prices for the Region. For more than a
decade, the New England region has enjoyed a surplus of electric generating capacity needed to meet reliability objectives. The 2014 IRP projects that Connecticut will continue to have plenty of capacity through 2024 and beyond, due to ample in-state generation, low demand growth, and new transmission built to reduce congestion.4 At the regional level, however, the New England capacity surplus is rapidly dwindling. Beginning in 2017, the region will face a capacity shortage of 143 MW, primarily due to the announced retirement of 4,100 MW of non-gas generation resources and a reduction in capacity imports.5 But that slight shortage should be only temporary. More than 1,400 MW of new supply has committed to enter the market by June of 2018, having “cleared” in ISO New England’s 9th forward capacity auction (FCA9).6 Capacity prices for 2018/19 cleared at $9.55/kW-mo (i.e., $8.81/kW-mo in terms of 2014 dollars). Prices could temporarily decrease thereafter, due to the large amount of capacity cleared for 2018/19. However, this IRP projects prices rising to $11/kW-mo (in 2014 dollars) in the long-term, corresponding to the Net Cost of New Entry when new generation is needed again. That level of capacity price will contribute 4.0¢/kWh to retail rates, compared to 2.2¢/kWh in 2017/18 and roughly half that in 2014.7
New England Needs More Class I Renewable Supply to Meet Regional RPS Targets. As
noted above, Connecticut’s renewable programs and procurements are helping to meet the state’s renewable (RPS) targets, but as state RPS targets rise across the region, Connecticut will compete with other states for a limited supply of new renewable resources. The 2014 IRP
3 Assuming 8,000 Btu/kWh average market heat rate and natural gas as the marginal fuel. 4
Connecticut is also expected to have enough local fast-start generation capability to meet its Locational Forward Reserve Market requirements through 2024.
5 ISO New England, Forward Capacity Auction 2017-2018 Totals Flow Diagram,
http://www.iso-ne.com/markets/othrmkts_data/fcm/cal_results/ccp18/fca18/fca_8_cso_flow_diagram.pdf.
6
New supply includes 1,060 MW of new generation and 367 MW of new demand response. In addition, imports increased by 212 MW.
7 Figures in the text are presented in nominal dollars; in real dollars, the expected increase is about 4¢/kWh in
2018/19 through 2024.
estimates that rising RPS requirements will add approximately 0.3¢/kWh8 to retail generation rates between 2017 and 2024, but this increase is smaller than predicted in earlier IRPs due to the cost savings achieved by Connecticut’s renewable procurements under Sections 6 and 8 of Public Act 13-303. The 2014 IRP projects that Connecticut will face a shortage of Class I renewable resources starting in 2015. Beginning in 2017, the region as a whole will face shortages of Class I renewables unless additional supply is procured or otherwise added to the market.
Natural Gas Commodity Prices Are Expected To Increase Modestly From Historic Lows.
Due to the composition of New England’s generation fleet, wholesale electricity costs are closely tied to fluctuations in natural gas commodity prices. Nationally, natural gas commodity prices have remained relatively low due to continued shale gas development, and New England enjoys these prices most of the year, when the region’s gas pipelines are not constrained. The 2014 IRP estimates that natural gas commodity prices will increase by a modest 3% per year (adjusted for inflation), adding 1¢/kWh in real, inflation-adjusted growth to customer electric rates between 2017 and 2024. Over the IRP study period, natural gas commodity prices (from outside of New England) are assumed to start at about $4/MMBtu in 2014 and escalate at an average 4.7% nominal rate to about $6.2/MMBtu by 2024 (only about 3% real escalation, when adjusted for inflation), well below the high historical price levels of 2007 and 2008. Even with these expected increases, gas commodity prices should remain well below the high historical price levels of 2007 and 2008.
Overall, the combination of increasing natural gas prices, capacity prices, and RPS requirements are likely to contribute to an increase in generation rates. In combination, these factors are likely to increase the Generation Service Charge component of customer bills from approximately 9.2¢/kWh in 2014 to 10.8¢/kWh by 2017, 13.5¢/kWh in 2019, and 15.9¢/kWh in 2024 in nominal terms.9
Emissions. Going forward, although far below historical levels, emissions are expected to
increase slightly as the region’s gas infrastructure constraints spur an increase in generation from Connecticut’s remaining coal-fired capacity. The stringency of forthcoming federal and state emissions rules, the retirement of coal, oil and nuclear units in the region, and the need for new generation capacity in the region may attract new natural gas fired generation to Connecticut, which could cause additional in-state emissions increases in the near term. DEEP is evaluating the NOx emissions limitations for existing power plants and industrial boilers and will seek to adopt any regulatory changes necessary no later than December 31, 2016.
8 Figures in the text are presented in nominal dollars; in real dollars, the expected increase is about 0.2¢/kWh in
2018/19 through 2024.
9
Figures in the text are presented in nominal dollars; in real dollars, rates are expected to increase from about 9.2¢/kWh in 2014 to 10.2¢/kWh in 2017, 12.2¢/kWh in 2019, and 13.1¢/kWh in 2024. DEEP recognizes that generation service charges (GSC) increased in January 2015 to 12.8¢/kWh for the first half of the year, which is above the levels forecasted for 2017. There are two reasons for this: First, the first half of 2015 reflects expectations for very high prices in January and February. This shows up in futures for 2015 deliveries. Second, is that the natural gas basis differential futures used was $2/MMBtu (annual average). Basis futures as of February, 2015 are almost 3$/MMBtu; updated projections of 2017 average GSC rates would be closer to 11¢/kWh.
Through 2024, state and regional CO2, NOx, and SO2 emissions are projected to remain much
lower than historical levels. NOx is projected to be well below state seasonal and daily targets.
CO2 is projected to be well below near-term state Global Warming Solutions Act (GWSA)
targets10 and will approximately track recently-tightened Regional Greenhouse Gas Initiative (RGGI) caps.11 Connecticut is a net energy exporter. Consequently, increasing in-state fossil fired generation that primarily serves out-of-state load may lock in a level of CO2 emissions that
forces Connecticut to reevaluate its planning to meet long-term, economy-wide emission reduction mandates under the Global Warming Solutions Act.
C
ONNECTICUT
’
S
P
LAN FOR
A
CHIEVING
R
ELIABLE
,
C
LEAN
,
AND
C
OST
-E
FFECTIVE
E
NERGY
S
UPPLY
:
R
ECOMMENDED
R
ESOURCE
S
TRATEGIES
:
R
ESOURCES
TRATEGY#1:
C
ONTINUE TOI
MPROVEC
OST-E
FFECTIVENESS ANDI
NCREASEE
NERGYS
AVINGS FROMC
ONSERVATION&
L
OADM
ANAGEMENTP
ROGRAMS ANDS
TATEB
UILDINGSConnecticut will continue to invest in cost-effective energy efficiency. The 2014 IRP projects that Connecticut’s increased investment in popular energy saving programs will nearly eliminate growth in state’s annual electricity consumption (projected to rise an average of only 0.05% per year), and reduce the growth in electricity consumption during peak demand periods to 0.5% per year. The Department recommends several actions to increase the savings from these programs, including (1) continuing to improve efficiency program design to deliver greater savings at lower costs, (2) continuing to focus energy efficiency programs on cost effective measures that provide values to customers by reducing energy and/or peak demand; and (3) continuing to invest in efficiency measures for state buildings. In addition, the Department and other agencies will continue their diverse efforts to pursue energy efficiency improvements through codes and standards. The Department also plans to study potential new opportunities in energy efficiency deployment, program design, and technology in an effort to identify future savings opportunities.
R
ESOURCES
TRATEGY#2:
P
URSUEO
PTIONS TOR
ETAIND
EMANDR
ESOURCESConnecticut will advocate for resolution of legal issues and, as needed, revive state programs to retain cost-effective demand response. Demand response (DR) — energy reduction that can be activated when demand for electricity is at its peak — saves consumers money by avoiding the need for new generation and lowering energy prices. A recent decision from the D.C. Circuit Court of Appeals has created legal uncertainty about whether DR can continue to participate in the ISO-NE wholesale electricity markets, and this uncertainty could drive up costs and
10 See Conn. Gen. Stat. § 22a-200a (mandating emissions reductions for 2020 and 2050). 11 Conn. Agencies Regs. § 22a-174-31, et seq.
compromise reliability if it affects DR’s participation future capacity auctions. DEEP will advocate for speedy resolution of the federal jurisdictional issues, and proposes reviving and improving state programs that support demand response in the event DR is effectively shut out of the ISO-NE wholesale markets.
R
ESOURCES
TRATEGY#3:
M
ONITORC
APACITYM
ARKET ANDP
LAN FORC
ONTINGENCIESConnecticut will be prepared to procure new generation if the capacity market fails. Under our deregulated market system, the ISO-NE annual capacity auction was set up to procure capacity for the region. The Department is encouraged that the forward capacity auction conducted in January 2015 attracted and retained more than sufficient supply for 2018/19. If conditions tighten in the future and subsequent auctions do not attract new capacity when needed, DEEP may pursue options within state authority to procure capacity resources to mitigate adverse reliability and economic consequences.
R
ESOURCES
TRATEGY#4:
P
ROCURER
ESOURCES TOA
DDRESSW
INTERP
EAKD
EMANDConnecticut will advance regional solutions to address natural gas infrastructure constraints. The inadequate supply of infrastructure to meet the needs of New England’s increasingly gas-dependent generation fleet is the most pressing problem facing Connecticut and New England at this time, threatening the reliability of the grid during cold winter weather and causing generation rates to nearly double across the region. In the absence of a credible market solution, the problem is left to the states to solve in several possible ways: by building out about 1.0 Bcf/day of natural gas capacity, by procuring approximately 5,000 MW of non-gas fired generation or measures that reduce demand for electricity, or by procuring a combination of these solutions.
This problem is too big for any one state to solve alone, and all New England states should contribute to a solution. Since 2013, all six New England Governors have been working closely on a regional energy infrastructure initiative to address this problem. The Department proposes to (1) utilize existing state authority under Public Act 13-303 to solicit Class I and/or large-scale hydropower that can offset some amount of natural gas demand, and (2) seek new authority from the legislature to run a competitive procurement open to a broad range of resources (including Liquefied Natural Gas (LNG) and gas pipeline capacity; transmission for large-scale hydropower or Class I renewables; and demand response, energy efficiency, and combined heat and power) that can cost-effectively resolve the gas infrastructure constraint, up to an amount that is proportional to Connecticut’s share of regional electric demand.
R
ESOURCES
TRATEGY#5:
P
ROVIDES
UPPORT FORI
NCREASEDCHP
D
EPLOYMENTConnecticut will seek support for the increased deployment of combined heat and power (CHP) systems. CHP systems can help participating customers reduce their energy bills and provide benefits to the electric system by reduceing capacity needs and emmissions. Connecticut deployed 91 MW of CHP through a capital grant program that was discontinued in 2011. The Department estimates that there is another 170 MW of cost-effective CHP potential in the state. DEEP proposes to revitalize incentive programs to help deploy this CHP potential, recognizing that CHP systems can provide special value in locations where it can power microgrids and/or avoid costly upgrades to the utilities’ electric distribution systems.
R
ESOURCES
TRATEGY#6:
S
UPPORTD
EPLOYMENT OFA
DDITIONALC
LASSI
R
ENEWABLESConnecticut must promote development of additional Class I renewable energy sources to achieve Class I Renewable Portfolio Standard requirements. The 2014 IRP projects that new Class I resources will be needed to help Connecticut meet its Class I RPS requirements, which are projected to be short starting in 2015. The procurements described in the 2014 IRP could potentially bring forward a significant amount of new Class I renewable projects, addressing the regional natural gas infrastructure constraint while helping to satisfy regional demand for renewables. While those procurements are ongoing, DEEP recommends continuing to refine and extend programs to support in-state Class I renewable generation at the lowest cost to ratepayers.
R
ESOURCES
TRATEGY#7:
R
E-
EVALUATER
EGULATORYP
OLICIES ANDI
NCENTIVES FORG
RIDM
ODERNIZATIONConnecticut must modernize regulatory policies and incentives for better integration of distributed resources. As part of an ongoing and evolving process, the Department will initiate a proceeding to evaluate the value of distributed generation.
R
ESOURCES
TRATEGY#8:
G
RADUALLYP
HASE-D
OWNREC
V
ALUES FORC
LASSI
B
IOMASS ANDL
ANDFILLM
ETHANEG
AS,
B
EGINNING IN2018
Connecticut will gradually phase down Renewable Energy Credit (REC) values for Class I biomass and landfill methane gas beginning in 2018. In response to the statutory requirement for developing a phase-down schedule, this IRP conducted an analysis of the role of biomass and landfill gas in meeting RPS requirements. The Department proposes to monitor RPS compliance and the capacity market and in the next IRP will establish a schedule that reduces REC values for these resources beginning in 2018. This approach appropriately reflects the resource adequacy concerns arising from the announced retirements of other major non-gas generation resources and a projected shortage of Class I resources.
T
ABLE OF
C
ONTENTS
Executive Summary ... i
Connecticut Energy Policies Are Securing Cheaper, Cleaner, More Reliable Electricity ... i
Regional and National Challenges Affecting Connecticut Ratepayers ... ii
Connecticut’s Plan for Achieving Reliable, Clean, and Cost-Effective Energy Supply: Recommended Resource Strategies:... v
Resource Strategy #1: Continue to Improve Cost-Effectiveness and Increase Energy Savings from Conservation & Load Management Programs and State Buildings ... v
Resource Strategy #2: Pursue Options to Retain Demand Resources ... v
Resource Strategy #3: Monitor Capacity Market and Plan for Contingencies ... vi
Resource Strategy #4: Procure Resources to Address Winter Peak Demand ... vi
Resource Strategy #5: Provide Support for Increased CHP Deployment ... vii
Resource Strategy #6: Support Deployment of Additional Class I Renewables ... vii
Resource Strategy #7: Re-evaluate Regulatory Policies and Incentives for Grid Modernization ... vii
Resource Strategy #8: Gradually Phase-Down REC Values for Class I Biomass and Landfill Methane Gas, Beginning in 2018 ... vii
Table of Contents ... i
I. Introduction ... 1
Procedural Background... 1
Market and Regulatory Context of the 2014 IRP ... 2
Overview of the 2014 IRP ... 5
II. Forecast of Resource Adequacy to Meet Average and Summer Peak Demand ... 6
Forecast: Annual Peak and Total Demand, 2014-2024 ... 6
Forecast: Adequacy of Electric Supply to Meet Summer Peak Demand, 2014-2024 ... 10
Forecast: Supply and Demand for Flexible Capacity to Meet Operational Needs ... 20
III. Meeting the Region’s Winter Peak Demand Reliably and Affordably ... 22
New England’s Gas-Electric Market Structure ... 22
A Shift Towards More Gas-Fired Generation ... 22
Contracting for Natural Gas Supply ... 23
Gas-Electric Reliability Solutions Implemented by ISO-NE ... 25
Impact of Gas Supply Constraints on System Reliability and Electricity Prices in New England ... 27
Forecast: Fuel Usage For Electric Generation, 2014-2024 ... 32
Forecast: Supply and Demand for Natural Gas ... 34
IV. Meeting Connecticut’s Commitment to Renewable Generation ... 40
Supply and Demand for Class I Resources ... 42
Connecticut’s Long-Term Contracting Programs for Class I Resources ... 42
Forecast: Supply and Demand for Class I Resources, 2014-2024 ... 46
Requirements Under Section 9 of Public Act 13-303... 49
Supply and Demand for Class II & Class III Resources... 50
V. Forecast for Wholesale Generation Prices & Retail Customer Rates ... 51
Forecast: Wholesale Energy Prices... 51
Natural Gas Capacity Constraints will Drive Significant Increases in Wholesale Electricity Prices ... 52
Prices OF Coal, Oil, and Emissions Allowances Will Have A Lesser Impact ... 53
Forecast: Wholesale Capacity Prices ... 54
Forecast: Connecticut Customer Generation Rates ... 56
VI. Managing Electric Sector Emissions to Achieve Climate & Air Quality Goals ... 59
State, Regional, and Federal Commitments to Reducing Criteria Pollutants and Greenhouse Gas Emissions... 59
Connecticut Global Warming Solutions Act (GWSA) ... 59
Regional Greenhouse Gas Initiative (RGGI) ... 60
National Ambient Air Quality Standard (NAAQS) ... 61
Regulation of Emissions from Existing Power Plants under CAA 111(d) ... 61
Forecast: Emissions Trends in the Electric Sector, 2014-2024 ... 62
CO2 Emissions Outlook ... 62
SO2 and NOx Emissions Outlook ... 63
VII. Improving the Security and Resiliency of Connecticut’s Electric Distribution System ... 66
Storm Preparedness and Response ... 66
Microgrids and New Technology ... 67
Cybersecurity Threats ... 68
VIII. Alternative Market Scenarios ... 70
Discussion of Alternative Market Scenarios ... 71
IX. Recommended Resource Strategies ... 76
Overview of Policy Objectives ... 76
Ensure Resource Adequacy ... 76
Address Class I RPS Shortage ... 78
Resource Strategy #1: Continue to Improve Cost-Effectiveness and Increase Energy Savings from Conservation & Load Management Programs and State Buildings ... 78
Resource Strategy #2: Pursue Options to Retain Demand Resources ... 84
Resource Strategy #3: Monitor Capacity Market and Plan for Contingencies ... 86
Resource Strategy #4: Procure Resources to Address Winter Peak Demand ... 88
Magnitude of Solutions Needed to Address Winter Peak Reliability Problem ... 89
Evaluation of Potential Resources to Address Winter Peak Reliability Problem... 96
Conclusion & Mechanisms for Procurement ... 104
Resource Strategy #5: Provide Support for Increased CHP Deployment ... 110
Resource Strategy #6: Support Deployment of Additional Class I Renewables ... 112
Resource Strategy #7: Re-evaluate Regulatory Policies and Incentives for Grid Modernization ... 114
Valuing Distributed Energy Resources... 115
Integrating Distributed Energy Resources into the Distribution Grid ... 116
Resource Strategy #8: Gradually Phase-Down REC Values for Class I Biomass and Landfill Methane Gas, Beginning in 2018 ... 117
Conclusion ... 118
13
APPENDICES
Appendix A: Detailed Tables Appendix B: Resource Adequacy Appendix C: Energy Efficiency Appendix D: Renewable Energy
Appendix E: Environmental Regulations Appendix F: Transmission Planning
Appendix G: Energy Security, Storm Resiliency, and New Technology
I.
I
NTRODUCTION
PROCE DUR AL B ACKGROUND
The 2014 Integrated Resources Plan (IRP) is the fifth IRP prepared for Connecticut, and the second IRP prepared by the Department of Energy and Environmental Protection (DEEP or the Department) since the Department was given the responsibility of preparing the IRP pursuant to legislation enacted in 2011.12 Connecticut law requires that an IRP be prepared every two years, and that it assess the state’s energy and generation capacity needs and provide a plan to meet those needs, lower costs, and advance the state’s environmental goals, giving priority to resources that reduce demand for electricity (including conservation, load management, distributed generation, combined heat and power facilities, demand response, and distributed generation) over resources that increase electric supply, such as transmission lines and power plants.13
The IRP must identify strategies to eliminate growth in electric demand, including demand during peak periods, and it must evaluate how different resources could help achieve compliance with environmental standards. The IRP must also consider the reliability of the electric system, including the diversity, availability, security, and environmental impacts of different fuel types, and the appropriate reliance on electricity imported into the region. Additionally, legislation enacted in 2013 specifically requires the Department’s 2014 IRP to propose a schedule for gradually phasing down the value of renewable energy credits assigned to biomass and landfill methane gas resources under Connecticut’s Renewable Portfolio Standards (RPS).14
This 2014 IRP is a ten-year plan to ensure that Connecticut’s electric ratepayers have access to cheaper, cleaner, more reliable electricity. The 2014 IRP analyzes trends in electric supply and demand, customer costs and rates, and environmental impacts over the 2014-2024 timeframe to identify strategies to secure an adequate supply of the optimal mix of electric generating resources to meet forecasted annual peak and energy demand in a way that minimizes costs and environmental impacts and keeps the state on track to meet its energy efficiency and renewable energy goals. The 2014 IRP also assesses risks to reliable electricity supply in Connecticut and strategies to effectively manage the state’s increased commitments to energy efficiency programs and renewable energy procurements.
The Department developed the 2014 IRP with analytical assistance from Connecticut’s Electric Distribution Companies (EDCs) and The Brattle Group, an economic consulting firm. On 12 DEEP issues this IRP pursuant to section 16a-3a of the 2012 Supplement to the General Statutes of Connecticut
as amended by sections 89 and 90 of Public Act 11-80, An Act Concerning the Establishment of the
Department of Energy and Environmental Protection and Planning for Connecticut’s Energy Future and Public Act 13-298, An Act Concerning Implementation of Connecticut’s Comprehensive Energy Strategy and Various Revisions to the Energy Statutes.
13 See 2012 Supplement to the General Statutes of Connecticut, Section 16a-3a(a). 14 Public Act 13-303, An Act Concerning Connecticut's Clean Energy Goals.
September 11, 2013, the Department conducted a public meeting to obtain stakeholder feedback on the proposed scope of the 2014 IRP. Stakeholders provided comments both at the meeting and afterwards through written submissions. DEEP took these scoping comments into account when outlining the 2014 IRP structure and analytical approach.15 While conducting the analysis for the 2014 IRP, DEEP staff also met regularly with subject area experts from the EDCs, Connecticut’s natural gas local distribution companies (LDCs), the Office of Consumer Counsel (OCC), and the Office of Attorney General to obtain feedback on analytical assumptions related to resource adequacy and electricity market modeling, energy efficiency, renewable deployment, energy infrastructure (including transmission and natural gas supply), environmental issues, emerging technology, and macroeconomic analysis.
On December 11, 2014, the Department released the 2014 IRP Draft for Public Comment. The Department held a technical meeting on January 12, 2015 to answer stakeholder questions about Draft IRP. The Department, also, held a public hearing on January 22 and heard oral comments on the Draft IRP. The Department accepted written comments from interested stakeholders through February 11, 2015. The Department received comments from 37 stakeholders on the Draft IRP on a variety of topics and important updates, including the results of the recent Forward Capacity Auction (FCA) 9 and the uncertain status of Cape Wind. DEEP took these comments into account when drafting this Final IRP and includes a summary of those comments in Appendix H.
M ARKE T AND RE GUL ATORY CONTEXT OF THE 2014 IRP
Connecticut and most other states in New England opted in 1998 to pursue a market-based approach to generation supply. Electric ratepayers were no longer required to cover the investment, contracting, and operational costs of a single regulated provider. Instead, multiple independent generators were allowed to compete to sell electricity into a regional wholesale market, and thereby to take on the risk (or reward) of bad investments and poor performance. Under this deregulated paradigm, the State does not determine how electricity is generated and transmitted, nor does it set prices for generation or transmission services. Both the wholesale market and the transmission system are administered by the New England Independent System Operator (ISO-NE) and regulated by FERC. Together, ISO-NE and FERC provide for open transmission access so that the lowest-cost available resources can be utilized (subject to transmission constraints), and ensure that market price outcomes are competitive.
The State’s role focuses on regulating the distribution system and some components of retail rates, overseeing energy efficiency programs, implementing environmental policies, setting renewable targets for the types of supply purchased by retail electric suppliers, occasionally soliciting contracts for particular generation resources on behalf of all customers, and engaging with ISO-NE in the development of rules for the generation market and in transmission planning processes.
15 Comments are available on the Department’s website under “CT General Statute – Section 16a-3a – 2014
Integrated Resources Plan,” at http://www.ct.gov/deep/energyfilings.
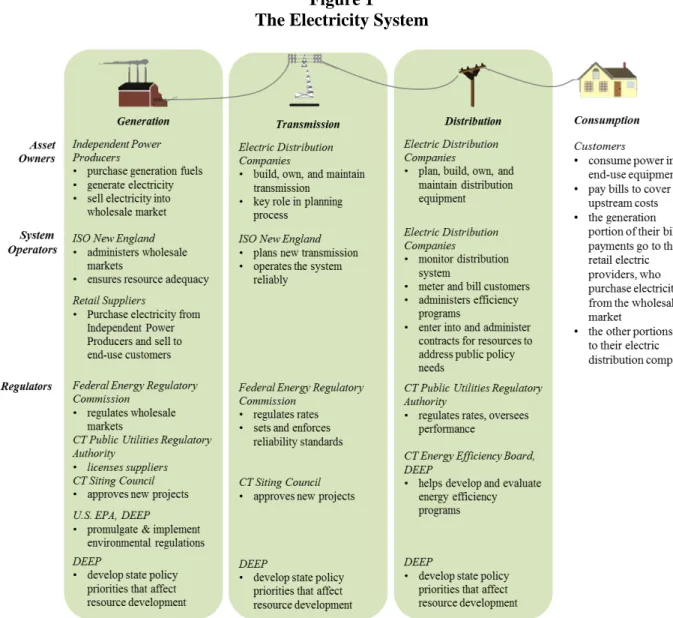
Figure 1 provides a basic illustration of the electricity system and the roles of the primary players that influence each component of the system, from generation to transmission to distribution to the customer. In addition to the entities depicted, there are many important financial players and service providers not included in the figure, such as lenders, energy traders, energy service companies, and curtailment service providers (who help customers manage their peak loads and sell load reductions as supply into the wholesale markets).
Figure 1 The Electricity System
Each of the parties identified in Figure 1 contribute in different ways to the cost, environmental impacts, and reliability (i.e., resource adequacy, transmission security, and distribution resiliency) of the electricity system. Figure 2 describes these contributions.16
16 “Approximate Current Rates” are based on a weighted average residential rate between Eversource (Rate 1) and
United Illuminating (Rate R), as of January 1, 2015.
Figure 2
Costs, Reliability, and Environmental Impacts of Electricity
It is important to note that the structure of the New England electric system is evolving, and the roles of the parties identified above are gradually being restructured, refined, and modernized to capitalize on emerging technologies and shifting consumer demands. The traditional utility model – one in which electricity is centrally generated, transmitted over high voltage power lines, stepped down in voltage, and locally distributed to customers – is facing a new set of challenges and opportunities that could initiate another period of innovation that propels the electric industry forward. Aging transmission infrastructure, more weather disruptions, and grid insecurity have threatened this system’s reliability and hampered its resiliency. The emergence of distributed, cost-competitive generation is challenging the incumbent, centralized model. These challenges, however, may revolutionize how utilities operate and deliver value to their customers as well as how utilities are regulated.
Information technology improvements have given electric utilities more agility to reroute power loads and diagnose disruptions in real-time. These improvements provide an opportunity for customers to manage their electricity usage more effectively than ever before and next-generation smart appliances will have the capacity to communicate directly with utilities for greater efficiencies. A mature industry is developing around these technologies to improve building system management and industrial system controls. Green banks, here in Connecticut and elsewhere, are closing the deployment gap of distributed generation technologies that are becoming more efficient and less expensive. New, supportive regulatory regimes and rate structures could reorganize utility revenue streams and accommodate these emerging trends. All
of these market trends allow utilities to supplement and diversify their generation options while building a more resilient and efficient distribution system.
On the regional and federal levels, regulatory uncertainty is creating disruptive and potentially costly threats to the reliability of the ISO-NE system and the economies of New England. The past year has seen FERC and court decisions that: 1) dramatically affect the role of Demand Response (DR) in the markets (court decision on Order 745); 2) foster substantial uncertainty regarding the states’ ability to contract for renewables to meet state mandates (various court decisions); 3) question FERC’s ability and willingness to ensure that competitive markets exist (Commissioner statements on the Forward Capacity Auction (FCA) 8 results); and 4) create regulatory gaps that do not leave a clear path to solve New England’s inadequate gas infrastructure.
OVERVIEW OF THE 2014 IRP
The 2014 IRP is organized into sections, beginning with an overview of the market and regulatory structure of the electric sector. Sections II-V describe a Base Case ten-year forecast of trends in the electricity sector that the Department believes are most likely based on publicly available data about electricity markets in Connecticut and the rest of New England, and models of capacity prices, capacity additions and retirements, and energy market dynamics.17 These sections describe: critical risks affecting key aspects of the electric sector, including the adequacy of generating resources to meet summer peak and total demand (Section II); adequacy of resources — including natural gas pipeline capacity — to meet the region’s winter peak demand (Section III); adequacy of renewable generation supply that has been procured to meet regional and state RPS targets (Section IV); the Base Case forecast for meeting electricity sector emission reduction targets (Section V); emissions from the electric sector in light of our climate and air quality goals (Section VI); and grid security and resiliency (Section VII). Section VIII outlines potential outcomes under alternative market scenarios modeled for the 2014 IRP. Section IX then introduces several Resource Procurement Strategies designed to mitigate the critical risks identified in the 2014 IRP.
17 With the 2014 IRP modeling system and analysis of key issues, the Department developed a Base Case,
representing a foundational ten-year electricity outlook. Projections begin with the “known and knowable” about today and the near-future, based on publicly available data about electricity markets in Connecticut and the rest of New England. Projections also rely on a modeling system with three major interconnected
components, including a demand forecast; a capacity model used to simulate capacity prices in ISO-NE’s Forward Capacity Market and to project new resource entry and retirement decisions; and the DAYZER model used to simulate ISO-NE’s energy market, generator operations, and locational marginal prices (LMPs).
II.
F
ORECAST OF
R
ESOURCE
A
DEQUACY
TO
M
EET
A
VERAGE AND
S
UMMER
P
EAK
D
EMAND
This section describes a Base Case ten-year forecast of trends in the electricity sector that the Department believes are most likely, based on publicly available data about electricity markets in Connecticut and the rest of New England, and models of capacity prices, capacity additions and retirements, and energy market dynamics.18 The goal of this section is to first predict the likely demand for electricity in Connecticut and across the region over the next ten years, and then to assess whether there is adequate supply of generation to meet that demand during the summer peak, which is the traditional resource planning focus. This section also evaluates the adequacy of flexible generation supply needed to meet system operational needs in the event of sudden generator outages or other contingencies.
FORE C AS T: ANNUAL PE AK AND TOT AL DE M AND, 2014-2024
Background and Context
Since 2007, Connecticut’s electricity consumption has declined sharply due to several factors, including the continued implementation of energy efficiency measures, and the economic recession. This trend manifested itself in reduced total annual demand and, to a proportionally smaller extent, reduced peak demand on the hottest weekday of the year (when all air conditioners are on).
The 2012 IRP projected that Connecticut, and the New England region, would have adequate generating resources to serve electricity loads reliably through 2022. The 2012 IRP also predicted that New England as a whole also would have adequate resources and likely not need new generation until 2022. The 2012 IRP did suggest that depending on market conditions, new generation could be needed as early as 2018. These findings were based on reasonable assumptions about market conditions, the completion of planned transmission projects, and generation retirements considered likely to occur given compliance with stricter rules for air emissions being promulgated by the U.S. Environmental Protection Agency (EPA).
18 With the 2014 IRP modeling system and analysis of key issues, the Department developed a Base Case,
representing a foundational ten-year electricity outlook. Projections begin with the “known and knowable” about today and the near-future, based on publicly available data about electricity markets in Connecticut and the rest of New England. Projections also rely on a modeling system with three major interconnected
components, including a demand forecast; a capacity model used to simulate capacity prices in ISO-NE’s Forward Capacity Market and to project new resource entry and retirement decisions; and the DAYZER model used to simulate ISO-NE’s energy market, generator operations, and locational marginal prices (LMPs).
One of the key recommendations of the 2012 IRP was to increase the state’s investment in additional energy efficiency to save money and reduce emissions. Connecticut law requires that any needs for new generation resources must “first be met” by procuring all cost-effective programs that reduce electric demand. Based largely on the findings of a 2010 study of electric efficiency potential in the state,19 the 2012 IRP recommended that budgets for the electricity portion of the state’s utility-administered Conservation and Load Management (C&LM) programs be increased to $206 million to achieve approximately 2% energy savings each year, reducing energy consumption by 0.4% per year on net if the economy grows as expected.
Consistent with that recommendation, Connecticut’s EDCs submitted an expanded budget for C&LM programs. Public Act 13-298, enacted in June 2013, directed the Public Utilities Regulatory Authority (PURA) to establish a Conservation Adjustment Mechanism (CAM) to collect up to 0.3¢/kWh to support increased investment in a C&LM Plan approved by DEEP.20
In October 2013, DEEP approved a three-year (2013-2015) C&LM Plan to achieve average annual energy savings of 1% through a budget of approximately $180 million per year, as well as a natural gas C&LM budget for the same period ranging from $44 million to $51 million per year. Although the C&LM Plan addresses implementation of energy efficiency to achieve both electric and natural gas savings, this IRP only addresses electric energy savings. While the electric portion of the budget is not at the “all cost-effective level” recommended in the 2012 IRP, this budget level fell within the range that could be readily funded through a CAM under Public Act 13-298, and would allow for a controlled ramp-up of program activity.21
2014 IRP Forecast
Looking forward, the 2014 IRP projects that summer peak electricity consumption will grow both in Connecticut and across the region, while total annual consumption will remain essentially flat over the study period due to energy efficiency programs that impact annual consumption more than peak consumption. Connecticut’s summer peak demand is expected to surpass pre-recession levels by 2015. Thereafter, factoring in continued energy efficiency, summer peak consumption is expected to increase in the 2017–2024 timeframe at a rate of 0.5% per year for Connecticut and 0.6% for New England, as shown in Figure 3.22 By contrast, total annual energy
19
KEMA, Connecticut Electric Residential, Commercial, and Industrial Energy Efficiency Potential Study, April 2010, prepared for the Connecticut Energy Conservation Management Board
20 The revenues collected through a CAM would be incremental to the 0.3¢/kWh charge already dedicated to
C&LM programs.
21
PURA established the electric CAM in an interim ruling December 23, 2013 and in a final decision May 2, 2014, with the CAM set at 0.3¢/kWh to fully fund the DEEP-approved budget. See Docket No. 13-11-14 (electric) and 14-03-1 (natural gas).
22 Although these peak load projections account for the load-reduction effects of energy efficiency, ISO-NE’s
Forward Capacity Market counts energy efficiency as a supply resource that receives capacity payments to help meet the gross, pre-efficiency forecast peak load. The IRP supply-demand projections shown later in this report are consistent with the ISO’s treatment, with efficiency treated as a supply resource, and with peak load shown as a pre-efficiency gross value.
consumption is expected to grow only 0.05% per year in the 2017–2024 timeframe in Connecticut and to decline slightly in the region, as shown in Figure 4.23,24
Figure 3
Peak Load (net of Energy Efficiency) — Historical and Projected
Connecticut (GW) New England (GW)
Figure 4
Annual Energy Consumption — Historical and Forecast for CT and New England
Connecticut (TWh) New England (TWh)
23 Figure 3 and Figure 4 are based on ISO-NE, 2013-2022 Forecast Report of Capacity, Energy, Loads and
Transmission, May 1, 2013 (“2013 CELT Report”), with adjustments to energy efficiency projections for Connecticut. A more recent version of this ISO-NE report was published during final production of this IRP. That report reflects only slightly lower loads that would not materially change the IRP’s conclusions.
24 Historical weather-normalized energy consumption figures for Connecticut are estimates provided by The
Brattle Group, based on ISO-NE data.
6.6 6.8 7.0 7.2 7.4 7.6 20 07 20 08 20 09 20 10 20 11 20 12 20 13 20 14 20 15 20 16 20 17 20 18 20 19 20 20 20 21 20 22 20 23 20 24 Actual (Weather-Normalized) Base Case Projection 25 26 27 28 29 30 20 07 20 08 20 09 20 10 20 11 20 12 20 13 20 14 20 15 20 16 20 17 20 18 20 19 20 20 20 21 20 22 20 23 20 24 Actual (Weather-Normalized) Base Case Projection 31 32 33 34 35 20 07 20 08 20 09 20 10 20 11 20 12 20 13 20 14 20 15 20 16 20 17 20 18 20 19 20 20 20 21 20 22 20 23 20 24 Actual (Weather-Normalized) Base Case Projection 126 128 130 132 134 136 138 20 07 20 08 20 09 20 10 20 11 20 12 20 13 20 14 20 15 20 16 20 17 20 18 20 19 20 20 20 21 20 22 20 23 20 24 Actual (Weather-Normalized) Base Case Projection
Expanded Efficiency Investments are Driving Projected Reductions in Demand
Declining energy consumption in the region is driven by growth in each state’s energy efficiency programs, as projected by the ISO-NE Energy Efficiency Forecast Working Group.25 In some states, particularly in Rhode Island and Vermont, new energy efficiency is projected to outpace load growth, leading to overall reductions in net demand.
The 2014 IRP assumes energy efficiency savings in Connecticut consistent with the 2013-2015 C&LM Plan,26 and a future IRP will update this assumption upon the completion of future potential opportunity assessments.27 The assumed savings reflects the 2007 and 2013 statutory requirements to achieve all cost-effective efficiency and ensure C&LM Plan budgets are “sufficient to fund all energy efficiency that is cost-effective or lower cost than acquisition of equivalent supply.”28
This is the basis for the expectation that annual electric program budgets of $180 million supported by a 6 mils systems benefits charge will continue. At this budget level, Connecticut’s electric C&LM programs are expected to reduce energy consumption by an incremental 290 GWh per year, on average.29
C&LM programs are assumed to experience diminishing returns, however, with costs per unit saved increasing at 5.3% (nominal) per year according to the assumed schedule described in Appendix C. As a result, the IRP forecasts 3,194 GWh and 413 MW of total energy efficiency savings between 2014 and 2024. While these estimates were used for the IRP, DEEP will revisit these assumptions for the next IRP.
The impact of new energy efficiency measures on Connecticut’s projected energy requirements has important implications for Connecticut families and businesses. While average customer
rates (¢/kWh) for power supply may increase, customers’ monthly bills could stay the same — or even decline — because of their energy efficiency.
25 ISO New England Energy-Efficiency Working Group, Final 2013 Energy-Efficiency Forecast 2016-2022,
February 22, 2013. Projected demand in states other than Connecticut is based on the 2013 CELT Report, which incorporates demand reductions due to the ISO’s 2013 EE forecast. Note that a more recent version of this ISO-NE EE report was published during final production of this IRP. See ISO New England, Inc System Planning,
ISO-New England Energy Efficiency Forecast Report for 2018-2023, June 3, 2014. The newer report assumes more energy efficiency compared to the prior report, but overall demand projections are similar to what was assumed in this IRP.
26 DEEP, 2013-2015 Electric and Natural Gas Conservation and Load Management Plan, available under “Public
Act 11-80 – Section 33 – 2013-2015 Conservation and Load Management Plan” at
http://www.ct.gov/deep/energyfilings [hereinafter “C&LM Plan”].
27 The resulting demand forecast shown in Figure 3 and Figure 4 is derived from ISO New England’s own
forecast, but with the following two modifications: (1) the forecast is extended to 2024 by continuing growth rates from the last year; and (2) the ISO-NE forecast includes an explicit estimate of energy efficiency savings in each state.
28 Section 16 of Public Act 13-298.
29 IRP assumptions differ slightly from the actual C&LM decision because the IRP analysis was completed before
the C&LM decision and its implications were finalized. The budget and savings reflect an approximation of the C&LM budget approved by DEEP for 2014 and 2015, as at the time of the construction of the Base Case EE model, the C&LM Plan was not final and approved by DEEP. For that reason, the cost rates assumed to derive the Base Case EE program savings also slightly differ from those assumed in the final C&LM Plan for 2014 and 2015.
FORE C AS T: ADEQU ACY OF ELE CTRIC SUPP LY TO ME ET SUMMER PE AK DEM AND, 2014-202 4
Having assessed the likely trends in demand for electricity overall and during summer peaks, the 2014 IRP next analyzes resource adequacy — in other words, whether Connecticut and the New England region will have enough generating capacity to meet expected summer peak loads, plus a reserve margin for supply outages and above-normal weather conditions. Overall resource adequacy is designed to ensure that the expected frequency of shedding load is only about 1 day in 10 years. Due to transmission constraints, ISO-NE sets resource adequacy requirements at both the regional and the sub-regional level:
• At the sub-regional level, the Connecticut Local Sourcing Requirement is composed of a Local Resource Adequacy (LRA) requirement and the Connecticut requirement under the Transmission Security Analysis (TSA).30 Whichever requirement is more stringent determines the applicable local requirement. Because the capacity required under the Transmission Security Analysis has historically been greater than the capacity required under the Local Resource Adequacy requirement, and recent ISO-NE values for the two have been nearly identical, the 2014 IRP’s Connecticut resource adequacy analysis focuses on the Transmission Security Analysis.
• At the regional level, the Net Installed Capacity Requirement (NICR)
determines the total amount of capacity needed to achieve the so-called “1-in-10” reliability target specified in ISO-NE’s Planning Procedures (and by the North American Electric Reliability Corporation) to limit the probability of disconnecting non-interruptible customers due to resource deficiency to no more than once in ten years. The NICR sets the total demand for capacity in ISO-NE’s forward capacity auctions. Notably, the ISO-NE has reduced its projection of the Net Installed Capacity Requirement from 14.4% above forecast gross peak load to 13.6% above peak. This change represents a decrease of approximately 240 MW.
To estimate whether the region and Connecticut will have adequate supply to meet the NICR and Connecticut reliability requirements over the next ten years, the Department first considered “known” generating and demand-side resources, i.e., those that already exist or new resources expected to be online, based on currently available information:
30 The LRA is established probabilistically to limit the expected load shed frequency to approximately one day in
ten years (local loss of load expectation of 0.105), and the TSA is defined deterministically based on the amount of supply needed to meet a high summer peak load, 10% chance of being exceeded, under various assumptions of transmission and supply availability. See Appendix B and
http://www.iso-ne.com/genrtion_resrcs/reports/nepool_oc_review/2011/icr_2014_2015_final_report.pdf.
• Existing Generating Capacity. As of May 1, 2013, there was 7,897 MW available in the Connecticut sub-area and 31,759 MW available region-wide in the summer of 2013 to meet reliability requirements.31
• Planned Conventional Additions. Planned conventional additions include
the 674 MW Footprint gas combined-cycle plant in Massachusetts and a 48 MW expansion to the Northfield Mountain pump-storage plant, also in Massachusetts, scheduled to be in service on June 1, 2016. The most recent forward capacity auction conducted in Janary 2015 for delivery year 2018/19 committed an additional 1,060 MW of new conventional generation, including the 725 MW CPV Towantic, LLC (Towantic) combined-cycle plant two LS Power 45 MW combustion turbines in Connecticut. The outcome of FCA 9 is not incorporated into the supply-demand projections shown in this IRP.
• Planned Renewable Additions. This IRP accounts for new renewable
resources that Connecticut and other states have procured to satisfy RPS requirements. These additions include 591 MW (77 MW capacity value) of onshore wind, located mostly in Maine and will begin operating by 2017.32,33 This includes including a 250 MW project in Maine that Connecticut procured under Section 6 of Connecticut’s PA 13-303, a 5 MW project in Connecticut that Connecticut procured under Section 127 of PA 11-80, 334 MW of projects that Massachusetts procured under Section 83(a) of the Green Communities Act, and 2 MW installed in 2013 in Massachusetts and Rhode Island.3435 Apart from onshore wind, this IRP projects nearly 2,700 MW (1,059 MW capacity value) of other renewable generation by 2017, from new biomass, anaerobic digestion, grid-connected solar PV, distributed solar, offshore wind,36 and fuel cell projects.37 The Department expects that some of
31
Capacity online is documented in the 2013 CELT Report. In the 2013 CELT Report, capacity at Bridgeport Harbor 2 is not included as existing capacity, i.e., that unit is given a zero Seasonal Claimed Capability. The more recent CELT report shows 7,627 MW in Connecticut and 31,173 MW region-wide available in summer 2014.
32
Differences between equipment capacity ratings and capacity values assigned by ISO-NE in resource adequacy analysis occurs because some resources (e.g., solar and wind) frequently are not fully available during defined reliability hours.
33 In Maine, planned new onshore wind resources will cause Maine’s in-state generation to approach its Maximum
Capacity Limit (MCL), i.e., the maximum amount of capacity that can clear given local load plus export constraints on the transmission system. However, this IRP assumes additional transmission is developed in Maine to integrate new renewable resources. Such upgrades, if built, are expected to reduce the likelihood of Maine reaching its MCL.
34
Massachusetts announced approximately 565 MW of wind resources under Section 83(a) of the Massachusetts Green Communities Act, but several projects subsequently dropped out of the proposed power purchase agreements, leaving only 334 MW procured.
35
These additions are also described in Appendix D (Renewable Energy), p. D-15 and D-16.
36
These figures precede the news in January 2015 that the 363 MW Cape Wind offshore wind project did not secure financing and the project’s long-term buyers cancelled their contracts, rendering that project unlikely to be completed by 2016, as assumed in this IRP.
37
These additions are also decribed in Appendix D (Renewable Energy), p. D-15 and D-16.
these resources will clear in the Forward Capacity Market as part of the Demand Curve exemption provided for in the decision issued by FERC.38 Note that some of the distributed renewables (mostly distributed solar in Massachusetts and Connecticut, and some fuel cells in Connecticut) that this IRP projected to develop but not count toward resource adequacy requirements might help meet the region’s capacity need under the new exemptions. Renewable supply and demand are discussed in more detail in Section III.C below.
• Planned Retirements. Based on retirement announcements, including
“Non-Price Retirement Requests” made to ISO-NE, the Base Case assumes about 1,540 MW in near-term retirements (Vermont Yankee, Salem Harbor units 3 & 4, Norwalk Harbor units 1, 2, & 10), and an additional 1,621 MW in retirements (mostly Brayton Point) by the summer of 2017. Only 348 MW of these regional retirements take place in Connecticut, including 342 MW at Norwalk Harbor 1, 2, and 10, and 6 MW at John Street (Wallingford) units 3– 5.
• Demand Resources. Demand resources in the ISO-NE Forward Capacity
Market are categorized as “active demand resources” or “passive demand resources.” “Active demand resources” have the ability to reduce participating customers’ loads when called upon by ISO-NE. If committed generating resources are insufficient to meet the peak demands, curtailment service providers sell these active demand resources, so-called “negawatts,” into the forward capacity auctions. “Passive demand resources” primarily reflect energy efficiency measures. Both active and passive demand resources are treated as supply resources in the capacity market. However, the ability of demand response resources to participate in the forward capacity market could be complicated by the recent court decision on FERC Order 745. Although the court decision has been stayed pending possible appeal, the ramifications of the court order to vacate Order 745 is still being analyzed, and the risks to demand response and the willingness of demand response to participate in the capacity market may have materially changed.
o For the 2014 IRP analysis, the Department counted all active demand resources committed in the forward capacity auction for delivery year 2016/2017, less Non-Price Retirement Requests submitted prior to the forward capacity auction for the delivery year 2017/18. This results in 904 MW of active demand resources region-wide, including 333 MW in the Connecticut sub-area.39
38 See ISO New England Inc., and New England Power Pool Participants Committee., FERC ¶ 61,173(2014),
(May 30, 2014 Order).
39 More recent market data shows slightly more active demand resources cleared in the 2017/18 auction: 1,080
MW region-wide, including 380 MW in Connecticut. Details of the active demand resources included in this IRP are shown in Figures 15 and 16 on p. B-22 and B-23 in Appendix B (Resource Adequacy).
o For passive demand resources, the Department counted all resources projected by ISO-NE, including resources cleared in the forward capacity auction for delivery year 2016/2017, and additional energy efficiency estimated by the ISO-NE Energy Efficiency Forecast Working Group. In addition, the Department counted incremental measures due to recently-approved expanded CL&M funding that exceeded that Working Group’s estimates for Connecticut, as discussed in the Demand Forecast section above. As a result, passive demand resources total 3,013 MW region-wide by 2024 (compared to about 1,150 MW region-wide in 2013), including 822 MW in Connecticut and 2,191 MW in the other states.
• New England East-West Solution (NEEWS) In general, ISO-NE
reconfirmed the need for the components of NEEWS. ISO-NE incorporated the Central Connecticut Reliability Project component of NEEWS as part of a more comprehensive study, the Greater Hartford/Central Connecticut Study (GHCC). The GHCC was completed in 2013, and found system overloads in areas across the State. ISO-NE identified the preferred solution to address the system overloads in 2014.40
• Net Imports. Net imports into New England are assumed to be constant at
1,730 MW for years 2016 through 2024, consistent with amounts cleared in ISO-NE’s forward capacity auction for the delivery year 2016/2017.41 This reflects 1,830 MW of imports and 100 MW of exports. No new transmission projects (such as Northern Pass) are assumed.
As noted above, past IRPs, including the 2012 IRP, projected sufficient supply throughout the ten-year time horizon. The 2014 IRP foresees a supply shortage much sooner, due primarily to recently-announced generation retirement. On February 5, 2014, ISO-NE announced that the results of the auctions for the 2017-2018 capacity commitment period failed to procure the resources required. ISO-NE stated that “The slim capacity margin and the resulting auction prices are a clear signal to the marketplace that the region needs more power generation and demand reduction capacity.”42
Connecticut Resource Adequacy
Resources within Connecticut are expected to be sufficient to meet Connecticut’s Local Sourcing Requirement as defined by the Transmission Security Analysis criteria through 2024. Within the Connecticut sub-area specifically, no new capacity will be needed because existing resources, planned transmission, and energy efficiency will exceed the local requirement beyond the ten-year IRP horizon. Local electric supply should be adequate barring the unexpected loss of
40 Vijayan, Pradip, Greater Hartford and Central Connecticut Area (GHCC) Solutions Study II, Planning Advisory
Committee meeting, July 15, 2014
41 More recent market data shows only 1,237 MW imports cleared in the 2017/18 auction. 42 ISO-NE Press Release, (2014) (February 5, 2014), available at
http://iso-ne.com/static-assets/documents/nwsiss/pr/2014/fca8_initial_results_02052014.pdf.
approximately 2,000 MW of supply. However, Connecticut reliability and generation prices would be as affected as other states if the entire region as a whole had insufficient supply.
As shown in Figure 5, Connecticut is projected to exceed the minimum requirement by 1,843 to 1,962 MW in 2017 through 2024 due primarily to three factors (and these surpluses would increase by 815 MW after counting the Towantic and LS Power generation units, which just committed to enter the market by June 2018; this recent development is not accounted for in
Figure 5 or in the rest of the discussion in this paragraph). First, Connecticut’s investment in
energy efficiency measures (about 40 MW per year) — including the expansion of funding for efficiency beginning in 2014 — will offset more than half of the state’s annual peak load growth (about 70 MW per year). Second, installation of components of the Interstate Reliability Project, a major transmission project for reliability, will bring 745 MW of existing generation at Lake Road43 electrically into Connecticut in 2017, and increase Connecticut’s import capability by 150 MW in 2018.44 In addition, outside of Connecticut, the planned exit of significant quantities of demand response and generation will make the region more dependent on Connecticut’s existing surplus capacity. Due to these tightened regional supply conditions, capacity prices are expected to increase to levels that will prevent further retirements in Connecticut and in the rest of the region.
43 Lake Road is physically located in Connecticut but does not currently count as a Connecticut resource. 44 The need for the Interstate Reliability Project has been reaffirmed by ISO-NE and the project was approved by
the Connecticut Siting Council in January 2013. The Interstate Reliability Project is part of a larger transmission project, the New England East-West Solution (NEEWS). The NEEWS project is planned to address several transmission security reliability issues, and will also support local resource adequacy in Connecticut as a side benefit.
Figure 545
Locational Resource Adequacy in Connecticut (MW)
Figure 5 Notes:
CCs = Gas-fired Combined Cycle EE = Energy Efficiency
DR = Active Demand Response
Critical Risk: Potential Loss of Critical Assets in Connecticut
Although the 2014 IRP projects that Connecticut will have sufficient generating resources to meet the Local Source Requirement, it is important to highlight critical risks that could adversely affect resource adequacy in the state. Only one plant in Connecticut is large enough to potentially leave Connecticut impaired if one or all its units were to retire: the approximately 2,100 MW Millstone nuclear plant. Millstone is the largest electric generating facility in New England and contains the second and thirdlargest individual generating units.
There is no indication that the Millstone units will retire within the 2014 IRP study horizon and, in fact, both units have been relicensed to operate until 2035 and 2045, respectively. However, with units that have been operating from 1975 and 1986 it is worth assessing the risk in case any unexpected factors caused it to shut down.
In all Market Scenarios examined in this IRP, Connecticut is projected to have sufficient capacity to meet its local resource adequacy requirement under the Transmission Security
45 Each year indicated on the figure refers to June of that year through May of the following, e.g. “2017” refers to
June 2017 through May 2018, corresponding to the delivery year for ISO-NE’s eighth forward capacity auction. Figure does not include the 725 MW Towantic plant or the two 45 MW units that cleared in FCA 9.