The Past, Present, and Probable
Future for Community Banks
Robert DeYoung, William C. Hunter and
Gregory F. Udell
The Past, Present, and Probable Future for Community Banks
Robert DeYoung*
Federal Reserve Bank of Chicago William C. Hunter
University of Connecticut Gregory F. Udell Indiana University
* The views and opinions expressed in this paper are not necessarily those of the Federal Reserve Bank of Chicago or the Federal Reserve System. The authors thank Robert Avery, Allen Berger, Paul Calem, Don Hester, Elizabeth Mays, Jim McNulty, Dan Nolle, Tara Rice, and Larry Wall for helpful comments. Please address correspondence to Robert DeYoung, Economic Research Department, Federal Reserve Bank of Chicago, 230 South LaSalle St., Chicago, IL 60604, phone: 312-322-5396, email:
[email protected]
.The Past, Present, and Probable Future for Community Banks
Abstract: We review how deregulation, technological advance, and increased competitive rivalry have affected the size and health of the U.S. community banking sector and the quality and availability of banking products and services. We then develop a simple theoretical framework for analyzing how these changes have affected the competitive viability of community banks. Empirical evidence presented in this paper is consistent with the model’s prediction that regulatory and technological change has exposed community banks to intensified competition on the one hand, but on the other hand has left well-managed community banks with a potentially exploitable strategic position in the industry. We also offer an analysis of how the number and distribution of community banks may change in the future.
JEL Codes: G18, G21, L11, O33
The Past, Present, and Probable Future for Community Banks
In most developed countries, the majority of banks and savings institutions continue to be small and community-based. But advances in information technology, new financial instruments, innovations in bank production processes, deregulation, and increased competition have created a less hospitable environment for community banks. The number of community banks is shrinking in most countries, as are their shares of loan and deposit markets. For example, by some measures both the number and market share of community banks in the U.S. have approximately halved since 1980.
Given these trends, it is natural to wonder if the community bank business model will continue to be viable in the future. The specter of a declining, or perhaps a disappearing, community banking sector has potentially serious implications for the U.S. economy. Most obviously, the small business sector – an historically crucial source of innovation and new job creation – has traditionally relied on small local banks for credit.
This paper presents a comprehensive view of the community banking sector in the U.S. in three parts. Each of these three sections includes numerous citations to the recent academic literature, and each is supported by a variety of data from the U.S. banking industry. First, we review the past three decades of change in the U.S. banking system, with a special focus on how deregulation, technological advance, and increased competitive rivalry have affected the size and health of the community banking sector.
Second, we use a strategic map approach to develop a theory of how deregulation and technological change have affected the competitive viability of community banks. The theory suggests that regulatory and technological change has exposed community banks to intensified competition on one hand, but on the other hand has left well-managed community banks with a potentially exploitable strategic position in the industry. We show that data drawn from the U.S. banking industry over the past three decades are largely consistent with these characterizations.
Third, we consider the number of community banks that will remain viable in the future. Projecting the future number and size distribution of commercial banks after the U.S. banking industry
has fully adjusted to deregulation is a treacherous exercise, and we do not pretend to be able to make accurate point estimates. Rather, we consider the recent financial performance of community banks relative to large banks, and, based on straightforward market principles, suggest which types of community banks, and how many of each type, are most at risk and least at risk going forward. Of course, this approach leaves the ultimate questions unanswered – How many community banks will exist in the future? What will these community banks look like? Who will these community banks serve? – so we close with a discussion of useful areas for future research on community banks.
Although our analysis focuses on community banks in the U.S., our major findings about the effects of technology, deregulation, and competition on community banking are likely to hold for other developed nations as well. New information, communication, and financial technologies travel easily across geographic boundaries, and ongoing financial deregulation in Europe and Asia are similar in spirit to the recent deregulation of U.S. financial institutions and markets. However, our analysis may be less appropriate for banks in developing economies.1
1. What is a community bank?
Before we can begin our analysis we need to define a community bank. Industry participants have little trouble distinguishing a community bank from, say, a regional bank or a money center bank. Based on their experiences, they can use an “I know one when I see one” test. But for someone trying to establish how community banks differ en masse from other types of commercial banks, establishing a definition of “community bank” is not an easy – and perhaps not even a fully solvable – proposition.
In practice, most research economists, industry analysts, and even some regulators simply establish an upper size threshold – typically around $1 billion in bank assets – and refer to all banks lying below that threshold “community banks.” Although bank size may be the best single proxy for identifying a community bank, this uni-dimensional approach will fail to identify some large community banks and will misidentify some small non-community banks. Community banking is a complex phenomenon, and bank size is really just an instrument for identifying banks with a richer set of
characteristics. The following qualitative definition captures some of these characteristics: “A community bank is a financial institution that accepts deposits from and provides transactions services to local households and businesses, extends credit to local households and businesses, and uses the information it gleans in the course of providing these services as a comparative advantage over larger institutions.” We also find the following more applied definition useful: “A community bank holds a commercial bank or thrift charter; operates physical offices only within a limited geographic area; offers a variety of loans and checkable insured deposit accounts; and has a local focus that precludes its equity shares from trading in well-developed capital markets.”
Limited data availability restricts us from following either of these two definitions to the letter. However, we are able construct a multi-dimensional filter that employs a number of these definitional characteristics to identify community banks and separate them from non-community banks. For our purposes, a community bank (a) holds less than $1 billion in assets (2001 dollars); (b) derives at least half its deposits from branches located in a single county;2 (c) is domestically owned; (d) has a traditional product mix that includes portfolio lending, transactions services, and insured deposits; and (e) is either an independent bank, the sole bank in a one-bank holding company, or an affiliate in a multibank holding company (MBHC) comprised solely of other community banks. Further details of our data selection methods are included below.
2. That Was Then, This is Now
In this section we first take a look at the world of community banks in the U.S. in the 1970s. Then we examine the changes over the intervening decades that radically altered this world. As we will see, much of the impetus for change came from outside the banking industry. These external factors exposed the entire banking industry to new competitive forces that affected both the lending and deposit-taking sides of the balance sheet, and transformed the income statements of many banking companies as well. Fueled by innovation and deregulation the industry was dramatically transformed. In the process
the world of community banking has been redefined. We conclude this section with a look at community banking today – the new world of community banking.
2.1 An Idyllic World for Community Banks in the 1970s.
It is impossible to describe the U.S. commercial banking environment in the 1970s without first noting that it was very much a protected industry. Government regulations shielded the industry from geographic competition, from product competition and, at least on part of its business, from pricing competition. Indeed, banking – and particularly community banking – was a comfortable place to be.
Protection from geographic competition was anchored by The McFadden Act of 1927 that prohibited interstate branch banking. The only loophole in the McFadden Act was cross-border banking through multibank holding companies. However, exploitation of this loophole required state approval and not a single state in the 1970s permitted the out-of-state ownership of one of its banks by a multibank holding company.3 In addition to these interstate restrictions, most states imposed restrictions on intrastate branching. Some states at the time, most notably Illinois and Texas, prohibited any branching.4,5
On the product dimension banks were insulated from competition from investment banks, insurance companies, and brokerage firms by the Glass-Steagall Act that effectively isolated commercial banking as a separate and highly regulated financial sector. Moreover, depository institutions such as savings and loans and credit unions were not permitted to compete with banks for their main line of business, commercial loans. On the deposit dimension, banks were prohibited throughout most of the 1970s from competing on interest rates by Regulation Q which imposed interest rate ceilings on all deposit rates except negotiable CDs above $100,000.
By 1980 there were still 14,434 chartered commercial banks in the U.S., and 14,078 of these banks held less than $1 billion (2001 dollars) of assets – as discussed above a standard crude definition of a community bank.6 By this measure, community banks represented 33.4 percent of the industry’s assets. The banking industry was still the largest category of financial intermediary in the U.S. with over 35
percent of the nation’s intermediated assets and when combined with thrifts (including credit unions), depository institutions as a whole had nearly 60 percent of intermediated assets.7 Nevertheless, Glass-Steagall assured that financial markets were quite segmented and that the business of banking was focused on offering deposits and loans. However, within these product categories, the banking industry was a major player and in some markets the dominant player. For example, the industry’s deposit franchise made it the dominant provider of transactions services through checkable deposit accounts. Depository institutions were also a major provider of low risk relatively liquid investments (savings accounts) and low risk short- and intermediate-term investments (time deposit accounts). As a result depository institutions were an extremely important investment vehicle for consumers. This is reflected in Table 1 which shows consumer financial assets based on the Federal Reserve’s Survey of Consumer Finance (SCF) in 1983, the first year this data was available. Lines 1, 3 and 4 are the fraction of total financial assets that consumers allocated to depository institutions. In 1983 consumers allocated 22.7 percent of their assets to depository institutions.
Another important feature of the 1970s deposit franchise was the fact that the payments system at the time was predominantly paper-based. In a banking world that emphasized brick and mortar delivery, community banks’ enjoyed substantial market position because large commercial banks were constrained from competing in local markets. In states with limited or no branch banking this advantage was especially significant, because large banks simply could not branch into local markets. In addition, at least in the first half of the 1970s, ATM machines had not been widely adopted, thus further shielding local community banks from competition from larger banks.
With respect to lending, banks and thrifts were not the only players. However, loan markets were generally segmented and in some of these markets banks and thrifts were the dominant players. For example, at the beginning of the 1970s the residential mortgage market was mostly a banking and thrift market. Some residential mortgages were held by insurance companies and finance companies and some were held in securitized pools. These holdings, however, were relatively small compared to banks and thrifts. In particular the securitization market was still in its infancy and limited mostly to Ginnie Mae
passthroughs. Community banks were significant players in the residential mortgage markets at the close of the decade, allocating about 40 percent of their loan portfolio to real estate loans in 1980 (see Table A-5 in the Appendix).
Banks and thrifts competed with finance companies for consumer loans although, even here, there appears to have been considerable market segmentation. Consumer finance companies tended to attract the higher risk and subprime consumer borrowers while banks, thrifts and possibly captive auto finance companies (e.g., FMAC, GMAC) tended to attract the prime consumer borrower.8 Again, because of the extensive limitations on branch banking, community banks enjoyed an advantage in consumer lending over larger banks with their local market power. Community banks allocated about 30 percent of their loan portfolio to consumer loans in 1980 (see Table A-5).
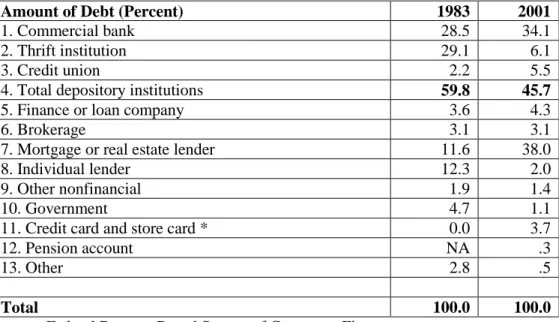
Table 2 provides an overall picture of consumer debt from the perspective of the consumer. It shows the allocation of consumer debt by institution in 1983, the first year that this data was available. The data clearly show the importance of depository institutions in providing consumer finance. Consumers obtained 59.8 percent of their debt from depository institutions in 1983, much of it in the form of residential mortgages, with the remainder spread out among a number of different sources.
Commercial lending in the 1970s reflected some segmentation both across financial institutions and within the banking industry itself, although larger commercial banks made loans to business borrowers of all sizes. During most of the 1970s large commercial banks were still the major source of short-term financing to large businesses. Life insurance companies were also active in business finance but their activities were confined to longer term financing to medium-sized businesses and some large businesses. Small businesses are generally unable to get long term financing other than to finance specific fixed assets such as equipment and real estate (see Carey et al 1993). Community banks, constrained by legal lending limits, focused on lending to smaller businesses.9 Community banks allocated on average between 20 and 30 percent of their loan portfolio to commercial loans in 1980 (see Table A-5).
Banks, including community banks, faced some competition from commercial finance companies that were active in small and middle market commercial lending. Again, however, there was considerable segmentation. Commercial finance companies tended to focus on higher risk borrowers by providing asset-based loans or by factoring receivables.10 Asset-based loans are loans that are primarily based on collateral, specifically accounts receivable, inventory and equipment, that involve a high intensity monitoring technology. This monitoring can include daily submission of new invoices, collection of receivables through lock-box arrangements, daily calculation of loan availability, and periodic field audits conducted by the lender. Factoring involves the purchase of receivables by a financial intermediary usually without recourse.11 Some large banks and some community banks provided asset-based lending and/or factoring but in the 1970s this segment of the market was mostly supplied by commercial finance companies including some large ones such as Commercial Credit, Walter Heller and Talcott. Not infrequently, however, banks including some community banks would participate with commercial finance companies with the understanding that if their borrower’s risk profile improved in the future the commercial finance company would return its share of the loan to the bank.
2.2 Three Decades of Change
The idyllic world of community banking relied on a set of strict federal and state banking regulations that shielded local banks from outside competition, prevented the entry of nonbank financial institutions into traditional banking product markets (and vice versa), and prevented price competition among banks for transactions deposits. Volatile economic conditions, technological change, and an anti-regulation evolution in political and economic thought in the 1970s, 1980s, and 1990s led to the dismantling of these banking regulations, and brought an end to the comfort zone of community banks.
The 1970s: Volatile interest rates and the beginnings of technological change. In the late 1960s and early 1970s money market interest rates regularly exceeded the Regulation Q ceiling on interest rates. The gap became huge after the Federal Reserve changed monetary policy in 1979 with the 90 day
Treasury Bill rate at one point exceeding the passbook savings account ceiling by over 1000 basis points. As a consequence, disintermediation became a problem for the banking industry in the late 1970s, as deposits flowed out of low-yielding bank deposits and into higher yielding investments offered by nonbank institutions not constrained by Regulation Q. Community banks and thrifts were more dependent on retail deposits and less dependent on large denomination CDs than large banks. As shown in Table A-5, large banks relied on large denomination deposits for over 30 percent of their funding in 1980 while large, medium and small community banks relied on this source for only 20 percent, 15 percent and 9 percent respectively. Thus, the potential threat from disintermediation was arguably more acute for these smaller institutions because they were more dependent on the types of deposits that were generally constrained by Regulation Q ceilings.
The threat from disintermediation in the late 1970s was much more serious than it was when interest rates spiked earlier in the decade when retail customers had few alternatives to bank deposits for liquid investments. The minimum denominations on money market instruments such as negotiable CDs and commercial paper were too high for the small investor. However, money market mutual fund (MMMF)s, a monumentally important financial innovation first introduced in 1971, would inalterably change the financial landscape in the U.S. MMMFs combined two features that gave them a big competitive advantage over Regulation Q-constrained bank deposits: 1) money market investment returns and 2) checkability. Later in the decade Merrill Lynch took this innovation one step further with its Cash Management Account by adding a third dimension, a brokerage account. In the mid-1970s market interest rates receded some and as a result the flow of funds into MMMFs did not reach a level that threatened the banking industry’s deposit franchise, but in the late-1970s MMMFs once again began to grow dramatically. Moreover, innovations elsewhere in the financial services sector created even more alternatives to bank deposits such as the universal life insurance policy. Universal life combined term life insurance with a money market-linked savings component. The impact on banks and thrifts was acute.
Other innovations had an equally powerful impact on retail banking. One of the most important was the Automated Teller Machine (ATM), which had an impact on both the cost (cheaper to produce)
and the quality (limited options, but more convenient) of transactions services. Banks had initially hoped that the ATM, as its name implies, would be a substitute for human tellers, and by extension perhaps even a partial substitute for bank branches. However, as seen in Figure 1, as the number of ATMs has increased, so has the number of bank branches. These data suggest a number of important strategic roles for bank delivery systems, e.g., increased customer convenience, revenue generation via third-party ATM fees, person-to-person contact with customers at brick-and-mortar branches.
Other alternatives to brick and mortar banking began to appear after the ATM. Some banks began offering pre-Internet retail computer banking in the 1980s where customers with a computer and modem could pay bills and transfer money between accounts over telephone lines. Credit cards and debit cards expanded rapidly in the 1970s and 1980s represented yet another alternative to the traditional bank delivery system.12
The 1980s: Regulatory reaction and further technological innovation. During the 1980s it became increasingly difficult to maintain a regulatory environment that could protect the banking industry from product competition, interregional competition and interest rate competition – and at the same time insure a vibrant and healthy banking industry. Market conditions and financial and technological innovation simply conspired against preservation of the old regime. Regulatory change became inevitable and necessary to rationalize the new reality.
On some dimensions this change came quickly. For example, the huge spike in interest rates beginning in 1979 led to the relatively rapid legislative dismantling of Regulation Q that culminated with the passage of the Garn-St. Germain Depository Institutions Act in 1982. This Act also allowed, among other things, for thrift institutions to compete directly with community banks by making commercial loans.
Next came the dismantling of the McFadden Act both at the intrastate and the interstate levels. This process took more time than the dismantling of Regulation Q, but its effect was nevertheless equally dramatic. At the intrastate level 32 states liberalized their in-state geographic restrictions on banking
between 1980 and 1994.13 At the interstate level, regulatory reform began in the early 1980s with state legislative initiatives to exploit the multibank holding company loophole in the McFadden Act. States entered into reciprocity agreements where participating states agreed to allow cross-border bank ownership through multibank holding companies. By the end of the decade, all but six states allowed some sort of interstate banking with most being part of large regional pacts (Berger, Kashyap and Scalise 1995).
Like geographic liberalization, expansion of banking powers occurred somewhat more incrementally than interest rate liberalization. Nevertheless, after two decades the result was the same: a substantial elimination of most barriers. On the retail side, the first major change was arguably the creation of the money market deposit account (MMDA) by the Garn-St. Germain Act in 1982. MMDAs gave banks a vehicle to compete directly with MMMFs. Until the end of the 1990s most of the other changes were facilitated by Federal Reserve Board rulings. The Federal Reserve was given the authority under the 1956 Bank Holding Company Act and the 1970 Amendments to the Act to determine what activities could be conducted by banking organizations subject to the condition that these activities are “closely related to banking”. This and additional legislation imposed some fairly strict limitations on some product lines such as insurance. Although even here, state chartered banks were able to exploit some state-level opportunities for regulatory arbitrage. Delaware, for example, offered the opportunity for large bank holding companies to established state-chartered subsidiaries with their own insurance affiliates.14
Banks challenged these restrictions on a wide variety of fronts including municipal bond underwriting, commercial paper underwriting, discount brokerage, managing and advising open- and closed-end mutual funds, and underwriting mortgage-backed securities. On some challenges banks were successful and on some they were not, with many of the challenges being adjudicated in the courts with opposition of trade groups such as the Securities Industry Association. Then in 1987 the Federal Reserve allowed banks to form investment banking subsidiaries (i.e., Section 20 subsidiaries) and in 1989 the
Federal Reserve granted limited corporate securities underwriting privileges to a select group of banks. The limitations and the number of authorized banks increased in the following years.
Not only did innovation conspire to drive changes in the regulation of the financial services industry, it also fundamentally changed the nature of many aspects of the business of banking beyond just the ATM machine discussed above. This is not entirely surprising given that banking is the most IT-intensive industry in the U.S. as measured by the ratio of computer equipment and software to value added (Triplett and Bosworth 2002, Table 2).
One of the most dramatic examples of innovation was securitization. Unlike the changes just discussed that involved the government getting out of the way (i.e., the dismantling of Regulation Q, McFadden, and Glass Steagall), securitization is a story about government intervention right from the beginning. Securitization began in the 1960s with the creation of the Ginnie Mae passthrough and exploded in the 1980s with the development of the collateralized mortgage obligation. Securitization was an innovation that had both a financial and a technological component. On the financial dimension, securitization involved the synthetic creation of a liquid traded security from a pool of illiquid nontraded assets where often the payoff characteristics are altered significantly from those of the underlying assets. Securitization also had an important technological component as new information technology allowed for the efficient compilation, computation and dissemination of information related to the performance and operation of the asset pools. Securitization spread from the residential mortgage market to many other types of financial assets including consumer loans and accounts receivable. Since the 1970s the growth in securitization has been phenomenal with the stock of asset-based securities growing from several hundred billion dollars to almost $4.5 trillion in 2001. This is almost as big as the entire assets of the banking industry ($5.7 trillion) (Berger 2003). Securitization has also become an important tool for community banks to geographically diversify their otherwise locally-concentrated loan portfolios.
An important feature of the securitization market today is the role of two government-sponsored enterprises (GSEs), the Federal National Mortgage Association (Fannie Mae) and the Federal Home Loan Mortgage Corporation (Freddie Mac), in the residential. At year-end 2000, investors held $1.2 trillion of
mortgages securitized by Fannie Mae and Freddie Mac. In addition, Fannie Mae and Freddie Mac held another $1 trillion dollars of mortgages and mortgage-backed securities directly in their own portfolios (Passmore, Sparks and Ingpen 2001).
Fannie Mae and Freddie Mac receive an “implicit” government subsidy because investors treat their debt as if it were backed by a guarantee of the U.S. government. A key public policy issue is whether this government subsidy affects the competitive structure of the residential mortgage market. The evidence suggests that Fannie Mae’s and Freddie Mac’s policies have slightly lowered residential mortgage rates (due to the implicit GSE subsidies) and as a result have encouraged a housing stock that is inefficiently large (e.g., Hendershott and Shilling 1989, ICF 1990, Cotterman and Pearce 1996, Passmore, Sparks and Ingpen 2001, White 2003).15
Technology has also had an impact on consumer and micro business lending in terms of the increasing dependency of these types of lending on credit scoring. First introduced in the 1950s credit scoring has become widely used in consumer and mortgage lending over the past 30 years (Mester 1997). According to the Federal Reserve’s 1996 Senior Loan Officer Survey, those banks that use credit scoring in their credit card business virtually always use it in approving applications. About 80 percent of those who use credit scoring also use it in determining from whom to solicit applications, and about 20 percent use it in setting loan terms. The type of model employed will depend on how it is used. Banks increasing rely on “bureau scores” to solicit and pre-screen applicants. Bureau scores are credit scores based solely on the history of individuals as reflected in credit bureau reports as opposed to “application scores” that weigh other factors (e.g., income, employment) in addition to credit bureau information (Avery, Bostic, Calem and Canner 1999).
Given the paucity of research in this area, it is difficult to quantify the economic impact of credit scoring on the consumer loan market. For example, we are not aware of any rigorous study that has examined the improvement in the power of credit scoring since the 1970s. From a statistical standpoint, the methodology used today (i.e., regression, logit and discriminant analysis) was generally available in the 1970s. Computational costs are certainly lower today and the data sets are certainly better. However,
in the absence of hard empirical evidence, it is not obvious the extent to which these factors would have been sufficient to drive an economically meaningful improvement in the predictive power of the models since the 1970s. More fundamentally, it is still an open question whether credit scoring does a better job of risk assessment than human analysis and by how much. There does not appear to be sufficient definitive research on this.16 It does seem safe to assert, however, that credit scoring has significantly reduced the unit cost of underwriting an individual consumer loan, and as a result has increased the efficient size of consumer loan underwriting operations. It is quite possible that the benefits from credit scoring are dominated by these cost saving and scale effects.
The 1990s: Industry consolidation, nationwide financial services markets, and widespread adoption of new banking technology. Banking industry deregulation reached its zenith during the 1990s. In 1994 Congress rationalized the patchwork of state-by-state geographic rules by passing the Riegle-Neal Interstate Banking and Branching Efficiency Act which effectively repealed the McFadden Act. The immediate response was the highest-ever five-year run of bank mergers in U.S. history, in terms of both the number and the value of the banks acquired (Berger, Buch, DeLong, and DeYoung forthcoming). Only a relatively small number of these M&As were ‘megamergers’ (i.e., combinations of two banks each with over $1 billion in assets). The majority of mergers were between two community banks, and in the vast majority of mergers the merger target was a community bank (DeYoung and Hunter 2003).
Feeling pressure from a series of rulings by the Office of the Comptroller of the Currency that granted increased product powers to national banks, and an announced merger between the largest bank in the U.S. and one of the world’s largest insurance companies (CitiBank and Travelers), Congress followed nationwide geographic deregulation with broad-based deregulation of banking powers. Specifically, in 1999 Congress passed the Graham-Leach-Bliley Act which effectively repealed the Glass-Steagall Act.
These congressional acts ratified the decades-long deregulation movement, and as such they marked the culmination of story lines that began in the 1970s and 1980s. But the true breaking story of the 1990s was the widespread adoption of new financial and information technologies by almost all U.S.
banks. These technologies have been applied differently by, and had different strategic and competitive implications for, large banks and small banks.
In the 1990s credit scoring was adopted by many large banks in their micro business lending. Banks have different definitions for this class of lending but the ceiling loan size generally lies between $100,000 and $250,000. Some banks have used their own proprietary models and others have purchased credit scoring models from outside venders. In general these models rely on information about the entrepreneur (e.g., credit bureau reports), mercantile credit information from third party information exchanges (e.g., Dun and Bradstreet), as well as firm specific information.17 Recent research indicates that this technology has been associated with an increase in overall lending and that it has enabled banks to reach a more marginal class of borrowers. This seems to be particularly true when banks use automated acceptance/rejection and pricing decisions based on credit scores rather than more discretionary decisionmaking where credit scoring is not the only input. These results could obtain even if micro-business credit scoring was no better at predicting failure (or even worse) but significantly less expensive than human due diligence (Frame, Srinivasan, and Woolsey 2001, Berger, Frame and Miller 2002). 18
Information and financial technology has also likely lowered the cost and increased the quality of third party information exchange, although hard empirical evidence on this is lacking. Research on the effectiveness of exchange information at the macro level indicates that in countries that have either private exchanges or public credit registries interest rates and economic growth are higher (Jappelli and Pagano 1999). Certainly, on both the consumer side (credit bureaus) and on the business side (mercantile credit information exchanges such as Dun and Bradstreet) the data bases have grown significantly. The delivery system has also changed. Credit reports and D&B reports can now be sent instantly over the Internet. As a result lenders can promise quicker turnaround on credit applications which is important in consumer lending and micro-business lending.
Financial technology has also had a significant effect on how banks manage risk. After the run-up in interest rates in the 1970s caught many banks with an asset-liability miss-match, the banking
industry began to adopt interest rate risk management techniques to measure their interest rate exposure. These began with simple GAP-based programs and later evolved into more sophisticated duration-based programs.19 Advances in financial engineering and the development of new and wider derivatives markets had a very positive effect on the ability of banks to implement interest rate risk management strategies. Following some highly visible financial fiascos including Barings PLC, Orange County and Metallgesellshaft, banks began to implement market risk management tools to measure and manage their trading risk in the mid-1990s. In the latter half of the 1990s banks began to adopt similar value-at-risk based tools for managing credit risk.20 The proposed new Basle Capital Accord takes this one step further using these new credit tools in linking capital requirements to credit risk. An important aspect of all of these initiatives is the heightened demands they have placed -- and will place in the future under the new Basle Capital Accord -- on information technology. Banks who opt for the advanced version of the new Basle capital requirements, for example, will be required to estimate the probability of default (the “PDs”) and the likely loss given default (the “LGDs”) on all of their loan portfolios over the business cycle (Basle Committee 2002).21
It is quite possible that the biggest impact of technology on the banking system may have been on the payments system. Over the past three decades electronic payments technologies have been implemented that involve transferring funds electronically with little paperwork.22 One study, for example, found that the number of checks paid during the second half of the 1990s was falling at a rate of about 3 percent per year while credit card payments and debit card payments were increasing during this period by 7.3 percent per year and 35.6 percent per year respectively (Gerdes and Walton 2002, Table 2). These results indicate that the share of payments by checks to total payments (payments by checks plus credit cards plus debit cards) fell from 80.8 percent to 64.6 percent. Another study found that while check use overall continued to rise modestly in the 1990s, it fell dramatically in retail payments (Humphrey 2002). Data in this study also indicate that the share of check payments has been falling - over the ten years from 1990 to 2000 the share of payments by check to total payments has fallen from 87.8 percent to 72.3 percent.
The technology-driven switch from paper-based payments to electronic-based payments is also reflected in the steep increase in the use of the automated clearing house (ACH). This system is used for regular payments such as monthly mortgages, direct deposits, etc. ACH volume handled by the Federal Reserve increased at a 14.2 percent annual rate from 1990 to 2000 (Berger 2003). The impact on cost reduction for ACH payments was dramatic. Over the 1990-2000 interval the cost declined in real 1994 dollars from $0.959 to $0.158, a reduction of 83 percent (Berger 2003). Reductions in the cost of processing electronic payments has generally been greater than cost reductions from technology in processing checks and cash payments where the reductions have been more modest (Bauer and Ferrier 1996, Bohn, Hancock, and Bauer 2001, Gilbert, Wheelock, and Wilson 2002).
Internet banking has been a more recent effect of technology on the banking industry. It is changing the landscape of the financial services industry by reducing the importance of geography and reducing the cost of transactions. Banks today offer Internet services in a wide variety of forms including full transaction sites that allow customers to make deposit and loan transactions on line. Most banks employ a “click and mortar” distribution model that combines a transactional Internet site with their traditional brick-and-mortar offices and/or ATM networks. In its most extreme form, there are a relatively small number of Internet-only banks that offer their services exclusively on the Internet. As of July 2002 there were just 20 such Internet-only operations. Approximately another dozen Internet-only institutions have failed, been acquired or voluntarily liquidated, and in addition several large banks integrated their Internet-only units into the main bank after poor stand-alone performance.23 Figure 1 suggests a complementarity among all types of bank distribution channels. All three major distributional channels – ATM machines, bank branches, and transactional Internet banking websites – have increased over time.
In general, however, Internet banking has become widespread in its “click-and-mortar” form. It appears that a substantial majority of banks have at least an informational website and close to a majority now offer transactional Internet sites with virtually all large banks offering them (Furst, Lang, and Nolle 2001, 2002, Sullivan 2001, Berger 2003). Because the basic Internet banking transaction has low variable
costs, there are economies of scale associated with this production process and distribution channel (DeYoung forthcoming). However, this does not preclude community banks from offering this technology, because they can outsource both the development and the maintenance of their Internet sites to website vendors. There is some evidence to indicate that banks, except for the smallest, that have adopted Internet services are more profitable than those that have not. However, this likely reflects the type of banks that have chosen the technology rather than the technology itself given that Internet banking is still a small contributor to overall bank output for most banks (Furst, Lang, and Nolle 2001, 2002, Berger 2003). The evidence also suggests that the performance of Internet-only bank start-ups was inferior to traditional de novo bank start-ups, although the former appear to be improving faster than other banks suggesting that they gain scale and as they ride the learning curve of this technology (DeYoung forthcoming).
Overall, the increased efficiency that results from a shift from paper-based to electronic-payments should reduce the amount of transactions balances required by consumers. The data reflected in Table 1 appear to be consistent with such an effect. Over past two decades consumers have reduced the fraction of their financial assets allocated to transactions accounts, from 7.3 percent in 1983 to 4.6 percent in 2001.
Moreover, the increased efficiency that results from a shift from full service head offices to more specialized delivery channels (branches, ATMs, websites) should reduce the number of inputs that banks require to produce a given amount of banking services. The data displayed in Figures 2, 3, and 4 are consistent with this notion. The number of offices (bank branches plus the head office) per bank has nearly quadrupled since 1970, while assets per office, deposits per office, and transactions per office have steadily increased, and FTEs per office has declined.
In general it appears that larger banks have been quicker to adopt new technology than smaller banks. They have generally been the first, for example, to adopt electronic payments technologies, transactional websites, small business credit scoring (Berger 2003), ATMs (Hannan and McDowell 1984), securitization and off-balance sheet activities (Berger and Udell 1993). In addition to bank size,
however, other factors such market competition and concentration play a role in the adoption of banking technologies (e.g., Hanna and McDowell 1984, Akhavein, Frame and White 2001, Courchane, Nickerson, and Sullivan 2002, Gowrisandaran and Stavins 2002, Hauswald and Marquez forthcoming).24
2.3 A Competitive and Rivalrous World for Community Banks in the 2000s
Where does all this change in the banking industry leave the community bank today? In the 1970s community banks arguably had an advantage in a number of different areas. Much of this advantage stemmed from their local monopoly power. This was particularly true in those states that had some restriction on state-wide branching – which was a majority of the states in the 1970s. For many consumers community banks were the portal to the payments system. They also played an important role as an investment vehicle for consumers. In addition, community banks were a primary source of consumer finance. Finally, community banks were the key provider of services to small businesses. However, the overall role of community banks and the role they play in many of these markets is quite different today for several reasons.
First, due primarily to thousands of mergers involving community banks in the aftermath of industry deregulation, there are simply fewer community banks today. The number of banks in the U.S. with assets less than $1 billion (2001 dollars) has declined from 14,078 banks at the end of 1980 to just 7,631 banks at the end of 2001, and the share of industry assets held by these small banks fell from 33.4 percent to just 16.0 percent. This approximate halving of the presence of community banks in the U.S. banking industry occurred despite the birth of 4,336 de novo banks during the same time period.25
Second, the revolution in payments technology that we discussed above has disadvantaged community banks relative to large banks. The payments system has become much more electronic, diminishing the importance of location. Alternatives to the checking account such as debit cards and credit cards have reduced the need for bank transactions balances that have historically given community banks a funding advantage. However, this does not mean that banks – large and small – will not pursue location for strategic purposes, as we shall discuss below.
Third, all depository institutions – not just community banks – have also become less important as an investment option for consumers. As we just noted, increased efficiency in the payments system has decreased the need for transactions accounts. But, in addition, the proliferation of investment options over the past three decades has diminished the relative attraction of savings accounts and certificates of deposit as consumer investment vehicles. This shift is reflected in Table 1. Ideally we would like to compare consumer financial assets in 1970, the year before the introduction of money market mutual funds, with the situation today. By the end of 1982 when money market mutual funds broke through the $200 billion level, their impact was already enormous. However, as we noted above the SCF was first conducted in 1983, so 1983 is the earliest date available to examine consumer balance sheets. Nevertheless, Table 1 shows quite dramatically how much the role banking has changed in terms of the allocation of consumer assets – even after 1983. The fraction of total financial assets that consumers allocated to depository institutions (lines 1, 3 and 4) dropped from 22.7 percent in 1983 to 10.3 percent in 2001.26
This issue of whether the role of the banking industry has declined has been a visible topic in the literature. Typically the analysis has centered around the fraction of all intermediated assets that are held by depository institutions (e.g., Boyd and Gertler 1994), fraction of total debt (e.g., Berger, Kashyap and Scalise 1995), banking industry employment (e.g., Berger, Kashyap and Scalise 1995) or bank profitability (Gorton and Rosen 1995). The problem with the metrics used in these studies is that they do not focus on specific banking activities where banks are believed to have had an advantage over other financial intermediaries nor are these particularly good measures of the level of bank activity.27 The measure used here in Table 1, allocation of consumer assets to depository institutions is focused on a very specific activity and the metric is based on the users of the service (consumers) rather than the providers (depository institutions). Based on this metric it appears that banks overall have significantly lost part of their franchise value. The impact on community banks was arguably greater than the impact on larger banks because part of community banks’ comparative advantage prior to the repeal of McFadden was the delivery of transactions services.
Fourth, there has been a breathtaking amount of commoditization on the lending side of banking fueled by both technology and government intervention. As we noted above, today the residential mortgage market is a securitized market in which government-sponsored enterprises (GSEs) like Fannie Mae and Freddie Mac are the driving force. The student loan market and substantial chunks of other consumer loan markets have likewise been securitized. Like other financial and nonfinancial commodities (where pricing power is nonexistent), returns to production depend on achieving large scale, and as a result community banks have virtually dropped out of credit card lending and no longer dominate mortgage or auto lending. This is illustrated clearly in Table A-1. In 2001, the typical large bank invested 7.39 percent of its loan portfolios in credit card loans; securitized 19.57 percent of its assets; and earned 4.36 percent of its noninterest income from loan securitizaton fees. In contrast, these figures were all less than 1 percent for the typical community bank.
The commoditization of mortgage, auto, and credit card lending can also be seen on the liability side of the consumer balance sheet. Between 1983 and 1997, debt owed to depository institutions fell from 59.8 percent to 45.7 percent of total consumer debt, while debt owed to mortgage and real estate lenders – whose business model is based entirely on securitization – increased from 11.6 percent to 38.0 percent of total consumer debt (see Table 2). It should be noted that much of the debt extended by mortgage and real estate lenders winds up back on bank balance sheets. This will occur when a mortgage lender sells a mortgage to a securitized pool and the bank purchases the securitized mortgage. Nevertheless, even if 100 percent of this paper ended up as bank investments, this would still reflect a significant loss to most banking franchises, because mortgage lenders would have captured a substantial amount of the loan origination business from depository institutions. Moreover, the existence of a secondary market where mortgage lenders can sell their originations has likely sapped much of the pricing power out of the residential mortgage market. Of course it has also enormously benefited consumers by transforming illiquid residential mortgages into highly liked traded securities.28
Fifth, as a direct result of deregulation and new technologies in lending, payments, and financial markets, both large banks and community banks now face much more competitive pressure. The
Gramm-Leach-Bliley Act eliminated the barriers that had protected commercial banks, investment banks, brokerage houses, and insurance companies from competition with each other, and the Riegle-Neal Act exposed both large and community banks to entry from outside their local markets. The combined effect of the latter of these two federal laws and earlier interstate compacts has been a near 50 percent reduction in the number of commercial banks in the U.S. since 1980, and an increase in market share of the ten largest bank holding companies from 28 percent of U.S. banking assets in 1986 to 76 percent of U.S. banking assets in 2001.29 Increased geographic competition has upsides for society – for instance, entry by large banks into previously protected local banking markets creates pressure for local banks to operate more efficiently (see DeYoung, Hasan, and Kirchhoff 1998; Evanoff and Ors 2001; and Whalen 2001) – but has obvious downsides for marginally profitable banks that cannot respond to the competitive challenge. Advances in information technology have made financial markets deeper and broader, making direct finance (equities, high-yield bonds, commercial paper) more accessible for entire classes of business borrowers that used to be captive customers of the commercial banking sector. Similarly, advances in electronic payments are reducing the value of the banking franchise as nonbanks (e.g., credit card networks) play an increasingly important role in the payments system. Finally, credit scoring and securitization have transformed the consumer loan production process from a relatively noncompetitive relationship business to a highly competitive, commoditized transactions business.
2.4 A Continuing Comparative Advantage for Community Banks
There is at least one area of banking that appears to have been relatively unaffected by technology and deregulation – relationship lending to small business. There are a number of reasons why this line of business may be relatively unassailable by competition from large banks wielding the latest in new information and financial technologies. In relationship lending information is gathered by lenders beyond the relatively transparent data available from financial statements, observation of collateral, and other public sources. This information is acquired over time by lenders through the breadth and depth of the
banking relationship and is used in renewing loans, extending additional credit, renegotiation, and setting loan terms.30
In the relationship lending segment of the market it is not obvious that technology has had an economically significant impact on the way loans are underwritten and monitored. Some might argue that computers and communications technology have fundamentally changed the nature of loan underwriting.31 The reality, however, may be quite different. For relationship loans in the $250,000 to $15,000,000 range to informationally opaque business borrowers, the fundamental importance of the borrower-loan officer relationship has not likely changed that much in past three decades.32 Loan officers still emphasize the critical importance of personal contact with borrowers and other dimensions of “soft information”.33
Even with respect to the component of underwriting that is based on “hard information,” the financial tools to assess credit quality are not much different today than they were in the 1970s. Leverage ratios, coverage ratios, turnover ratios, and profitability ratios are the same today as they were in 1970s. Computer spread sheet software makes it a little easier to calculate these ratios, but a good credit analyst in the mid-seventies could spread a set of financial statements relatively quickly (i.e., minutes not hours), so the economic impact here is likely minimal. As we noted above, information generated by third party information exchanges (e.g., Dun and Bradstreet), may be somewhat better. However, on any company borrowing above $250,000, mercantile credit information in the 1970s was generally available, widely used by commercial lenders, and generally considered by lenders to be quite informative. In addition, credit scoring which uses trade credit exchange information as an input is not the primary lending criteria on loans of this size. The delivery of credit reports is much faster today as we have noted. However, this is much less important for loans above $250,000 where credit approval is rarely made overnight given the emphasis on personal contact by the loan officer. And finally, the process of negotiation and the contracting tools available today (collateral, maturity, covenants, guarantees, subordination etc) are identical to the tools available in the 1970s.
Not all small business loans are primarily relationship-based. For example, about 50 percent of all small business loans are held by large banks (Strahan and Weston, 1998), but many of these loans are the credit-scored micro-business loans that we discussed earlier. Also, the asset-based lending and factoring that we discussed earlier are not relationship-based.34 Finally, some small business lending involves extending credit primarily based of the strength of the financial statements. These would be businesses whose financial statements are stronger and more informative, and possibly larger and older.35 Micro-business lending, asset-based lending (including factoring), and financial statement lending are all primarily based on “hard information” as described above. For these loans “soft information” is subordinate in importance. Soft information would include qualitative information about the character of the entrepreneur and the strength of the company culled from the interaction of loan officer with the entrepreneur, the entrepreneur’s suppliers, the entrepreneur’s customers, community activities, etc. However, for relationship loans soft information is of primary importance and hard information is less important in great part because there is less of it for these loans.
Some recent theoretical work finds that community banks may have an advantage in processing soft information and extending relationship loans. The basic argument here is that there are organizational diseconomies that make it problematic for larger institutions to process and communicate this information (Stein 2002). Empirical evidence seems to support this view including research that suggests that the contract terms of business lending at large banks are different than at small banks (Berger and Udell 1996), that small banks are more likely to base loans on soft information and the strength of the relationship (Cole, Goldberg and White forthcoming, Berger, Miller, Petersen, Rajan and Stein 2002, Scott 2004), and that large banks tend to lend at a longer distance where hard information more likely trumps soft information (Berger, Miller, Petersen, Rajan and Stein 2002).36 Also, there is compelling evidence that small business lending in general (possibly excluding credit-scored micro-business lending) is not likely to become commoditized like residential mortgage lending and consumer lending. Specifically, despite the explosion of securitization in other markets, there has not been an economically meaningful level of securitization in the small business loan market (Acs 1999). In part,
this may be due to the high frequency of renegotiation and the intensity of monitoring associated with small business lending that could be problematic in a securitization environment.37,38
3. A Strategic Analysis of Community Bank Performance and Viability
In this section we model the impacts that deregulation, technological change, and increased competition have had on the viability of community banks. We adapt a strategic-map framework from DeYoung (2000) and DeYoung and Hunter (2003), and we test the theoretical framework against financial and structural data for U.S. commercial banks from the mid-1970s through 2001. We find considerable empirical evidence consistent with the theoretical framework. The results of our analysis indicate that while deregulation and technological change created sobering competitive threats for community banks, the manner in which large banks have responded to these changes has left well-run community banks with long-run strategic opportunities.
3.1 A strategic map of the banking industry
In Section 2 we described a myriad of ways that deregulation and technological change have changed the competitive environment for community banks. At the risk of over-simplification, we will describe the strategic impact of these phenomena using just three basic parameters: bank size, bank unit costs, and product differentiation. Following DeYoung (2000) and DeYoung and Hunter (2003), we use these three parameters to construct the strategic maps displayed in Figures 5 through 8.
The vertical dimension in these maps measures bank size, with large banks at the bottom and small banks at the top. Because the production of banking services tends to exhibit scale economies, the vertical dimension also measures unit costs, with low unit costs at the bottom and high unit costs at the top. The earliest banking scale economy studies concluded that scale economies were fully exhausted by relatively small banks; most of these studies estimated minimum efficient scale for banks to be less than $1 billion of assets (2001 dollars). More recent studies have yielded somewhat different insights; many of these studies conclude that scale economies are available for large regional and super-regional banks.39
Part of this difference between these two sets of studies is due to the inferior (though state-of-the-art at that time) methodologies used by the earlier studies, and part of the difference is due to the fact that new information and financial technology changed bank production processes over time.
Regardless, an important point of agreement among most of these studies is that small banks using a traditional banking model (i.e., intermediating transactions deposits into loans held-on-portfolio) can gain substantial reductions in their unit costs without fully exploiting all available scale economies. Of course, as banks continue to grow larger, they will gain access to additional reductions in unit costs, albeit at a declining rate. But the degree to which a bank can reduce its unit costs via additional growth depends not just on its current size, but can also depend on the type of products it produces. Rossi (1998) shows that unit cost reductions at financial institutions doing less traditional banking (e.g., high volume origination and securitization of mortgage loans or credit card loans) continue to be substantial even at very large scale; this precludes community banks from profitably pursuing specialized strategies in financial commodities.
The horizontal dimension in these maps measures the degree to which banks differentiate their products and services from those of their closest competitors. Banks that offer differentiated products and services (e.g., customized loan contracts, personalized private banking) are located on the right, and banks that offer nondifferentiated products and services (e.g., standardized mortgage loans, discount online brokerage) are located on the left. Note that not all product differentiation is tangible – it can often be a perception in the mind of the customer. For example, community banks attempt to differentiate themselves by knowing the names of their customers upon sight, large banks attempt to differentiate themselves using marketing campaigns to create brand images for otherwise undifferentiated products, and if successfully deployed both of these strategies can support higher prices for retail banking services.40
The horizontal dimension of standardization versus customization is also consistent with the distinction between hard and soft information discussed above (Stein 2002; Berger, Miller, Petersen, Rajan, and Stein 2002, Scott 2004). This spectrum runs from hard information on the left where banks
use automated transaction lending technologies to originate and securitize standardized mortgage or credit card loans and to deliver credit scored micro-business loans. Moving to the right banks emphasize more traditional lending technologies such as asset-based lending and financial statement lending. Finally, at the far right banks specialize in relationship lending where loan officers acquire soft information about the borrower over time, through a variety of products and services, and through interaction with the local community.
In this framework, banks select their business strategies by combining a high or low level of unit costs with a high or low degree of product differentiation. The positions of the circles indicate the business strategies selected by banks, and the relative size of the circles indicate the relative sizes of the banks. Figure 5 illustrates the commercial banking industry prior to the deregulation and technological advances we discussed above in Section 2. All banks were clustered near the northeast corner of the strategy space. Geographic regulation restricted the size of banks and prevented most (and perhaps all) of them from fully exploiting available scale economies. The available technology for producing and delivering banking services required interpersonal contact between loan officers and borrowers to collect soft information; paper-based transactions for payments; and visits to the bank to receive cash and deposit checks – all of which required brick-and-mortar bank and branch locations staffed by bank employees. The level of price competition on the deposit side was restricted on one hand by Regulation Q, and on the other hand by the lack of substitute liquidity and transactions providers. Retail competition, to the extent that it existed, was non-price competition – person-to-person service, the convenience of having a branch nearby, and of course free toasters for opening accounts – rather than price competition. And banks faced relatively little competition from nonbanks or securities markets for supplying credit to businesses.
The characteristics of retail, small business, and (to a large extent) large business banking varied little across different sized banks. Small banks tended to offer a somewhat higher degree of person-to-person interaction with retail customers, and large commercial accounts by necessity went to large banks, but small banks and large banks had more commonalties than differences with each other. For the most
part, there was a single retail banking strategy – with some variants – and very little strategic difference among most banks’ approaches to commercial lending.
But deregulation and technological advances created new strategic opportunities for banks, and as competition heated up banks had incentives to pursue those opportunities. As discussed above, the average size of commercial banks began to increase – at first due to modest within-market mergers, and then more rapidly due to market extension megamergers – and the disparity in bank size within the industry also increased.41 Although increased size yielded scale economies for small, medium, and large banks, the largest banks gained access to the lowest unit cost structures.
Large banks also became less like community banks because the size of their operations allowed them to more efficiently apply the new production technologies discussed above (e.g., automated underwriting, securitization, widespread ATM networks, electronic payments). This had two effects. First, it reduced their unit costs even further. Second, it changed their retail banking strategy to a high-volume, low-cost, “financial commodity” strategy. Home mortgages, credit cards, and online brokerage are three examples of financial services that have become dominated by large and very large financial institutions, which use hard information and automated production and distribution processes to deliver these services at low unit costs. Because price competition is strong for nondifferentiated products, pricing pressure keeps margins low, despite these banks low unit costs. High volumes, constant vigilance to keep expenses in line, and continuous innovation are essential for this strategy to earn satisfactory returns for shareholders.
Thus, the incentives created by technology and deregulation drove a strategic wedge between the large and growing banks on one hand and the smaller community banks on the other hand. The result is shown in Figure 6. Large banks have moved in a southwest direction on the map, sacrificing personalized service for large scale, and gaining low unit costs by shifting to automated production techniques. Although many community banks have also grown larger via mergers, they have continued to occupy the same strategic ground. By virtue of their small size, local economic focus, and person-to-person ethos, community banks are well suited to gathering the soft information necessary to deliver highly
differentiated small business credit products and high-end consumer banking services.42 If well-managed, this more traditional strategy should allow community banks to charge high enough prices to earn satisfactory rates of return, despite their higher cost structures. In this view of the banking industry, community banks are differentiated from large banks by their “high value-added” strategy.
Before moving on, we must make three additional points before our strategic analysis is complete. First, the four corners of the strategy space represent the only potentially viable strategic choices for banks; being “stuck in the middle” of such a map indicates the lack of a strategy, and leads to financial disaster (Porter 1980). Second, the Northwest corner of the strategy space (high cost, low value-added) is not a viable strategy, for obvious reasons. And finally, although the Southeast corner of the strategy space (low cost, high value-added) is the most preferred location, it is unlikely to be a viable long-run strategy. Without some kind of entry barrier (e.g., patents, monopoly rights), the excess profits generated at this location will invite entry and the resulting competition will compress margins back to a normal rate of return. However, the mere existence of this strategic ground, and the excess profits that banks can earn in the short-run or moderate-run by occupying it, creates an incentive for both large and small banks to innovate. Moreover, banks that do not strive via innovation to reach this strategic ground are likely to leave the industry in the long-run.
3.2 Testing the framework against the data
To be sure, Figures 5 and 6 oversimplify the broad changes in the banking industry over the past three decades and the effects these changes have had on banking strategies. For example, some large banks offer customized services to certain sets of clients with idiosyncratic financial needs, such as corporate investment banking clients and high net worth “private banking” customers. Furthermore, some small Internet-only banks specialize in providing extremely standardized retail banking services.43 But the simplifications in this framework allow us to isolate the main characteristics of community banks and large banks – small size, local focus, and more traditional banking technology versus large size, broad appeal, and highly automated banking technology – and in turn to realize that community bank strategies
and large bank strategies rely on different profit drivers. If this framework is indeed representative of the market structure and firm behaviors found in the U.S. banking industry, then addressing the following question will go a long way to determining the future facing community banks: Is a customized, high-value-added approach to retail and small business banking financially competitive with a standardized, commodity-based approach?
Addressing this question requires us to first expose our simple strategic framework to careful empirical scrutiny. First, are the assumptions embedded in this framework consistent with the data? Relative to community banks, do large banks have lower unit costs, lower interest margins, use “harder” information, and sell financial services that are more standardized? Second, are the dynamics of the framework supported by the data? Have large banks and community banks grown less alike over time in terms of size, production methods, output mix, and financial structure? Only after addressing these first two questions in the affirmative can we address the third set of questions to which the framework naturally leads us: Is the situation illustrated in Figure 6 an industry equilibrium? Or will further changes be necessary before the industry is in equilibrium? And will that new equilibrium include community banks as we currently know them?
Question 1: In what ways do community banks and large banks differ today? We refer to the data in Appendix Table A-1 to examine whether recent differences between community banks and large banks are consistent with the industry equilibrium depicted in Figure 6.44 The table displays mean values for a variety of financial ratios and strategy variables for U.S. banks at year-end 2001. The banks are separated into six peer group categories: large banks, mid-sized banks, large community banks, medium community banks, and rural banks. Unless otherwise indicated, we use these same category definitions throughout the remainder of this study.
To be included in the analysis banks had to meet the following criteria: they held a state or federal commercial bank charter; they were located in one of the fifty states or the District of Columbia; they were at least ten full years old (DeYoung and Hasan 1998); and they had reasonably traditional bank
balance sheets that included loans, transactions deposits, and insured deposits. Urban banks (i.e., banks located in MSAs) are organized into five asset size categories: small community banks with assets less than $100 million; medium community banks with assets between $100 and $500 million; large community banks with assets between $500 million and $1 billion; mid-sized banks with assets between $1 and $10 billion; and large banks with more than $10 billion in assets. Rural banks are included as a separate category because of their special role in providing agricultural credit and because they tend to face less competition in the rural towns in which they are located; however, rural banks use a business model very similar to community banks, and for most purposes can be considered to be community banks. Banks in the rural bank category and the three community bank categories had to meet the following additional conditions: they were domestically owned; credit card receivables comprised no more than ten percent of their loan portfolios; they derived at least half of their deposits from branches located in a single county; and they were organized as either an independent bank, the sole bank in a one-bank holding company, or an affiliate in a multione-bank holding company comprised solely of other community banks.
Note that these six peer group categories do not collectively contain the full population of U.S. commercial banks in any given year. For example, at year-end 2001 the FDIC reported that there were 8,080 commercial banks operating in the U.S., while our sample selection process and peer group definitions exclude 1,416 of these banks, leaving us with a sample of 6,664 banks for 2001. Also note that our analysis of bank strategies and financial performance is based on bank-level data (largely from the Call Reports) rather than bank holding company-level data. We choose to compare the performance of community banks – most of which are not affiliated with multibank holding companies – to the performance of other community and non-community banks at the same level of organization.
Obviously, community banks by definition are smaller than “large” banks. But the magnitude of the size disparity displayed in Table A-1 is staggering: the average $60 billion large bank is on the order of 100 times larger than the average large community bank; 300 times larger than the average medium community bank; and 1200 times larger than the average small community bank. These huge size