NBER WORKING PAPER SERIES
IS THE FORECLOSURE CRISIS MAKING US SICK? Janet Currie
Erdal Tekin Working Paper 17310
http://www.nber.org/papers/w17310
NATIONAL BUREAU OF ECONOMIC RESEARCH 1050 Massachusetts Avenue
Cambridge, MA 02138 August 2011
We would like to Peter Muennig, Yongheng Deng, Haruko Noguuchi and the seminar participants at George Mason University and the 22nd Annual East Asian Seminar on Economics for helpful comments, and Tyler White of RealtyTrac for helping us to access the data. We also thank Chandler McClellan and Jessica Van Parys for excellent research assistance. This research was supported by a grant from the MacArthur Foundation. The authors are solely responsible for any views expressed. Neither author has any material financial relationships or conflicts of interest to disclose. The views expressed herein are those of the authors and do not necessarily reflect the views of the National Bureau of Economic Research.
NBER working papers are circulated for discussion and comment purposes. They have not been peer-reviewed or been subject to the review by the NBER Board of Directors that accompanies official NBER publications.
© 2011 by Janet Currie and Erdal Tekin. All rights reserved. Short sections of text, not to exceed two paragraphs, may be quoted without explicit permission provided that full credit, including © notice, is given to the source.
Is the Foreclosure Crisis Making Us Sick? Janet Currie and Erdal Tekin
NBER Working Paper No. 17310 August 2011, Revised March 2012 JEL No. I12
ABSTRACT
We investigate the relationship between foreclosure activity and the health of residents using zip code level longitudinal data. We focus on Arizona, California, Florida, and New Jersey, four states that have been among the hardest hit by the foreclosure crisis. We combine foreclosure data for 2005 to 2009 from RealtyTrac with data on emergency room visits and hospital discharges. Our zip code level quarterly data allow us to control for many potential confounding factors through the inclusion of fixed effects for each zip code as well as for each combination of county, quarter, and year. We find that an increase in the number of foreclosures is associated with increases in medical visits for mental health (anxiety and suicide attempts), for preventable conditions (such as hypertension), and for a broad array of physical complaints that are plausibly stress-related. They are not related to visits for cancer morbidity, which arguably should not respond as rapidly to stress. Foreclosures also have a zero or negative effect on elective procedures, as one might expect. Age specific results suggest that the foreclosure crisis is having its most harmful effects on individuals 20 to 49. We also find that larger effects for African-Americans and Hispanics than for whites, consistent with the perception that minorities have been particularly hard hit. Janet Currie Princeton University 316 Wallace Hall Princeton, NJ 08544 and NBER jcurrie@princeton.edu Erdal Tekin Department of Economics
Andrew Young School of Policy Studies Georgia State University
P.O. Box 3992
Atlanta, GA 30302-3992 and NBER
3 I. Introduction
The expansion of mortgage credit over the last decade was followed by a sharp decline in housing prices, which has caused foreclosure rates to reach historically high levels in the United States. According to Realtytrac, a leading firm that monitors and markets foreclosed homes, a record 2.82 million homes faced foreclosure in 2009, a 21 percent rise from 2008 and a huge 120 percent jump from 2007.1 One in 45 homes (2.23 percent of all housing units in the U.S.) received at least one foreclosure filing during 2010. As policymakers have debated measures to stabilize the housing market and minimize the damage to the U.S. economy, researchers have turned their attention to understanding the consequences of rising foreclosures.
While a number of studies have investigated the effect of the foreclosure crisis on outcomes such as home prices and sales, residential investment, and durable consumption (e.g., Immergluck and Smith, 2006; Calomiris, Longhofer, and Miles, 2008; Rogers and Winter, 2009; Harding, Rosenblatt, and Yao, 2009; Mian, Sufi, and Trebbi, 2010), there has been no large-scale investigation of the effect of the crisis on health. The foreclosure crisis represents a large shock to the financial well-being of many households, reaching beyond those that actually suffered foreclosure through its effects on housing values, and thus provides a fresh opportunity to examine the relationship between financial distress and health.
Foreclosures might be expected to influence health through several channels First, for the individuals directly involved, a home foreclosure is often an intensely stressful life event.
Second, a high rate of foreclosure in a neighborhood may have negative impacts on those who do not lose their homes as homeowners see the value of their properties fall (Lin, Rosenblatt, and Yao, 2009; Immergluck and Smith, 2006; Mian, Sufi, and Trebbi, 2011). Third, financial
1
4
problems and stress may cause changes in health behaviors, which in turn may have negative health consequences. For example, people may smoke or drink more, stop taking medications because they cannot afford them, or stop going to the doctor for preventive care.
The goal of this paper is to investigate whether the foreclosure crisis is having an adverse effect on health. In order to investigate these health effects, we assemble quarterly data on all foreclosures, Emergency Room (ER) visits, and hospitalizations from four states (Arizona, California, Florida, and New Jersey) which are among the 10 states that have been hardest hit by the crisis. Data on foreclosure activity is linked to data on ER visits and hospital discharges at the zip code level. We control for zip code fixed effects so that our effects are identified by changes within zip codes (rather than comparisons of, for example, rich and poor
neighborhoods). We also control for interactions of county, quarter, and year in order to account for time-varying features of local labor markets such as unemployment rates. Hence, we take advantage of the fact that some zip codes were much more heavily impacted than others even within a county. We focus on conditions that are likely to be impacted by stress (such as heart attack and stroke) and examine cancer as a “control” condition that takes many years to develop and is less likely to be impacted by stress in the shorter term.
We find considerable evidence of an increase in non-elective (i.e. urgent and unscheduled) hospital and ER visits for stress-related conditions but not for cancer. Foreclosure is associated with significant increases in suicide attempts, heart attacks, and stroke, diagnoses that are not usually treated in an outpatient setting, suggesting that the increase cannot be explained by people switching providers. Foreclosure is also associated with increases in urgent, unscheduled visits for conditions such as gastro-intestinal problems, and heart problems such as chest pain and dysrhythmias. These effects are particularly pronounced for Hispanics, though we find the largest estimated effects on heart
5
attack and stroke among blacks. We also find large increases in hospitalizations for conditions that are “Prevention Quality Indicators,” (PQIs) i.e. conditions which should not result in hospital or ER visits if patients receive proper preventive care. For example, an increase of 100 foreclosures, which is approximately the increase experienced in the average zip code in our sample, raises admissions for preventable hospitalizations by 6.3 percent among 50-64 year olds. These results suggest that some of the increase in visits is caused by people cutting back on preventive care. The effects of foreclosure are generally smaller for those who are insured, suggesting that cut backs in medical care may be an important pathway for the health effects of foreclosure.
An increase in visits in zip codes that experience a run up in foreclosures does not necessarily indicate that people are becoming sicker because of the foreclosure crisis. Therefore, we consider and reject a number of other possible explanations for this relationship.
Specifically, we show that the estimated effects cannot be completely accounted for by
increasing unemployment; we find similar effects over the 2005-2007 period, before the run up in unemployment, and in county-level models in which we control for the unemployment rate. Nor, as discussed above, can the results be explained by people switching from out-patient to hospital providers. Since people who have suffered foreclosure are likely to leave their old neighborhoods, we believe that the increases in visits primarily reflect the effects of financial and psychological distress precipitated by the foreclosure crisis on those who remain.
The rest of the paper is laid out as follows. In Section II, we provide some background information about the foreclosure crisis, and previous work on the relationship between economic activity and health. We then discuss our data in Section III and methods in Section IV, followed by the results in Section V, and a brief conclusion in Section VI.
6 II. Background
There have been several explanations offered for the foreclosure crisis including a
relaxation in underwriting standards and the expansion of mortgage credit to subprime borrowers (e.g., U.S. Department of Housing and Urban Development, 2009; Dell’Ariccia, Igan, and Laeven, 2008; Demyanyk and Van Hemert, 2011), mortgage securitization having an adverse effect on the screening practices of lenders (e.g., Keys et al., 2010), widespread negative equity caused by the willingness of mortgage lenders to issue mortgage-debt on homes in which the owners had little or no equity (e.g., Gerardi, Ross, and Willen, 2009, 2011), and a rapid increase in interest rates after a period of historically low levels that fueled a housing bubble (e.g., Mayer and Hubbard, 2008).Whatever the root causes might be, delinquencies and foreclosures soared starting in late 2006, and housing prices plummeted (Campbell, Giglio, and Pathak, 2009; Calomiris, Longhofer, and Miles, 2008, Harding, Rosenblatt, and Yao, 2009, Lin, Rosenblatt, and Yao, 2009;
Immergluck and Smith, 2006). The turmoil in the housing market spread to capital markets and generated the current continuing economic malaise (e.g., Green, 1997; Leamer, 2007; Gauger and Snyder, 2003).
a) How Could Foreclosures Affect Health?
The implications of the crisis for non-economic domains such as health have been largely ignored.2 Yet there are good reasons to expect the foreclosure crisis to impact health. First, foreclosure represents a potentially extremely stressful experience as well as the culmination of a stressful process for the affected homeowner. Stress is hypothesized to affect health both by depressing the immune system and making a person more susceptible to infection, and through
2
Bennett, Scharoun-Lee, and Tucker-Seeley (2009) point to the urgent need for credible research investigating the health effects of foreclosures.
7
the direct action of “stress hormones” on factors such as blood pressure and cardiovascular health (McEwen, 1998a, 1998b). A growing literature suggests that stress can have harmful consequences through psychological responses such as depression or higher levels of hormones such as cortisol, and that stressful life experiences are associated with both physical and mental illnesses (Goldberger and Breznitz, 1993; McEwen, 1998a, 1998b; Cooper, 2005; Schneiderman, Ironson, and Siegel, 2005). Hence, it is not unreasonable to suppose that the stress associated with foreclosure might have negative effects on human health.
However, the available data are not well suited to examining the effects of experiencing foreclosure on an individual’s health. Those who lose their homes to foreclosure are likely to move at some point during the process, and there is no available data that would allow
researchers to track large number of these individuals to their new locations and assess their health before and after foreclosure. What we can do is to use the available data to examine the effects of high levels of foreclosure activity on those who remain in a neighborhood, whether or not they personally experienced foreclosure.
High levels of foreclosure in a neighborhood may affect health because housing is the major source of wealth for most people. Therefore, declines in housing prices represent a significant negative shock to wealth, not just for those who suffer foreclosure, but also for their neighbors.3 Mian, Sufi and Trebbi (2011) conclude that a one standard deviation increase in foreclosures in a zip code results in a growth rate in housing prices that is two-thirds of a standard deviation lower.
Bajari, Chu, and Park (2008) consider two broad categories of defaults. Defaults in the
3
Similarly, there is a positive association between health and home ownership, presumably because home owners are wealthier than renters on average (Dietz and Haurin, 2003; Pollack, Knesebeck, and Siegrist, 2004).
8
first category include homeowners who rationally decide to “walk away” from a mortgage when it is no longer in their interest to pay for it. For example, a buyer with a negligible down
payment might be substantially better off walking away from a mortgage in response to falling housing prices. The second category includes borrowers who lose their homes due to short-term liquidity constraints. These borrowers might have been particularly adversely affected by the credit freeze and by interest rate “resets” that suddenly increased their monthly payments. Bajari et al. conclude that short-term credit constraints at least as important as the decline in housing prices in explaining the increase in defaults. For every household who lost a home, there were likely to be many more who were struggling with these credit constraints.
Several studies have linked economic crisis to reductions in the utilization of medical care (e.g., Lusardi, Schneider, and Tufano, 2010; Williams and Collins, 1995; Feinstein, 1993). As we will see below, foreclosures are linked to increases in preventable hospitalizations and ER room visits suggesting that people are constrained in terms of their medical expenditures. It is also possible that people smoke or drink more (though they could also reduce consumption in response to financial constraints), consume a lower quality diet, or get less exercise when they are financially strapped.
It is of course possible for health problems to cause foreclosure in individual cases.4 For example, Warren et al. (2007) argue that many bankruptcies are caused by ill health. Pollack and Lynch (2009) compare individuals who voluntarily enrolled in mortgage counseling in Philadelphia with respondents of a community health survey in Pennsylvania between July and October 2008. The foreclosure sample was significantly more likely to have hypertension, heart disease, or psychiatric disorders than the community sample. However, in their sample foreclosure may
4
9
indeed be caused by poor health rather than vice-versa since over a quarter of their foreclosure group owed money to medical creditors. Moreover, Philadelphia has not been particularly hard hit by foreclosure, ranking 77th among metropolitan areas in terms of foreclosures in 2008, suggesting that their sample of mortgage counselees might have been negatively selected relatively to those suffering foreclosure in areas that have been more strongly impacted.
In contrast, the foreclosure crisis examined here represents a sudden and sharp shock to wealth that is unlikely to have been caused by a sudden epidemic of ill health among the U.S. population. Moreover, while in hindsight many commentators have said that a crash was inevitable, the timing and severity of it were certainly a surprise to almost all observers (Mian and Sufi, 2010; Calomiris, Longhofer, and Miles, 2008; Demyanyk and Van Hemert, 2011). In fact, it is this feature of the foreclosure crisis that presents a unique opportunity to explore the consequences of foreclosure on health. There is no reason to suppose that the spike in
foreclosures was caused by the health problems of individual homeowners, and the overall relationship between the increase in foreclosures and increased health problems is likely to represent a relationship running from foreclosure to health rather than vice versa.
b) Effects of Unemployment on Health
While the health effects of foreclosure have been ignored, there is an extensive and related literature examining the effects of unemployment and job loss on health. Ruhm (2000, 2003, 2006), Ruhm and Black (2002), Neumayer (2004), and Gerdtham and Ruhm (2006) find that higher unemployment is associated with lower mortality rates, while Dehejia and Lleras-Muney (2004) find that higher unemployment improves infant health. These patterns have been attributed to recession-induced changes in health behaviors, though the evidence on this channel is mixed.
10
For example, Xu and Kaestner (2010) study a group of low income individuals and find that higher employment is associated with more cigarette smoking and fewer visits to doctors for preventive care. However, Deb et al. (2011) examine a sample of older workers and find that some of them experience increases in body mass index and alcohol consumption in response to job loss. Miller et al. (2009) argue that the cyclical changes in mortality are concentrated in the young and the old and so are unlikely to represent changes in health behaviors among working age adults.
Sullivan and Wachter (2009) follow a large sample of individuals who lost their jobs in mass layoffs. They find significantly higher death rates due to accidents and heart conditions in this group, both immediately and in the longer term. Eliason and Storrie (2009a) examine data from plant closings in Sweden in 1987 and 1988 and find that mortality rises by 44 percent in the four years following job loss. In particular, they find a two-fold increase in suicide. Eliason and Storrie (2009b) also find increases in hospitalizations due to self harm, accidents, and alcohol-related causes in the 12 years following displacement. However, Browning et al. (2006)
examine the effects of job loss in a 10 percent sample of the population of Denmark and find no effect on hospitalizations for circulatory or digestive ailments.
While foreclosure and unemployment may both be viewed as negative economic shocks, they differ in key respects: Foreclosure does not entail increases in leisure, and unemployment does not generally have spillovers in terms of other peoples’ wealth (though a mass layoff might). Still, the literature on unemployment and health is relevant for two reasons. First, while it is somewhat inconclusive, on the whole it suggests that economic shocks can have health effects. Second, the foreclosure crisis has been followed by the worst recession since the Great Depression. Hence, it is reasonable to wonder whether the health effects that we find are due to unemployment rather than
11
foreclosure. Figure 1 shows that the rise in foreclosures preceded the increase in unemployment in our study states, and one way we will try to distinguish between the effects of unemployment and the effects of foreclosure is by conducting sub-analyses on the period 2005-2007 when unemployment was constant or falling and foreclosures were rising. We also show that county-level models that control for
unemployment directly produce very similar estimates of the effects of foreclosure.
c) Potential Differences in Effects by Race, Ethnicity and Age
Minority groups are thought to have been particularly hit hard by the foreclosure crisis (Rugh and Massey, 2010) in part because lending agencies targeted low-income minority neighborhoods for risky loans (Avery, Brevoort, and Canner, 2007; Bocian, Ernst, and Li, 2008; Calem, Gillen, and Wachter, 2004; Mayer and Pence, 2008; Squires, 2008). These groups may also have had a more difficult time with the crisis given lower savings, poorer labor market prospects, lower rates of private health insurance coverage, and poorer baseline health than other groups. Bowdler, Quercia, and Smith (2010) argue that Latinos have been particularly strongly affected, which is provocative in light of the strong health effects we find for Hispanics.
The effects of foreclosures on health might also be expected to vary by age. While overall levels of financial literacy are poor (e.g., Lusardi and Tufano, 2009), financial decision making usually improves with age (e.g. Agarwal et al., 2007) and older people are less likely to borrow on the equity in their homes (e.g., Duca and Kumar, 2010). But there is also some evidence that senior citizens were disproportionately targeted by lenders for predatory lending purposes (Government Accountability Office, 2004; Delgadillo, Erickson, and Piercy, 2008; Collins, 2009). Cunningham and Capone (1990) and Anderson and VanderHoff (1999) find that foreclosure rates decrease with age, but these studies are based on data at least 20 years of age.
12
Ludy and Herlitz (2009) note that the largest increases in homeownership from 1995 to 2004 were among those aged between 20 and 44. Perhaps the most useful study is by Shelton (2008) who analyzed a random sample of 2.5 million persons from Experian, the credit rating agency. She finds that three quarters of foreclosures in the second half of 2007 were among homeowners aged less than 50. These figures suggest that the effects of foreclosure may be stronger among younger individuals, and perhaps among children since most parents are in this age range. Below we provide additional insight into these patterns using nationally representative data from the Panel Study of Income Dynamics.
d) Summary
The previous literature has largely ignored the possible relationship between the
foreclosure crisis and population health, though it does suggest that such a relationship could exist. Ours is the first comprehensive effort to consider this potential relationship. As such, the
findings from this paper constitute an important baseline for future research by providing
estimates of the impact of foreclosures on a range of important health problems. Our paper also makes a contribution to the broader literature on the relationship between wealth and health. By focusing on the foreclosure crisis, we limit the potential bias due to reverse causality that plagues most studies of this relationship.
III. Data
a) Data from the Panel Study of Income Dynamics
While our main focus is on the relationship between foreclosure and visits to hospitals and emergency rooms in four large states, it is helpful to motivate our study by examining
13
nationally representative data on the characteristics of those suffering foreclosure and on the relationship between foreclosure and health from the Panel Survey of Income Dynamics (PSID).5
The PSID administered a supplement on Housing Distress and Mortgages in 2009 which included questions about the family's foreclosure history over the past decade. First, the
household is asked whether they are currently in foreclosure on a first or second mortgage. If the answer to this question is yes, the month and year the foreclosure was initiated are determined. In addition, respondents are asked whether they ever lived in a home since 2001 in which a foreclosure was started, and if so, the month and year when the foreclosure started. From these four questions, we build a foreclosure history for each household.6 The PSID asks both general health questions and questions regarding specific conditions. The most general question asks the respondent to rate his or her health on a 5 point scale from Excellent to Poor. In addition,
respondents are asked if a doctor has ever told them that they have a number of different specific health conditions. Other pertinent health behavior questions include whether the household members smoke or drink. The PSID had 8,682 respondents in 2009, with 327 reporting a foreclosure start since 2001.
Table 1 provides an overview and an interesting starting point for our analysis. The first two columns divide the sample into those who ever experienced foreclosure (since 2001) and all
5
The PSID is a biannual survey of American households conducted by the University of Michigan's Institute for Social Research since the 1968. It began with a sample of over 18,000 individuals living in about 5,000 families in the United States. Detailed information on the participants and their descendants has been collected on a wide range of domains including employment, income, and health. The survey was administered annually until 1997 and bi-annually since.
6
Specifically, the four questions are: “Has your bank or lender started the process of foreclosing on your home?--First/Second Mortgage”. “In what month and year did the foreclosure start? --First/Second Mortgage”. “During the last 8 years, that is, since 2001, have you, or anyone in your family living there ever owned a home on which a foreclosure was started?” and “In what month and year did the foreclosure start?”
14
others. The questions pertain to the household head. Clearly, those who have suffered
foreclosure are generally younger, with relatively few elderly people in that group. Whites are under-represented in the ever foreclosure group, while blacks and Hispanics are
over-represented. Those who have been foreclosed are somewhat less likely to be married, but more likely to have children under 18 in the household. They are less likely than others to report excellent health, but only slightly more likely to report that their health is poor. They are much more likely to smoke, but somewhat less likely to drink than others.
Turning to their health in 2009, since those who have been foreclosed are generally younger, it is perhaps unsurprising that they are less likely to have many types of chronic conditions than others. Striking exceptions are that they are more likely to have had a heart attack, more likely to have diabetes, and more likely to have psychological problems.
The next four columns of the table look at foreclosure status in 2009. A few points stand out: First, one reason that the elderly respondents are less likely than others to be in foreclosure is that they are more likely to own their homes free and clear. This finding suggests that while elderly people might be impacted by falling housing prices, they would not be as likely as younger households to suffer short-term credit constraints due to changes in the terms of a mortgage. Second, while households with a head who is unemployed are disproportionately more likely than others to be in foreclosure, only 16 percent of those households currently in foreclosure have unemployed heads. Hence, many employed people are also experiencing foreclosure, or living with the threat of foreclosure. A third observation is that those who are currently in foreclosure report much worse health than others, and are more likely to have most types of chronic conditions.
15
Of course this simple tabulation of means cannot resolve cause and effect, and the small numbers of foreclosures in the PSID makes it difficult to analyze the relationship between
foreclosure and health in a multivariate model. Hence, we turn to administrative hospital records for that analysis.
b) Foreclosures, Hospitalizations and Emergency Room Visits
We focus on the states of Arizona, California, Florida and New Jersey for several reasons. First, we wish to focus on states that have recently had extremely high levels of foreclosures. Together these four states comprised almost 50 percent of all the foreclosure filings in 2008 (RealtyTrac Press Release, January 15, 2009). They were all in the top 10 foreclosure states, posting the third, first, second, and tenth largest totals of foreclosures in the country in 2010, respectively. Second, we wish to use hospital discharge and emergency room data for entire states, rather than from a sample of hospitals.7 It is important to include ER visits in addition to hospitalizations, because financial constraints can affect whether the person first presents at the ER, as well as the probability that someone on the margin is admitted to hospital if they do appear at the ER. These are the only states that provide public access to these kinds of data, and also release information about the patient’s zip code and/or county.
Foreclosure data are available at the zip code level monthly between April 2005 through December 2009 from RealtyTrac. RealtyTrac is a leading foreclosure monitoring and marketing company, which collects data from public records at the local level, which is where legal
documents for foreclosures are recorded, posted, and published. With coverage that accounts for
7
For example, the National Inpatient Database has a 20 percent sample of hospitals and it is not possible to tell if changes in hospitalizations or ER visits at hospitals in the sample might be counter-balanced by changes in these outcomes at other hospitals outside the sample.
16
more than 90 percent of the U.S. population, the RealtyTrac data have been widely used by the media as well as researchers studying foreclosures (e.g., Mian, Sufi, and Trebbi, 2011;
Hernandez, 2009; Pettit et al., 2009; Gaffney, 2009).
The foreclosure data includes information about both a notice of trustee sales (NTS) and/or a notice of foreclosure sale (NFS). Following instructions from RealtyTrac, we construct measures of foreclosures as NTS+NFS.8 The data also includes information about real-estate owned (REO) properties, which are properties that have gone back to the mortgage lender after an unsuccessful foreclosure auction, and remain unsold. We include REOs as an additional control for neighborhood conditions and past foreclosure activity in our regressions.9
We include two additional measures of local housing market conditions in some of our specifications. Zip code level data on housing prices in each quarter come from Zillow. Zillow does not compile data for smaller zip codes so including this variable reduces our sample size by about a quarter. Data on vacancies in each quarter come from the U.S. postal service. The postal service asks mail carriers to report addresses that have been vacant 90 days or more. These data do not start until the fourth quarter of 2005, so including them also causes some loss of data. In practice, our measures of foreclosures and REOs account for most of the within-zip code variation in the Zillow housing price measure, suggesting that it provides little additional information.10
8
A state generally has either NTS or NFS and this depends on whether the state uses a judicial or a non-judicial process in foreclosures. The main difference between a non-judicial process and a non-non-judicial process is that the former procedure requires court action on a foreclosed home. In general, NTS is available only for non-judicial states, while NFS is only available for judicial states. Some states use both procedures. Among our sample states, AZ and CA conduct both judicial and non-judicial foreclosures, while FL and NJ only conduct judicial foreclosures.
9
Mian, Sufi, and Trebbi (2011) define foreclosures as NTS+NFS+REO. However, since we use quarterly data, there is a possibility that the same property could be counted both as NTS or NFS and as REO. Hence, to avoid double-counting, we include these measures separately.
10
Specifically, if we estimate an equation similar to (1) below, where the dependent variable is housing prices, the R-squared is 0.85. If the dependent variable is vacancies, the R-squared is 0.48.
17
Our health measures come from two databases collected by the Healthcare Cost and Utilization Project (HCUP), which services a family of health care databases developed through a Federal-State-Industry partnership and sponsored by the Agency for Healthcare Research and Quality (AHRQ). The HCUP compiles these data from participating states and releases them in a standard form.11 Data on ER visits comes from the State Emergency Department Databases (SEDD), which capture discharge information on all emergency department visits that do not result in an admission. Hospitalization data come from the State Inpatient Databases (SID), which hold the universe of inpatient discharge abstracts. In order for a discharge record to exist, the patient must have been admitted to hospital; hence the SID contains records of patients who require more intensive treatment or for whom treatment cannot be provided on an out-patient basis. The smallest level of geographic detail give both databases is the zip code.12
In order to match the hospitalization data and the foreclosure data, we calculate the total number of hospitalizations in each category for each zip code and quarter. Similarly, we calculate the total number of foreclosures and REOs for each zip code and quarter. We impute zeros for zip codes that appear in RealtyTrac but have no hospitalizations. The result is a balanced panel of 3,525 zip codes with 19 time periods for a total of 66,975 observations.
In what follows, we devote most of our attention to a combined data set of ER visits that did not result in hospitalizations, plus all hospitalizations other than those for childbirth,
11
Visit http://www.ahrq.gov/data/hcup/ for more information on HCUP databases. 12
We restrict the sample to Zip Code Tabulation Areas (ZCTAs) as these are the units reported by the Census. Zip codes are constructed by the postal service and frequently change. ZCTAs are
constructed by Census and remain consistent between Censuses. Using ZCTAs allows us to merge population estimates to our data. We drop about 10% of our sample that could not be matched to ZCTAs. The final number of ZCTAs in our analysis sample is 3,525. For ease of understanding we use the term zip code throughout.
18
contraception, and abortion. We excluded these procedures because we felt that fertility responses to foreclosure could be quite complex. We treat ER visits and hospital admissions together, because wealth, demographic characteristics, or changes in health insurance status might be correlated with the decision to admit a patient presenting at the ER, at the margin.
We also look separately at elective procedures (which never occur in ERs). Elective procedures are coded by HCUP, and involve visits that are not urgent, not emergencies, and not trauma care. Typically, these visits are scheduled. To say that they are not urgent does not necessarily imply that they are unimportant. Elective visits might include regularly scheduled visits for chemotherapy, for example. However, patients have more discretion over the
scheduling of elective visits and might decide to forego them or to stretch out the time between visits in response to financial constraints. On the other hand, to the extent that the foreclosure crisis worsens people’s health, it might result in greater numbers of both scheduled and
unscheduled visits. Hence, the effects of the crisis on elective visits are ambiguous whereas the effects on non-elective visits should be positive.
Figures 2 and 3 show changes in foreclosure rates and changes in non-elective visits (both hospitalizations and ER) for zip codes in New Jersey, one of our sample states.13 Rates are calculated using zip code population data from the 2000 Census. That is, these rates can be
interpreted as the number of foreclosures or hospitalizations per person (rather than per property). We calculate the rates this way since we look at person-level medical data. The figures show that there is considerable variation across zip codes in both types of changes. They also suggest that areas that experienced the sharpest increases in foreclosures also tended to experience the largest increases in hospitalizations.
13
19
Table 2 shows means for all zip codes, as well as for those that were in the top and bottom fifths of the distribution of the rate of foreclosures in 2009. While the average zip code in our sample had 90.8 foreclosures in 2009, zip codes in the top fifth had 201foreclosures compared to only 4.74 foreclosures in the least impacted zip codes. The table shows that the number of foreclosures increased 15 fold in the most highly impacted zip codes, but less than 4 fold in the least impacted zip codes. Housing prices also fell more precipitously in the most impacted zip codes, and vacancies soared.
The ER and hospitalization data is explored in Table 3. HCUP data sets classify diagnoses using a tool called Clinical Classification Software (CCS).14 This software takes thousands of International Classification of Disease (ICD) codes and groups them into clinically meaningful categories. We use the single level diagnosis codes, and group them into larger aggregates using information from the multi-level diagnosis codes. For example, single codes 122 (Pneumonia), 123 (Influenza), 124 (Acute and Chronic Tonsilitis), 125 (Acute Bronchitis), and 126 (other Upper Respiratory Tract Infections) are grouped together in a category we call “Upper Respiratory Tract Infections”. More information about our aggregates is in the Appendix.
An additional hospitalization category that we consider is an index of “Prevention Quality Indicators” (PQIs). These indicators are published by the Agency for Healthcare Research and Quality (AHRQ) and are based on ICD-9-CM diagnosis codes. PQIs are index conditions for which good outpatient care can prevent the need for hospitalizations or ER visits, or for which early intervention can prevent complications or more severe diseases. Hospitalizations and ER visits for many other conditions may also be preventable to some extent, but PQIs are those which can almost always be prevented with appropriate care. To the extent that individuals stressed by
14
20
the foreclosure process have fewer preventive doctor visits, stop adhering to prescription medicine regimes, or reduce self care, underlying health problems may be exacerbated by foreclosure activity. The PQI category includes short and long-term complications of diabetes, amputations due to diabetes, and uncontrolled diabetes, perforated appendix, chronic obstructive pulmonary disease, hypertension, congestive heart failure, dehydration, bacterial pneumonia, urinary tract infection, angina without procedure, and adult asthma.
The first column of Table 3 shows the number of hospitalizations of different types overall, while the second and third columns of Table 3 show types of visits for people in zip codes in the top and bottom fifths of foreclosure activity (as of 2009). Comparing high and low
foreclosure zip codes, we see that the former have about 45 percent more people and 45 percent more elective visits. However, people in high foreclosure zip codes have more than twice as many non-elective visits than those in low foreclosure zip codes and also have twice as many preventable visits. Turning to specific categories of visits, suicide attempts stand out since, while rare, they are 4.4 times more prevalent in high foreclosure areas. It is quite possible that the foreclosure crisis has had negative effects on mental health. In related work, Deaton (2011) finds negative effects of the Lehman brother’s failure on self-reported stress and well-being.
IV. Research Design and Methods
We estimate a series of models that relate changes in the number of hospitalizations or ER visits at time t to the number of foreclosures and real-estate occupied homes at t-1. Specifically, we estimate models of the form:
(1) Hzqt = α0 + α1Fzqt-1 + α2REOzqt-1 + µz + λcqt + εzqt,
21
interest in equation (1) are Fzqt-1, the number of foreclosures in the zip code last quarter and REOzqt-1, which represents the “overhang” of houses that have been foreclosed and remain unsold. Neighborhoods with large numbers of foreclosed properties that have not been sold may be different than other
neighborhoods with similar levels of foreclosure activity. As noted above, homeowners who are foreclosed at t-1 may have left the area by time t.15 Hence, equation (1) captures the effect of last quarter’s foreclosure auctions on those who remain in the neighborhood.
Indicators for each zip code, µz, are included to control for any time-invariant zip code level factors that may be correlated with both foreclosures and health. To adjust for correlations within a zip code, standard errors are clustered at the zip code level. The unit of analysis in equation (1) is a zip code, quarter, and year.16 The data is weighted using the zip code population for the relevant demographic group from the 2000 Census.
The vector λcqt includes an indicator for each county, quarter, and year. These indicators control for any time varying county level factors that are correlated with both foreclosures and health. For example, they serve as controls for unemployment in a particular county, year, and quarter, as well as for seasonality in illness or in foreclosures which may be different in different areas. The vector εzqt represents an idiosyncratic random error term.
We estimate separate models by age, focusing on those aged 0 to 19, 20 to 49, 50 to 64, and aged 65 plus. While people in different age groups may be differentially affected by the
15
Depending on the state, homeowners may stay in their homes some time after a foreclosure auction, but this is generally 30 days or less.
16
Note that we have specified equation (1) in terms of levels. It might be more natural to think of specifying the equation in terms of rates; that is, the rate of hospitalization would be regressed on the rate of foreclosures. However, accurate data on population is only available at the zip code level from the decennial Census. If the measure of population used to construct the rates is a constant, then equation (1) is equivalent to a model specified in rates (since both sides would be divided by the same constant to get the rate). Moreover, including the zip code fixed effect accounts for the fact that some zip codes are much larger than others.
22
foreclosure crisis, they also suffer from different types of medical conditions. For example, people younger than age 50 have few heart attacks. Those aged 65 and over also have public health insurance in the form of Medicare.
We also estimate separate models by race and ethnicity. Again, while there is good reason to suppose that minorities have been differentially affected by the foreclosure crisis, they may also differ in terms of the types of maladies they are prone to, and the probability of having health insurance.
We will show robust and consistent evidence of a strong association between foreclosure and increases in visits. However, to answer the question asked in the title of this paper, it is necessary to provide further insights into the mechanisms underlying this association.
One possibility is that it is not foreclosure per se, but increases in unemployment that are driving the increases in hospitalizations and ER visits. As discussed above, all our models control for county-level unemployment in each year and quarter by including the vector λcqt. But unemployment may vary at the zip code level within counties, though official unemployment rates are not computed at the zip code level (and therefore no zip code level measure is available). However, while high levels of unemployment may be currently causing foreclosures (Schmidt, 2011), this was not the case during much of our sample period.
In order to focus on the role of foreclosure, we estimate models using only data from 2005 to 2007, before the steep climb in unemployment began. Second, we estimate models aggregated to the county level that include both foreclosures and the unemployment rate in order to compare the estimated effects at the same level of aggregation. Third, we estimate our models for those with private health insurance, who should have been least affected by unemployment.
23
A second possibility is that the foreclosure crisis is not making people sick, but only causing them to switch out of private doctor’s offices and into hospitals and emergency rooms. We address this issue in several ways. First, we focus on non-elective visits, which are urgent and unscheduled. Switching is likely to be more of an issue for elective visits. Second, we examine specific conditions which are almost always treated in hospitals and emergency rooms rather than outpatient settings, including heart attack and stroke. For these conditions, the possibility of “switching” is extremely limited. Third, we look separately at patients who have private health insurance or Medicare and therefore have little need to switch venues (though it may be argued that the privately insured would like to avoid co-pays when financially strapped). Fourth, if our results were driven mainly by venue switching, then we would expect to see smaller estimates for minorities, since minorities are more likely to use hospitals and emergency rooms for primary care to begin with. Instead, we find larger effects of foreclosure on visits for minorities. Increases in hospital and emergency room visits for preventable conditions do suggest that people are cutting back on outpatient visits, but also suggest that this is having a real, negative impact on their health.
V. Results
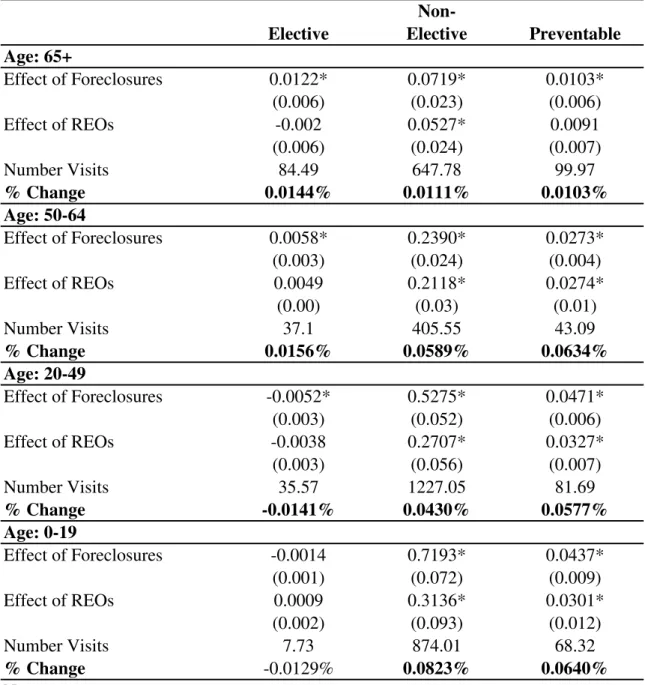
Table 4 provides an overview of our results by age. Each entry of the table is from a separate regression and shows the coefficients α1 on foreclosures and α2 on REOs in the last period. These coefficients are not directly comparable between regressions given different baseline numbers of visits in each category and demographic group. Hence, we also show the baseline number of visits, and the percent change in visits implied by the coefficient estimate. In the discussion below, we focus on the estimated effects of foreclosures. The effects of REOs are
24
generally of similar sign and slightly smaller in magnitude. If the coefficient α1 is statistically significant at least at the 95 percent level of confidence, then we show the implied percent change in bold type. A comparison of the first and second columns shows that foreclosure had relatively little impact on elective procedures compared to its impact on non-elective procedures. There are large and statistically significant increases in non-elective procedures for all age
groups, although the effects are smallest for the elderly and largest for children. The estimates imply that an increase of 100 foreclosures would increase non-elective visits by 8.2 percent among children, 4.3 percent among those aged 20-49, 5.9 percent among those aged 50-64, and by 1.1 percent among the elderly.
The third column of Table 4 shows that there are large and significant impacts on preventable visits for all age groups, though again, the increases are smaller for the elderly than for other groups. The difference between the effects on the elderly and the effects on those aged 50-64 suggests that while the elderly are not immune to the effects of the crisis, they are not suffering to the same extent as younger age groups. This could be because of Medicare
coverage, or it could reflect the fact that they are more likely to own homes “free and clear” and thus less likely to be “under water” on their mortgages than younger homeowners.
Table 5 shows estimates of the effects of foreclosure on specific categories of visits. As expected, there is no impact of foreclosure on our “control” category, cancer visits. There is an impact on heart attack and stroke, but only among those aged 50-64. It is not surprising that younger age groups are unaffected given the baseline concentration of visits for heart attack and stroke among older people. However, all groups aged less than 65 see an increase in milder heart problems such as chest pain and dysrhythmias. We also see significant increases in gastro-intestinal problems and respiratory infections which are plausibly stress-related.
25
We also find significant effects on mental health for those less than 65. For example, an increase of 100 foreclosures would be associated with increases of 14.6 percent, 9.2 percent, and 12.8 percent in visits for anxiety among those aged 50-64, 20-49, and 0-19, respectively. The increases in visits related to suicide attempts are particularly striking, though they must be interpreted with some caution given the small baseline numbers of such visits. Given that not every person with a mental health crisis presents at an ER or hospital, it appears that the foreclosure crisis may be taking a particularly heavy toll in terms of mental health.
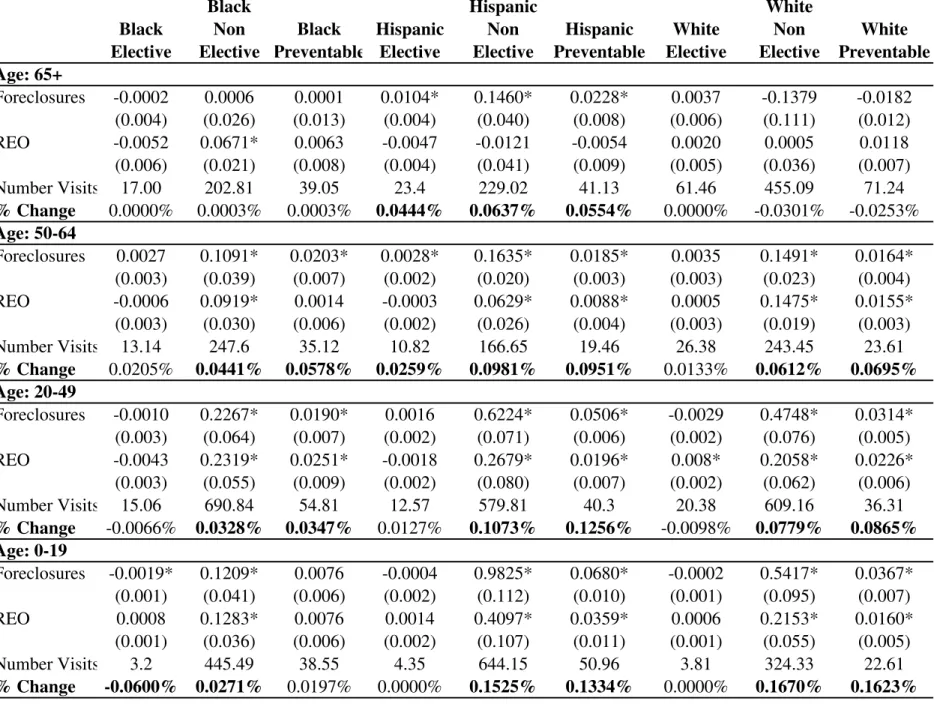
As mentioned above, there is good reason to expect larger effects of the foreclosure crisis on the health of blacks and Hispanics. Hence, we have estimated all of our models by age, race, and ethnicity. As shown in Table 6, the most striking finding is a much larger percentage increase in visits for Hispanics than for other groups. The difference is particularly pronounced among the elderly. Table 6 also illustrates the age profile noted above, with larger effects for the youngest people. This is however, not true for blacks, where visits for children seem to be relatively unaffected by the crisis. It is possible that black children have been largely cushioned from the medical effects of the crisis by eligibility for the Medicaid program.
Turning to preventable visits, the most striking finding is again the much larger estimated impacts for Hispanics. We have estimated models for each of the more detailed categories of conditions, and find that they generally follow a similar pattern. Heart attacks and strokes are an exception, as we illustrate in Figure 4. The figure shows high impacts of foreclosures for blacks as well as for Hispanics. In fact, blacks aged 50-64 have the highest estimated percentage change in heart attack and stroke with foreclosures: Our estimates imply than an additional 100
foreclosures in the average zip code would be associated with a 7.9 percent increase in heart attack or stroke in this group. The 0-19 year old group is omitted from Figure 4 since they have
26
few heart attacks or strokes This analysis suggests that minorities really have been at double jeopardy in the foreclosure crisis – both more likely to live in highly impacted zip codes, and more likely to suffer ill health as a result.
Table 7 examines the effects of the foreclosure crisis on those with private health insurance. We do not include the elderly in this table since most of the elderly are covered by Medicare. The composition of the privately insured may be changing if, for example, financial distress causes homeowners to drop insurance coverage; if those losing insurance are likely to be sicker in any case (at least within age categories) then composition effects would cause us to see decreases rather than increases in privately insured visits. Still, within the privately insured sample, we find significant positive effects on visits in each age category. In the 50-64 year old group, we find positive effects on total non-elective visits, preventable visits, and on
gastrointestinal problems, and upper respiratory infections. Among 20-49 year olds, and among children there are significant negative effects on elective visits (which are suggestive of financial constraints) and positive effects on upper respiratory infections and suicides. Among children, there are also significant positive effects on non-elective visits. These estimates suggest that even those who retain private health insurance are not immune from the negative health effects of the foreclosure crisis though those without health insurance or more adversely affected.
Table 8 shows several alternative specifications for a representative group of the conditions discussed above, and for two age groups, those aged 20-49 and 50-64. Panels 1 and 2 show estimates for 2005 through 2007 only. As shown in Figure 1, unemployment did not start its sharp rise until 2008. Table 7 shows that we still find large increases in visits in this time period, though some of our estimates are less precisely estimated given that the sample has been cut in half. Panels 3 and 4 present estimates of the effect of foreclosure using county level data.
27
The models include county fixed effects and an indicator for each year*quarter as well as the unemployment rate. We find positive and statistically significant effects of foreclosures on visits, though the implied percentage changes are about half as big as in the zip code level models.17 Hence, using county level data attenuates, but does not eliminate the estimated effects of foreclosure. Unemployment is also estimated to increase hospital and ER visits for some conditions, though it is less consistently associated with higher visit levels than foreclosures.
We have also estimated models further exploring the relationship between foreclosure and unemployment by including interactions between the unemployment rate and the number of foreclosures. Because unemployment is available only at the county level, the main effect of unemployment is absorbed by the county*year*quarter effects included in these, as in all of our models. Estimates from these models are shown in Appendix Table 1. The implied percent change in visits is shown for two different levels of unemployment that roughly bracket the range of our data: 5 percent and 10 percent. The percent changes are positive (except for suicide when unemployment is 5 percent), and the estimated percent change when unemployment is 10 percent is strikingly similar to what we see in our main specifications. Thus, these estimates suggest that while foreclosure and unemployment have separate impacts, the impact of
foreclosure is worse when unemployment is high, as one might expect if both capture different types of financial distress.
Table 9 shows estimates from models that add zip code level measures of housing prices and vacancies. Adding these variables reduces the estimated impact of foreclosure only slightly. For example, among those aged 20-49 year olds, the implied percent change in non-elective
17
There are approximately 20 times as many foreclosures in the county than in the zip code. To take 20-49 year olds for example, the zip code level analysis implies that 100 foreclosures would increase elective visits by 4.3%. The county level analysis implies that 2,000 foreclosures would increase non-elective visits by about 2%.
28
visits with an additional 100 foreclosures falls from 4.3 percent to 4.1 percent. Higher housing prices have generally negative effects on the number of visits, though there is an anomalous positive estimated effect of housing prices on suicides.
All of these measures, the number of foreclosures, the number of REOs, the Zillow housing price measure, and the post office’s measure of vacancies, can be viewed as imperfect indicators of the value of the housing stock in the neighborhood. We believe that the reason that adding housing prices and vacancies to the models has little impact on the estimated effect of foreclosure is that most of the relevant information about property values is captured by the foreclosure and REO variables, as well as by the zip code fixed effects and the indicators for county*year*quarter. In particular, measured housing prices may be a relatively poor way to track housing values in neighborhoods where few houses are selling.
VI. Conclusions
This study examines the effects of the foreclosure crisis in order to shed light on the health effects of financial distress. Our results suggest that individuals in communities that have suffered high rates of foreclosure are more likely to seek treatment in hospitals and emergency rooms for a variety of stress-related conditions such as mental health conditions, heart attack and stroke, as well as for conditions that could be prevented by appropriate care such as
hospitalizations for hypertension.
The estimated effects differ strongly by race and by age: The foreclosure crisis is having its most harmful effects on those younger than age 65 and on minorities, especially Hispanics, though blacks aged 50 to 65 experience the largest increase in visits for heart attack and stroke of any group. These effects cannot be attributed solely to the increase in unemployment, or to
29
individuals switching from outpatient to hospital settings. Our results do suggest however, that insurance coverage is protective (though this may be in part because those who retain insurance coverage are less likely to be in financial distress).
Our estimates imply that the 2.82 million foreclosures in 2009 led to 4.18 million additional non-elective hospital and ER visits among those aged less than 65. While the cost data available from HCUP is imperfect and covers only hospital costs, a crude cost analysis suggests that non-elective visits impose a cost of an average of $2,521 (in 2009 dollars). Thus, additional visits due to foreclosure cost in excess of $10.5 billion in 2009 alone. 18
Taken together, these results highlight an important consequence of the foreclosure crisis that has not received much attention from policy-makers. They suggest that measures to keep individuals in their homes are likely to improve health only to the extent that they stabilize neighborhoods and ameliorate financial distress among not only those being foreclosed, but among their neighbors.
18
HCUP data cost data do not include physician costs, which are usually billed separately. Other limitations are that cost data are not available for ER visits in California, so that we had to exclude CA from our calculations of the average cost of a visit. Also, data are presented in terms of “total charges,” essentially a list price which few people pay, and “cost-to-charge” ratios (CCR) for the hospital or for groups of hospitals. One must multiply the total charge by the CCR in order to approximate the actual cost of the visit.
30 References
Agarwal, S., Driscoll, J., Gabaix, X., & Laibson, D. (2007). The age of reason: Financial decisions over the life-cycle with implications for regulation: NBER Working Paper 13191. Anderson, R., & VanderHoff, J. (1999). Mortgage default rates and borrower race. Journal of Real Estate Research, 18(2), 279-289.
Avery, R.B., Brevoort, K.P., & Canner, G.B. (2007). The 2006 HMDA Data Fed. Res. Bull. A73, 93.
Bajari, Patrick, Chenghuan Sean Chu, Minjung Park. (2008). An Empirical Model of Subprime Mortgage Default from 2000 to 2007, NBER Working Paper #14625, Dec.
Bennett, G.G., Scharoun-Lee, M., & Tucker-Seeley, R. (2009). Will the public's health fall victim to the home foreclosure epidemic? Public Library of Science Medicine, 6(6), 1-5. Bocian, D.G., Ernst, K.S., & Li, W. (2008). Race, ethnicity and subprime home loan pricing. Journal of Economics and Business, 60(1-2), 110-124.
Bowdler, J., R., Quercia, & Smith, D.A. (2010). The foreclosure generation: The long-term impact of the housing crisis on Latino children and families. National Council of La Raza and the UNC Center for Community.
Browning, Martin, A. Moller Dano and E. Heinesen. (2006). Job Displacement and Stress-Related health Outcomes, Health Economics, 15(10), 1061-1075.
Calem, Paul, Kevin Gillen, and Susan Wachter. (2004). The Neighborhood Distribution of Subprime Lending, Journal of Real Estate Finance and Economics, 29 #4, 393-410. Calomiris, Charles W., Longhofer, Stanley D. , & Miles, William. (2008). The Foreclosure-House Price Nexus: Lessons from the 2007-2009 Housing Turmoil.
Campbell, J.Y., Giglio, S., & Pathak, P. (2009). Forced sales and house prices: National Bureau of Economic Research Cambridge, Mass., USA.
Collins, J.M. (2009). Education Levels and Mortgage Application Outcomes: Evidence of Financial Literacy(Vol. Discussion Paper No. 1369-09): University of Wisconsin-Madison, Institute for Research on Poverty.
Cooper, C.L. (2005). Handbook of stress medicine and health: CRC.
Cunningham, D.F., & Capone Jr, C.A. (1990). The relative termination experience of adjustable to fixed-rate mortgages. Journal of Finance, 1687-1703.
31
Currie, J. (2009). Healthy, wealthy, and wise: Socioeconomic status, poor health in childhood, and human capital development. Journal of Economic Literature, 47(1), 87-122.
Currie, J., & Lin, W. (2007). Chipping away at health: more on the relationship between income and child health. Health Affairs, 26(2), 331.
Deaton, Angus. (2002) Policy Implications of the Gradient of Health and Wealth, Health Affairs, 21 #2: 13-30.
Deaton, Angus. “The Financial Crisis and the Well-Being of America,” NBER Working Paper #17128, June 2011.
Dehejia, R., & Lleras-Muney, A. (2004). Booms, Busts, and Babies' Health. Quarterly Journal of Economics, 119(3), 1091-1130.
Delgadillo, L.M., Erickson, L.V., & Piercy, K.W. (2008). Disentangling the Differences Between Abusive and Predatory Lending: Professionals’ Perspectives. Journal of Consumer Affairs, 42(3), 313-334.
Dell'Ariccia, G., Igan, D., & Laeven, L. (2008). Credit booms and lending standards: Evidence from the subprime mortgage market(Vol. Working Paper No. 2008-2106): International Monetary Fund.
Demyanyk, Y., & Van Hemert, O. (2011). Understanding the subprime mortgage crisis. Review of Financial Studies, 24(6), 1848.
Deb, Partha, Gallo, William T., P. Ayyagari, Jason Fletcher, Jody Sindelar. (2011).
The effect of job loss on overweight and drinking. Journal of Health Economics.30(2):317-327. Dietz, R.D., & Haurin, D.R. (2003). The social and private micro-level consequences of
homeownership. Journal of Urban Economics, 54(3), 401-450.
Dooley, D., Fielding, J., & Levi, L. (1996). Health and unemployment. Annual review of public health, 17(1), 449-465.
Duca, J.V., & Kumar, A. (2010). Financial Literacy and Mortgage Equity Withdrawals: Federal Reserve Bank of Dallas.
Eliason, M. and Storrie. (2009a). Does Job Loss Shorten Life? Journal of Human Resources, 44(2), 277-302.
Eliason. M. and Storrie. (2009b). Job Loss is Bad for Your Health: Swedish Evidence on Cause-Specific Hospitalization Following Involuntary Job Loss, Social Science and Medicine, 68(8), 1396-1406.
32
Feinstein, J.S. (1993). The relationship between socioeconomic status and health: a review of the literature. The Milbank Quarterly, 71(2), 279-322.
Gaffney, M. (2009). Money, Credit, and Crisis. American Journal of Economics and Sociology, 68(4), 983-1038.
Gallo, W.T., Bradley, E.H., Siegel, M., & Kasl, S.V. (2000). Health effects of involuntary job loss among older workers. The Journals of Gerontology Series B: Psychological Sciences and Social Sciences, 55(3), S131.
Gauger, J., & Coxwell Snyder, T. (2003). Residential Fixed Investment and the Macroeconomy: Has Deregulation Altered Key Relationships? The Journal of Real Estate Finance and
Economics, 27(3), 335-354.
Gerardi, K., Ross, S.L., & Willen, P. (2011). Decoding misperceptions: The role of underwriting and appropriate policy responses. Journal of Policy Analysis and Management, 30(2), 396-398. Gerardi, K., & Willen, P. (2009). Subprime mortgages, foreclosures, and urban neighborhoods. The BE Journal of Economic Analysis & Policy, 9(3), 12.
Gerdtham, U.G., & Ruhm, C.J. (2006). Deaths rise in good economic times: evidence from the OECD. Economics & Human Biology, 4(3), 298-316.
Goldberger, L., & Breznitz (Eds.), S. . (1993). Handbook of stress: Theoretical and clinical aspects. New York: Free Press.
Government Accountability Office. (2004). Consumer Protection: Federal and State Agencies Face Challenges in Combating Predatory Lending. Washington DC: Government
Accountability Office.
Green, R.K. (1997). Follow the Leader: How Changes in Residential and Non residential Investment Predict Changes in GDP. Real Estate Economics, 25(2), 253-270.
Harding, J.P., Rosenblatt, E., & Yao, V.W. (2009). The contagion effect of foreclosed properties. Journal of Urban Economics, 66(3), 164-178.
Hernández, J. (2009). Redlining revisited: mortgage lending patterns in Sacramento 1930–2004. International Journal of Urban and Regional Research, 33(2), 291-313.
Immergluck, D., & Smith, G. (2006). The external costs of foreclosure: The impact of single family mortgage foreclosures on property values. Housing Policy Debate, 17(1), 57-79. Keys, B.J., Mukherjee, T., Seru, A., & Vig, V. (2010). Did Securitization Lead to Lax
33
Leamer, E.E. (2007). Housing is the business cycle: National Bureau of Economic Research Cambridge, Mass., USA.
Lin, Z., Rosenblatt, E., & Yao, V.W. (2009). Spillover effects of foreclosures on neighborhood property values. The Journal of Real Estate Finance and Economics, 38(4), 387-407.
Ludy, WH, & Herlitz, J. (2009). Foreclosures in states and metropolitan areas: Patterns,
forecasts, and pricing toxic assets: Department of Urban and Environmental Planning, School of Architecture, University of Virginia.
Lusardi, A., Schneider, D.J., & Tufano, P. (2010). The economic crisis and medical care usage: National Bureau of Economic Research Cambridge, Mass., USA.
Lusardi, A., & Tufano, P. (2009). Debt literacy, financial experiences, and overindebtedness: National Bureau of Economic Research Cambridge, Mass., USA.
Mallach, A. (2009). Stabilizing communities: a federal response to the secondary impacts of the foreclosure crisis. Washington: Brookings Institution.
Mayer, Christopher and Karen Pence. (2008). Subprime Mortgages: What, Where, and to Whom? NBER Working Paper #14083, June.
Mayer, C., & Hubbard, R.G. (2008). House prices, interest rates, and the mortgage market meltdown. Unpublished Manuscript, Columbia Business School.
McEwen, B.S. (1998a). Stress, adaptation, and disease: Allostasis and allostatic load. Annals of the New York Academy of Sciences, 840(1), 33-44.
McEwen, B.S. (1998b). Protective and Damaging Effects of Stress Mediators, New England Journal of Medicine, Jan. 15, 1998: 171-179.
Mian, A.R., & Sufi, A. (2010). Household Leverage and the Recession of 2007 to 2009. IMF Economic Review, 58, 74-117.
Mian, Atif, Sufi, Amir, & Trebbi, Francesco. (2010). The Political Economy of the US Mortgage Default Crisis. American Economic Review, 100(5), 1967-1998.
Mian, Atif, Sufi, Amir, & Trebbi, Francesco. (2011). Foreclosures, House Prices, and the Real Economy, NBER Working Paper #16685, Jan.
Miller, D.L., Page, M., Stevens, A.H., & Filipski, M. (2009). Are Recessions Really Good for your Health? Understanding Procyclical Mortality. American Economic Review Papers and Proceedings, May 99(2), 122-127.
Nettleton, S., & Burrows, R. (1998). Mortgage debt, insecure home ownership and health: an exploratory analysis. Sociology of health & Illness, 20(5), 731-753.
34
Nettleton, S., & Burrows, R. (2000). An Investment in Capital and an Emotional Loss: The Health Effects of Mortgage Repossession. Housing Studies, 15(3).
Neumayer, E. (2004). Recessions lower (some) mortality rates::: evidence from Germany. Social Science & Medicine, 58(6), 1037-1047.
Pettit, Kathryn LS, Cunningham, Mary K., Kingsley, G. Thomas, Hendey, Leah, Comey, Jennifer, Getsinger, Liza, & Grosz, Michel. (2009). Foreclosures in the Nation's Capital: Urban Institute.
Pollack, C.E., & Lynch, J. (2009). Health status of people undergoing foreclosure in the Philadelphia region. American journal of public health, 99(10), 1833.
Pollack, CE, Von Dem Knesebeck, O., & Siegrist, J. (2004). Housing and health in Germany. Journal of epidemiology and community health, 58(3), 216.
RealtyTrac Press Release. (2009). Foreclosure Activity Rises 81 percent in 2008 Retrieved July 25, 2011, from http://www.realtytrac.com/content/press-releases/foreclosure-activity-increases-81-percent-in-2008-4551.
Rogers, W.H., & Winter, W. (2009). The impact of foreclosures on neighboring housing sales. Journal of Real Estate Research, 31(4), 455-479.
Ruhm, C.J. (2000). Are Recessions Good for Your Health? Quarterly Journal of Economics, 115(2), 617-650.
Ruhm, C.J. (2003). Good times make you sick. Journal of Health Economics, 22(4), 637-658. Ruhm, C.J. (2006). Macroeconomic conditions, health and government policy. In Robert F. Schoeni, James S. House, George A. Kaplan & Harold Pollack (Eds.), Making Americans Healthier: Social and Economic Policy as Health Policy. New York: Russell Sage Foundation. Ruhm, C.J., & Black, W.E. (2002). Does drinking really decrease in bad times? Journal of Health Economics, 21(4), 659-678.
Schmidt, Julie. (2011, Jan 27). High Unemployment Drove Foreclosures in 2010, USA Today. Schneiderman, N., Ironson, G., & Siegel, S.D. (2005). Stress and health: Psychological,
behavioral, and biological determinants. Annual Review of Clinical Psychology, 1, 607. Shelton, A. (2008). A First Look at Older Americans and the Mortgage Crisis. Insight on the Issues. AARP Public Policy Institute: Washington D.C.
Squires, GD. (2008). Do subprime loans create subprime cities? Surging inequality and the rise in predatory lending. Economic Policy Institute, Briefing Paper, 197.
35
Strully, K.W. (2009). Job loss and health in the US labor market. Demography, 46(2), 221-246. Sullivan, D., & Wachter, T. (2009). Job Displacement and Mortality: An Analysis Using
Administrative Data. Quarterly Journal of Economics, 124(3), 1265-1306.
Rugh, Jacob and Douglas Massey. “Racial Segregation and the American Foreclosure Crisis,” American Sociological Review, 75 #5, October 2010.
Taylor, M.P., Pevalin, D.J., & Todd, J. (2007). The psychological costs of unsustainable housing commitments. Psychological medicine, 37(7), 1027-1036.
U.S. Department of Housing and Urban Development. (2009). Interim Report to Congress on the Root Causes of the Foreclosure Crisis. Office of Policy Development and Research.
Warren, Elizabeth, David U. Himmelstein MD, Deborah Thorne & Steffie Woolhandler MD MPH. "Medical Bankruptcy in the United States, 2007: Results of a National Study," American Journal of Medicine, August.
Williams, D.R., & Collins, C. (1995). US socioeconomic and racial differences in health: patterns and explanations. Annual review of sociology, 349-386.
Xu, X., & Kaestner, R. (2010). The business cycle and health behaviors (Vol. Working Paper No. 15737): National Bureau of Economic Research Cambridge, Mass., USA.