Introduction
Strong and vibrant small businesses are a key to a healthy economy. Small businesses respond well to customer needs and allow an economy to adapt easily to changing circumstance. In addition, small businesses provide a major portion of employment in the U.S. economy: in 1994, businesses with fewer than 100 employees pro-vided 55 percent of all jobs in the nation.1 Of course, some states are more dependent on small businesses than others. In Colorado, for example, the 1994 share of small business jobs was 59.5 percent. Small business is also important for job creation. Between 1992 and 1996, businesses with fewer than 100 employees created 65 percent of new jobs in Colorado.2 Small businesses traditionally depend on commercial banks for financing. Estimates show that as recently as 1993, commercial banks provided 61.3 percent of the volume of small busi-ness credit.3Moreover, given the strong growth of business lending by commer-cial banks since 1993, they continue to be an important source of small busi-ness credit today. The dominance of banks in small business finance has endured despite many changes in the financial market. Nonbank sources of finance, for example, are increasingly important to small businesses. Moreo-ver, the production of small business has been shifting away from manu-facturing and towards services, which suggests a corresponding change in
their need for finance. Banks have adapted to these changes by developing alternatives to the traditional bank loan to small business, such as credit cards, leases, and the use of home mortgages and consumer loans by small business owners.
Because small businesses remain heavily reliant on bank finance, any change in banking could have a signifi-cant impact on their access to credit. A recent, fundamental transformation has been a shift in the location of the headquarters of banking organiza-tions. With relaxation of interstate banking and branching, most states are finding that a growing portion of local banking assets are controlled by organizations headquartered in other states. Many observers fear that interstate banking may restrict the amount of credit available to small business because out-of-state organi-zations may not be sufficiently respon-sive to local small business borrowers. On the other hand, if lending to small business is profitable regardless of the location of a bank’s headquarters, then these changes may have limited impact. This uncertainty suggests that it is important to carefully study the record of commercial bank lending to small business.
Recent studies confirm that it is diffi-cult to make generalizations about the impact of consolidation on small busi-ness lending.4 Results are mixed on whether lending to small business will increase or decrease as a result of 1Jason Henderson,
“How Important Are Small Businesses in the Tenth District?” Federal Reserve Bank of Kansas CityRegional Economic Digest8 (Third Quarter 1997): 9-12. 2Office of Advocacy, “Small Business: Backbone of the Colorado Economy.” Small Business Administration, Internet Web Page www.sba. gov/advo/stats/profiles /97co.html, December 1997.
3Rebel Cole, John D. Wolken, and R. Louis Woodburn, “Bank and Nonbank Competition for Small Business Credit: Evidence from the 1987 and 1993 National Surveys of
Richard J. Sullivan and Kenneth R. Spong are economists in the Division of Bank Supervision and Struc-ture of the Federal Reserve Bank of Kan-sas City. Richard D. Johnson is Associate Professor of Finance and Real Estate, and Ronnie J. Phillips is Professor of Economics, both at Colorado State University. The views expressed in this article are those of the authors, and do not necessarily reflect those of the Federal Reserve Bank of Kan-sas City or the Federal Reserve System.
1994 to 1996
bank mergers. Differences between in-state and out-of-state institutions have also been examined and the results are again mixed.
Different short- and long-term effects of consolidation may cause the
ambiguity. Large banks typically hold a smaller portion of their assets in small business loans, in part because they have lending opportunities unavailable to small banks. Moreo-ver, when a banking organization enters a new market, it may refrain from immediately expanding its loan portfolio as it gathers information about local markets and borrowers. Thus in the short term, acquisition of banks by large, out-of-state banking organizations may lead to less credit available to small businesses.
But in the longer run, forces come into play that mitigate the short-run effects. Out-of-state entrants may bring a different focus and new approaches to small business lend-ing, which could expand small busi-ness credit given sufficient time to implement. In addition there may be a response by competitors, who often redouble their efforts to develop their small business lending. Evidence suggests that the long-run effects generally result in an increase in small business lending, and the increase is sufficient to offset the negative
short-run effect.5
This article examines small business lending in Colorado. What banks have been primary lenders to small businesses? How has the source of loans to small businesses changed in recent years? Has bank consolidation helped or hindered access to credit by small business?
The Colorado banking market is a good case study because it has already undergone significant changes to its
banking structure, and so the impact of bank consolidation on small busi-ness lending should be readily appar-ent. In addition, the Colorado
experience may portend the future of small business lending in other areas as bank consolidation spreads. While our focus is on traditional lending by banks, in recent years small busi-nesses have experienced a number of changes in the way they obtain finance. This article consequently dis-cusses the growth of loans to small business by nonbank financial inter-mediaries, as well as the emergence of bank-provided finance through credit cards and leasing programs.
Consolidation of the banking industry in Colorado
The previous article illustrates the magnitude of structural change to the banking industry of the Tenth District. Colorado is undergoing one of the most rapid transformations, involving extensive entry of interstate banking organizations. This entry is a fairly recent occurrence, prompted by the adoption of interstate entry laws. Colo-rado first allowed entry on a regional basis in 1988, and expanded to nationwide entry in 1991. These same factors are leading to similar changes in banking markets of other states. Colorado’s experience is there-fore important in understanding how continued consolidation will affect small business finance.
Colorado banking is also consolidating due to an easing of intrastate branch-ing laws. Colorado gradually phased in statewide branching between 1991 and 1997, and out-of-state organiza-tions have made extensive use of this branching authority in consolidating their Colorado banks. The number of bank charters held by these organiza-tions fell from 73 in 1994 to 27 in 1996, while the number of banking Small Business
Finance,”Federal Reserve Bulletin, 82 (November 1996): 983-95. By contrast, over the last 40 years, large businesses have had access to a greater variety of sources of finance, which has reduced their need to borrow from commercial banks. 4A discussion of research on small business lending is given in Box 1 on page 20.
5Alan Berger, Anthony Saunders, Joseph Scalise, and Gregory Udell, “The Effects of Bank Mergers and Acquisitions on Small Business Lending,” Federal Reserve Board, Finance and Economics Discussion Series working paper number 1997-28 (May 1997), p. 30.
organizations increased from 16 to 17 (see Table 1; a banking organiza-tion is defined as either a bank hold-ing company or an independent bank).6 One major interstate ownership change occurred when Wells Fargo acquired First Interstate in April of 1996. Both were headquartered out of Colorado, so the split between in-and out-of-state organizations was unaffected. By con-trast, in-state bank charters only fell from 200 to 186, with most of the reduction occurring in mid-sized bank-ing organizations ($300 million to $1 billion in assets), where the number of
bank charters fell from 19 to 9. Colorado now exemplifies a state dominated by out-of-state banking organizations: in 1996, out-of-state banking organizations had control of 63.2 percent of the state’s banking assets. Most of these assets were in large organizations—five out-of-state organizations each had over $1 bil-lion in Colorado banking assets, and together they controlled 56.3 per-cent of Colorado’s banking assets. In contrast, the vast majority of in-state banking organizations, 138 in number for 1996, were under $300 million in assets. But taken
together, these small in-state banks are a major force in Colorado
banking: in 1996, they controlled 24.4 percent of banking assets.
To summarize, the structure of Colo-rado banking is now characterized by out-of-state banking organizations that are few in numbers but are gen-erally very large, and many in-state organizations that, on average, are comparatively small. There has been a recent change in the number of banks because large out-of-state organizations have combined sepa-rately chartered banks under a single charter. However, the split between in- and out-of-state banking organiza-tions has been relatively stable since 1994. Consequently, we expect the recent record of lending to small busi-nesses by commercial banks to reflect little of the short-term effects and more of the long-term effects of con-solidation. Specifically, we expect that some large, out-of-state banking Structure of Colorado banking
1994 and 1996*
Type of banking organization
June 1994 June 1996
Number of banking
organizations Number ofbanks
Number of banking
organizations Number ofbanks
Assets
Headquarters Size** $ millions Percent ofall banks
In-state Small 136 159 138 156 8,459 24.4 Medium 4 19 4 9 1,702 4.9 Large 1 22 1 21 2,638 7.6 All in-state 141 200 143 186 12,799 36.8 Out-of-state Small 9 18 10 12 956 2.8 Medium 2 7 2 7 1,426 4.1 Large 5 48 5 8 19,552 56.3 All out-of-state 16 73 17 27 21,935 63.2 All banks 157 273 160 213 34,733 100.0
*This table excludes a few Colorado banks because we omitted some specialty banks who do not make business loans, and because of problems such as missing data. The banks in this table form the sample upon which Tables 2 through 5 and Chart 1 are based. ** Based on Colorado assets in June 1996. Small: assets under $200 million; medium: assets $300 million to $1` billion; large: assets over $1 billion.
Table 1
6In this article we use the terms in-state and out-of-state banking organizations to refer to banking organizations whose headquarters are respectively in or out of Colorado.
Many studies have examined the impact that mergers and acquisitions may have on small business lending. One major study predicted a sub-stantial decline in small business lending as a result of consolidation.1 Other studies generally find that mergers and acquisitions involving small banks increased small business lending.2 At least one study found no effects of mergers and acquisitions on small business lend-ing.3A few studies have looked at in- and out-of-state ownership and small business lending. In his study of small business lending in the 10th Federal Reserve District, William Keeton found that banks owned by out-of-state bank holding companies tended to invest smaller pro-portions of their funds in small business loans.4 On the other hand, in a study of three states (Illinois, Kentucky, and Montana), Gary Whalen found that banks owned by out-of-state bank holding companies did as much small business lending as in-state banks.5
The problem, as Berger et. al. note, is that there are both short-term static and long-term dynamic effects of consolidation.6Their study presents an analysis of over 6,000 bank mergers and acquisitions from the 1970s to the 1990s, involving more than 10,000 banks. In the study the authors measure four effects of mergers and acquisitions on small business lending: static, restructuring, direct, and external. The static effect is simply the result from the banking institutions combin-ing their pre-merger and acquisition assets into a larger institution with a unified balance sheet and competitive position. The static effect would be expected to reduce the amount of small business lending 1Allen N. Berger, Anil K Kashyap, and Joseph M. Scalise, “The Transformation of the U.S. Banking Industry: What A Long, Strange Trip It’s Been,”Brookings Papers on Economic Activity1 (1995): 55-218.
2Joe Peek and Eric S. Rosengren, “Small Business Credit Availability: How Important is Size of Lender?,” inFinancial System Design: The Case for Universal Banking, edited by Anthony Saunders and Walter Ingo (Burr Ridge, IL, Irwin Publishing, 1996); Joe Peek and Eric S. Rosengren, “Bank Consolidation and Small Business Lending: It’s Not Just Bank Size That Matters,” Federal Reserve Bank of Boston working paper (January 1997); Philip E. Strahan and James Weston, “Small Business Lending and Bank Consolidation: Is There Cause for Concern?” Federal Reserve Bank of New YorkCurrent Issues in Economics and Finance, March 1996; Philip E Strahan and James Weston, “Small Business Lending and the Changing Structure of the Banking Industry,” working paper, Federal Reserve Bank of New York, January 1997.
3Ben R. Craig and Joao Cabral dos Santos, “Banking Consolidation: Impact on Small Business Lending,” working paper, Federal Reserve Bank of Cleveland, February 1997. 4William R. Keeton, “Multi-Office Bank Lending to Small Businesses: Some New Evidence,” Federal Reserve Bank of Kansas CityEconomic Review80 (2nd Quarter 1995): 45-57. 5Gary Whalen, “Out-of-State Holding Company Affiliation and Small Business Lending ,” Office of the Comptroller of the Currency, Economics Department Working Paper number WP95-4 (September 1995).
6 Alan Berger, Anthony Saunders, Joseph Scalise, and Gregory Udell, “The Effects of Bank Mergers and Acquisitions on Small Business Lending,” Federal Reserve Board, Finance and Economics Discussion Series working paper number 1997-28 (May 1997), p. 30.
since evidence indicates that larger institutions hold proportionally fewer small business loans.
However, the more important effects are dynamic. After the merger or acquisition, it is unlikely that the bank will remain at the combined asset level. For example, a merger that initially results in a $1 billion dol-lar bank may eventually become a $900 million bank because of a reduction in excess banking capacity and cost reductions. The struc-turing effect is thus a dynamic effect in which the resulting institution changes its size, financial condition, or competitive position after the merger or acquisition. The restructuring would imply that the result-ing institution may hold more small business loans than would result from the simple static effect.
Yet a third effect would be a direct refocusing of attention toward or away from small business lending. The direct effect is measured by the lending characteristics of the resulting $900 million bank. The combi-nation of a $300 million bank and a $700 million bank may result in a $900 million bank, which could be either more like a $300 million bank or more like a $700 million bank.
The fourth and final effect is the response of other lenders to the merger and acquisition. This effect is called the external effect, and is the increase or decrease in small business lending by other banks and nonbanks. The external effect could be important in increasing small business lending over time if valuable business opportunities for other nearby banks occur when consolidating institutions drop some small business loans. For example, if small business borrowers prefer to work with bankers with whom they are familiar, small business loans may follow employees who leave consolidating banks that downsize and join other nearby banks.
Berger et. al. find that in the case of bank mergers, the big decline in small business lending from the static effect is offset by a small increase in small business lending from the restructuring and direct effects and by a larger increase in small business lending due to the external effect. For acquisitions, the direct and external effects are each strong enough to offset the static effect.
organizations (who have been the major driving force to consolidation) would aggressively pursue small business lending. Consolidation could also induce small banks to increase their small business lend-ing if some consolidatlend-ing institu-tions decide to focus on other types of lending.
Commercial bank lending to small business
Recent trends show that in-state banking organizations have increased their small business lending, while the record for out-of-state banking organizations is mixed. Table 2 shows the total value of small busi-ness lending by Colorado banking organizations for the years 1994 and 1996.7As can be seen, the total value of small business lending by commercial banks increased from
$1.857 billion in 1994 to $2.167 bil-lion in 1996.
Small business loans made by out-of-state banking organizations rose by 2.8 percent over the two-year period, from $1.003 billion in 1994 to $1.031 billion in 1996. By contrast, in-state organizations increased their small business lending by 33.0 percent, rising from $.854 billion in 1994 to $1.136 billion in 1996. The different growth rates resulted in a shift in market share: in-state organizations had only a 46.0 percent market share in 1994, but the share increased to 52.4 percent in 1996.
Comparing the two dominant groups of banking organizations confirms the overall trend. From 1994 to 1996, large (assets over $1 billion) out-of-state banking organizations decreased their small business lending by $18 million, from $825 million to $807 million. In the same period, small (assets under $300 million) in-state banking organizations increased their small business lending by $250 million, from $671 million to $921 million. Banks of differing sizes face different constraints and opportunities, and so it is useful to adjust for size by calcu-lating the ratio of small business loans to total assets (see Table 3). The in-state and out-of-in-state organizations had considerable differences in the change in these ratios. Out-of-state banking organizations lent 4.58 per-cent of assets to small businesses in 1994, and the percentage rose slightly to 4.7 percent in 1996. In-state bank-ing organizations increased their small business loans as a percentage of assets, from 8.11 percent in 1994 to 8.88 percent in 1996.
These divergent records are less a matter of the location of the banking organization’s headquarters, and more Small business lending by size of banking organization
Colorado, 1994 and 1996 Table 2
Type of banking organization
Value of small business lending ($ millions) Percentage change 1994 to 1996 Headquarters Size* 1994 1996 In-state Small 671 921 37.1 Medium 133 169 26.3 Large 49 47 -4.6 All in-state 854 1,136 33.0 Out-of-state Small 85 112 31.4 Medium 93 113 20.9 Large 825 807 -2.2 All out-of-state 1,003 1,031 2.8 All banks 1,857 2,167 16.7
* Based on Colorado assets in June 1996. Small: assets under $300 million; medium: assets $300 million to $1 billion; large: assets over $1 billion.
7To adjust for acquisitions that occurred between 1994 and 1996, the acquired bank’s assets for 1994 were consolidated into that of the acquiring organizations. The Appendix has additional information on the sources, methods, and limitations of the data that we use in this study.
a matter of different sizes of organiza-tions within the in- and out-of-state groups. Small and medium banking organizations, regardless of the loca-tion of their headquarters, appear to have taken similar strategies towards small business lending. Table 2 shows that small and medium in-state organizations increased their lending to small businesses by 37.1 percent and 26.3 percent, respectively, from 1994 to 1996. Small and
medium out-of-state organizations increased their lending to small busi-nesses by 31.4 percent and 20.9 per-cent, respectively, for the same period. These increases are smaller than that for their in-state counter-parts but still represent significant growth.
In addition, Table 3 shows that for in-and out-of-state organizations, small business loans as a percentage of assets was very close among small-and medium-size organizations. In fact, the highest ratio, at 11.66 per-cent for 1996, was recorded by small, out-of-state organizations. It is true that, on the whole, the in-state organizations have become increas-ingly important as sources of finance to small business. To a considerable extent, however, this is because small and medium banking organiza-tions tend to specialize in small busi-ness lending, and most in-state Colorado organizations are in the small and medium categories.
Table 4 details the level of small busi-ness lending for the large (over $1 bil-lion) banking organizations. There is only one in-state banking organiza-tion in the over-$1-billion-asset cate-gory: FirstBank Holding Company of Colorado. Of the six largest banking organizations, FirstBank Holding Company had the lowest ratio of small business loans to assets (1.77 percent in 1996). FirstBank’s
rela-tively low portion of assets in small business loans reflects its decision to specialize in retail banking and con-sumer lending.
There are five out-of-state banking organizations in the over-$1-billion-asset category, and for the 1994 to 1996 period, there were declines in small business loans by some of these organizations and increases by oth-ers. U.S. Bancorp, for example, has chosen to de-emphasize small busi-ness lending in Colorado, and its lending to small businesses declined by 29.32 percent between 1994 and 1996.8 On the other hand, both Nor-west and KeyCorp had large increases (8.66 percent and 36.41 percent, respectively) in small business lending. Like FirstBank Holding Company, these organizations have their own areas of specialization. Box 2 (page 26)
Small business lending relative to total assets Colorado banking organizations, 1994 and 1996
Table 3
Type of banking organization
Small business loans to total assets (percent) Headquarters Size** 1994 1996 In-state Small 9.62 10.88 Medium 8.72 9.91 Large 2.43 1.77 All in-state 8.11 8.88 Out-of-state Small 9.57 11.66 Medium 9.63 7.89 Large 4.11 4.13 All out-of-state 4.58 4.70
* Average value, weighted by total assets.
** Based on Colorado assets in June 1996. Small: assets under $300 million; medium: assets $300 million to $1 billion; large: assets over $1 billion.
8These Colorado banks were part of First Bank System in the period under study. First Bank System acquired U.S. Bancorp and adopted the name in 1997.
provides more details of individual bank strategies towards small busi-ness lending.
Data for Colorado small business lending show that the extent to which an organization commits assets to small business finance is not solely a function of the size or location of the banking organization. Some large in-state lenders focus on markets other than small businesses, while some large out-of-state lenders are signifi-cant players in small business finance. Nevertheless, Table 3 shows a systematic relation between the size of an organization and the share of assets it devotes to small business loans.
There are a number of reasons why ratios of small business loans to assets differ among small and large
banking organizations. First, large banks have business opportunities unavailable to small banks. Due to their size and capital base, large banks are able to provide services to major corporations and larger businesses. Moreover, state and federal regula-tions prohibit banks from making unsecured loans to a single customer that would exceed a specified percent-age of their total capital.9 This con-straint effectively prohibits small banks from making the large loans that big businesses often require. Sec-ond, large banks are able to pursue lines of business that require sufficient volume to be economical. Credit card operations, for example, require large volumes to take advantage of economies of scale. To securitize assets, a bank must be able to pack-age enough loans together to cover underwriting expenses and to market to Small business loans by Colorado banking organizations with assets over $1 billion
1994 and 1996* Table 4
1994 1996
Banking organization Headquarters
Small business loans ($ millions) Small business loans as a percent of assets** Small business loans ($ millions) Small business loans as a percent of assets** Percentage change of small business loans 1994 to 1996
Norwest Corporation Minnesota 314.20 4.50 341.40 4.77 8.66
Banc One Corporation Ohio 177.11 5.03 174.12 5.48 -1.69
U.S. Bancorp*** Minnesota 202.13 2.80 142.87 2.12 -29.32
KeyCorp Ohio 92.85 11.50 126.65 10.08 36.41
FirstBank Holding Company Colorado 49.00 2.43 46.72 1.77 -4.65
Wells Fargo and Company**** California 38.71 2.52 22.14 1.79 -42.81
* Size based on Colorado assets as of June 1996. Banking organizations are listed according to the amount of small business loans as of June 1996. ** Average value for Colorado banks in the organization, weighted by total assets.
*** These banks were part of First Bank System in the period under study. First Bank System acquired U.S. Bancorp and adopted the name in 1997. **** These banks were owned by First Interstate for most of the sample period. Wells Fargo acquired First Interstate in April 1996.
9Kenneth Spong, Banking Regulation, 4th edition. (Kansas City: Federal Reserve Bank of Kansas City, 1994), p. 63.
investors. Large corporate loan programs require not only capital but also specialized loan officers that small banks could not support. These and other opportunities mean that, as a general rule, the percentage of assets devoted to small business loans for large banks will be less than that for small banks.
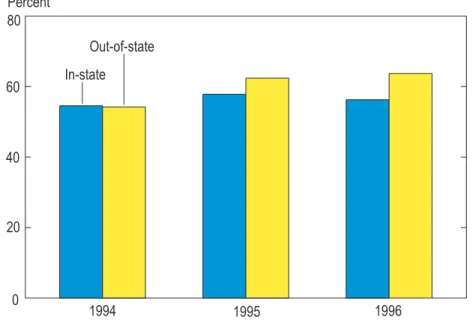
The additional business opportu-nities available to large banks provide important sources for loan growth. Call report data show that over the 1994 to 1996 period, out-of-state banking organizations significantly increased their Colorado lending in four areas: real estate, con-sumer lending, large loans for commercial and industrial bor-rowers, and lease financing. As seen in Chart 1, over the 1994 to 1996 period, out-of-state organi-zations increased their loan-to-asset ratios, while those for in-state organizations stayed rela-tively stable. The large, out-of-state banking organizations were thus committing more of their assets to serving the needs of borrowers.10
Changes in the size distribution of small business loans
Recently, larger banking organizations have changed lending practices and adopted technologies for the smallest loans they make to small business. Bank One, for instance, has a fully automated system for loans up to $35,000, and uses credit scoring in regional centers for loans up to $1 million.11Small business credit cards are another innovation at many larger banks. As one example, Advanta Corporation offers credit cards to small businesses with a credit line up to $25,000.12 These new methods aim to streamline
operations and reduce underwriting costs, and because they typically involve automation and centralized processing and servicing of loans, they have been the province of large banks. Recent research on small business lending in western states has revealed rapid growth of under-$100,000 loans at large banks.13 Investigators have singled out the new underwriting methods to explain this growth. Given this previous research, it is worthwhile to examine the
changes in Colorado small business lending by the size of the loan. Table 5 shows the change in small business loans over the 1994 to 1996 period, by the size of the loan. The data show that the increase in small business lending by smaller in-state organizations occurred with loans of
Total loans to total assets: Colorado banking organizations, 1994 - 1996
Total loans as a percent of total assets* Chart 1 60 40 Percent 0 80 1995 1994 1996
*Average value, weighted by total assets.
20
In-state Out-of-state
10Spong and Shoenhair noted that banks acquired by out-of-state banking organizations became more active lenders after acquisition; see Ken Spong and John Shoenhair,
“Performance of Banks Acquired on an Interstate Basis,” Federal Reserve Bank of Kansas City Financial Industry Perspectives (December 1992): 15-32. 11About 30 percent of the applications are approved by credit scoring (Robin Wantland, “Best Practices in Small Business Lending for Any Delivery System,”
The nature of small business lending has changed considerably in the last several years, and finding a strategy that leads to a successful lending program has proved to be a challenge for bankers. For some large banking organizations, this has meant de-emphasizing small business lending and pursuing alternative lines of business that are more attuned to their specific goals and resource specialties. For other large bank-ing organizations, profitable lendbank-ing to small businesses has required different lendbank-ing methods and new ways of processing loan applications.
Two of the large Colorado banking organizations devote relatively little of their assets to small business loans, which reflects their respective business strategies.1FirstBank Holding Company of Colorado, the largest in-state bank holding company, emphasizes retail banking with a more limited focus on commercial lending. It was the first bank-ing organization in Colorado to offer bankbank-ing locations in grocery stores, servbank-ing cus-tomers through expanded access to banking locations, including an extensive ATM network. It has been successful with retail banking services such as checking
accounts, ATMs, debit cards, mortgages and home equity lines. U.S. Bancorp of Min-neapolis (formerly First Bank System) has also pursued banking lines other than small business loans in recent years. Most of its profits have come from retail opera-tions, but its business-banking unit has also been an important contributor towards the bottom line. Rather than make small business loans, however, U.S. Bancorp has chosen to focus on middle market companies.
Other large, out-of-state banking organizations are targeting the small business mar-ket. Their approach is different from that of community banks, most of whom have not pursued automation for approving and servicing loans, and, instead, have empha-sized personal relationship banking. Larger banking organizations have embraced credit scoring and the use of technology in the delivery of lending services.2 The extent to which these banks use credit scoring varies. KeyCorp, which is headquartered in Cleveland, was Colorado’s fourth largest small business lender in 1996. It uses credit scoring for loans under $50,000 and simplifies the process by using a one-page appli-cation, but offers these loans through local branches. KeyCorp views community banks as its prime competitor for small business loans, and so attempts to maintain personal contact with borrowers through an extensive network of small business managers. It has achieved a measure of success with this approach, having been the only large banking organization in Colorado to be recently designated a “small busi-ness friendly” bank by the Small Busibusi-ness Administration.
Box 2: Strategies for the Small Business Lending Market
1As of June 1996, the ratio of small business loans to assets was 1.77 percent for FirstBank Holding Company of Colorado and 2.12 percent for U.S. Bancorp (see Table 4). By comparison, the ratio for KeyCorp was 10.08 percent, which was the highest among the six largest banking organizations in Colorado.
2A recent survey indicated that 70 percent of banks with assets of $500 million or less had no plans of using credit scoring, 55 percent of banks with assets in excess of $5 billion indicated that they planned on installing credit scoring systems in the next two years. See John Racine, “Community Banks Reject Credit Scoring for the Human Rouch,”American Banker,May 22, 1995, p.12.
By contrast, Wells Fargo has embraced automation for under-$100,000 loans to small businesses. Wells delivers these loans nationally through centralized processing and servicing operations. Products are standardized, and potential customers are solicited on a pre-approved basis. Approval decisions rely heavily on credit scores. These scores are assigned using privately developed software that exploits Wells’ small business database. Wells Fargo uses its branches to market small business loans over
$100,000. For these loans, Wells does not use credit scores, but instead compares the small businesses’ financial position against a benchmark of businesses in similar industries. The process not only assigns a risk rating for the small business, but also suggests banking products appropriate to the business. Wells Fargo is not currently a significant lender to Colorado small businesses in part because its recent entry into the Colorado market was through a bank that had not aggressively pursued small business lending. This will likely change in the near future, as Wells has recently announced plans to open five specialized business banking centers and 50 retail loca-tions through Colorado supermarkets.
Many of the strategies that we are observing in Colorado are similar to those observed nationwide. Larger institutions are using credit scoring and a higher level of technol-ogy in the delivery of lending services to small businesses, while smaller community banks have opted for more traditional approaches. The results appear to be driven more by strategy and size than by location of ownership. For Colorado, the level of small business lending by large banks has been relatively stable because a scaling back of lending at some banks has offset expansion of lending at other large banks. Overall, the strategy of smaller banks has enabled them to gain market share during the 1994 to 1996 period. But as the larger banks with a commitment to small busi-ness lending continue to develop this busibusi-ness, smaller banks will face an even more competitive market.
Sources
John H. Milligan, “Getting It Done in Minneapolis,”Institutional Investor, October 1992, pp. 143-6.
John Racine, “Community Banks Reject Credit Scoring For the Human Touch,”American Banker, May 22, 1995, p. 12.
Sam Zuckerman, “Taking Small Business Competition Nationwide,”US Banker, August 1996, pp. 24-28.
Diane Mastrull, “Latest Trend In Banking: Big Boys Caring About Little Guys,”Philadelphia
Busi-ness Journal, December 2, 1996.
Aldo Svaldi, “Banking’s Middle Class, “The Denver Business Journal, December 9, 1996. John W. Milligan, “Making First Bank Work,”US Banker, March 1997, pp. 33-42, 89.
Aldo Svaldi, “Colorado’s Friendliest Small-Biz Banks,”The Denver Business Journal, August 4, 1997.
Aldo Svaldi, “Wells Fargo Plans Bold Expansion,”The Denver Business Journal, August 4, 1997.
all sizes. It is most surprising to find that, in the under-$100,000 loan category, out-of-state organizations had a decrease of 1 percent while in-state organizations had an increase of 16.2 percent. Large, out-of-state organizations decreased their lending in this category by 9.3 percent, while small, in-state banking organizations had a 25.0 percent increase.
Of the three loan size categories, Table 5 shows that while out-of-state organizations were particularly aggressive in the $100,000-to-$250,000-loan category, most of the increased lending for this category was from in-state organizations. For the $250,000-to-$1,000,000 loan category, in-state lenders were par-ticularly aggressive, with these loans rising by 67 percent.
The recent lending pattern has raised the proportion of small business loans that banks have allocated to the larger loan categories. For example, of the total amount that in-state organiza-tions lent to small businesses in 1994, 23 percent was in the $250,000-to-$1,000,000-loan category, while the figure for 1996 was 29 percent.14There was a corresponding decrease in loans allocated to the under-$100,000-loan category by in-state organizations, from 60 percent in 1994 to 52 percent in 1996. In spite of this reallocation, Table 5 shows that, for 1996, in-state organizations remained the primary source for loans under $100,000. For Colorado banks, then, recent trends in the under-$100,000-loan category of small business loans have not followed that seen in the far west-ern part of the U.S. However, it is
Journal of Lending and Credit Risk Management78 (December 1996): 16-24. Credit scoring as part of a small business lending strategy is discussed in Side Box 2 on page 26. 12Sam Zuckerman, “Taking Small Business Competition Nationwide,”US Banker106 (August 1996): 24-28+. 13Mark Levonian, “Changes in Small Business Lending in the West,” Federal Reserve Bank of San FranciscoWeekly Letter(January 24, 1997). 14The in-state organizations lent $.854 billion to small businesses in 1994 (Table 2), and of this,
Small business loans by size of loan: Colorado banking organizations, 1994 and 1996 Table 5
Type of banking organization
Loans less than $100,000 Loans $100,000 to $250,000 Loans $250,000 to $1,000,000
Value ($ millions) Percentagechange, 1994 to
1996
Value ($ millions) Percentagechange, 1994 to
1996
Value ($ millions) Percentagechange, 1994 to 1996 Headquarters Size* 1994 1996 1994 1996 1994 1996 In-state Small 404 506 25.0 106 165 55.8 161 250 55.2 Medium 82 63 -22.8 30 38 28.2 22 67 206.5 Large 26 27 1.2 11 11 7.3 12 9 -27.7 All in-state 512 595 16.2 147 215 46.6 195 326 67.0 Out-of-state Small 30 40 36.4 17 17 -.5 38 54 41.8 Medium 33 48 45.2 18 20 10.8 42 45 6.3 Large 314 285 -9.3 173 193 11.0 338 330 -2.3 All out-of-state 377 373 -1.0 208 229 10.0 418 429 2.6 All banks 889 968 8.9 355 444 25.2 613 755 23.1
likely that in-state banking organiza-tions will face stiff competitive pres-sure as larger banking organizations continue to aggressively market low-cost methods for making busi-ness loans under $100,000. This could also change the characteristics of loans at in-state organizations, as borrowers with established credit records migrate towards large bank-ing organizations, thus leavbank-ing smaller banks with a pool of borrow-ers that have less established credit records.15
Changes to the small business lending market
Call report data reveal significant changes to small business lending by Colorado banks. At the same time, other elements of the small business lending market have changed. On the supply side of the market, growth of nonbank competitors has been very dramatic. On the demand side of the market, growth of service-oriented firms has reduced the need for some traditional forms of credit. Call report data will not capture these changes, and in this section, we review some new features of small business lend-ing, and consider their broad impli-cations regarding the evolution of bank lending to small business. While banks still dominate the small business lending market, they lost market share of outstanding loans over the period from 1987 to 1993. A recent study found that, for the U.S. in 1993, banks held 61.3 percent of small business loans, but this was a 2 percent decline from their 1987 share.16By contrast, finance compa-nies, brokerage firms and leasing companies increased their nationwide share of small business lending by 6.3 percent. Moreover, the decline in the portion of small businesses that use banks as a source of credit is
more dramatic. From 1987 to 1993 the incidence of small businesses using bank credit services declined by 7.2 percent, while that for nonbank institutions remained flat, implying a relative increase in the use of alterna-tives to banks as sources of finance.17 Other data also suggest that the growth in nonbank competition is particularly strong in Colorado. For example, reports show Colorado employment in nondepository credit institutions grew at a rate of 11.1 percent in 1996, while employment in banks grew by only 1.6 percent.18 Additionally, the Small Business Administration reported that non-depository credit institutions in Colo-rado were the fastest growing small business category from 1993 to 1994, experiencing a 26.5 percent increase.19 Rapid growth of nonbank sources of finance suggests that access to small business credit may have increased even more than is indicated by bank lending data. This nonbank competi-tion also affects how we interpret the relative growth of large and small bank lending. Studies have shown that banks in urban locations were subject to greater competition for small business lending than were banks located in rural areas. Urban banks saw their market share of small business lending decline by 3 percent nationwide from 1987 to 1993, while rural banks gained 2.9 percent.20This suggests that larger banks, which tend to operate in urban areas, have likely faced greater competition from nonbank providers of finance. As a result, the slower growth of small business lending in the larger, more urban Colorado banks may be related to greater competition and loss in market share to nonbanks.
Another complication is the larger banking organizations that provide
$195 million was in the $250,000-to-$1,000,000-loan category (Table 5), so these banks allocated to this category 23 percent ($195/$854) of their small business loans. Similar calculations lead to the other percentages in this paragraph. For comparison, in the $250,000-to-$1,000,000-loan category, the share in 1994 and in 1996 for out-of-state
organizations was 42 percent.
15Borrowers may have less established credit records, but smaller banks could control credit risk by exploiting information available through close contact between the bank and the borrower.
16Cole, Wolken, and Woodburn, “Bank and Nonbank Competition for Small Business Credit,” p. 991. 17Cole, Wolken, and Woodburn, “Bank and Nonbank Competition for Small Business Credit,” p. 992. 18Colorado Department of Labor and Employment, “Colorado in 1996,” Internet Website Page http://governor.state. co.us/gov_dir/labor_dir /lmi/market_pubs_le. html (February 1998). 19Office of Advocacy, “Small Business: Backbone of the Colorado Economy,” Small Business Administration, Internet Web Page www.sba.gov/advo/ stats/profiles/97co. html (December 1997). 20Cole, Wolken, and Woodburn. “Bank and Nonbank Competition for Small Business Credit,” p. 991.
financing through nonbank subsidi-aries. Many of the larger banking organizations in Colorado have non-banking subsidiaries that offer financing to small businesses. One large organization in Colorado esti-mates that such activity makes up about 5 percent of total small busi-ness lending. As a result, call report data will understate the amount of small business lending by large banking organizations.21
As indicated earlier in this paper, small business growth has been dra-matic both nationwide and in Colo-rado, which implies a parallel growth in demand for loans. However, a few trends may dampen demand for tra-ditional loans. For example, the larg-est growth in small businesses has been in the service sector. Between 1992 and 1996, Colorado experi-enced rapid growth in the service sector, with most of the growth com-ing from very small businesses. Serv-ice firms were the fastest growing category of small businesses for all firms employing fewer than 100 employees, and in the 1-4 employee category, over 82,000 service firms were created.22By contrast, the slow-est growth in the small business sec-tor was in manufacturing.
With this change in the make up of the small business sector comes a change in the demand for finance. First, service firms typically require smaller amounts of financing than do capital intensive manufacturing firms. Second, service firms will not have extensive inventory with which they could secure a loan, and there-fore may use credit secured by accounts receivable or unsecured credit. Indeed, many small business owners are using personal credit card lines and leasing as a substitute for traditional business loans.
One study reports that nearly 40 cent of surveyed firms had used per-sonal credit card debt as a substitute source of credit.23Another study reports significant growth in the use of credit card debt and leases by small businesses: in 1997, 34 percent of survey respondents indicated that they used credit cards as a source of
finance, up from 17 percent four years earlier.24Similarly, 16 percent of sur-vey respondents indicated that they used leases as a source of finance, up from 8 percent four years earlier.25 Since larger banks dominate the mar-ket for credit cards and leases, larger banks are likely providing significant amounts of this type of financing to small businesses.
To summarize, the market for small business lending has changed in recent years. Some of these changes, such as lending by nonbank subsidi-aries of banking organizations and increasing use of credit cards, would suggest that we have understated the amount of large bank lending to small businesses. Other changes, such as greater nonbank competition for small business finance, and changes in the financing needs of small business, point to added challenges that banks must face to be successful in this market.
Conclusion
The market for small business loans in Colorado has undergone significant change. Our main finding is that, between 1994 and 1996, small busi-ness lending by small to medium size banking organizations grew much faster than lending by large organiza-tions. Banks who were part of in-state organizations expanded their share of lending to small businesses from 46.0 percent to 52.4 percent. The increased market share was not necessarily due to their in-state status, but rather due 21These changes also
mean that we may have misstated the growth of small business lending by large banking
organizations, but since the amount of lending by subsidiaries is relatively small, the degree of misstatement is likely to be small. 22Office of Advocacy, “Small Business: Backbone of the Colorado Economy.” 23Cole, Wolken, and Woodburn. “Bank and Nonbank Competition for Small Business Credit,” p. 990. 24Arthur Andersen Enterprise Group and National Small Business United,
Survey of Small and MidSized Business -Trends for 1997. (Chicago IL: Arthur Andersen, 1997), p. 39. 25Arthur Andersen Enterprise Group and National Small Business United,
Survey of Small and MidSized Business -Trends for 1997, p. 39, and Arthur Andersen Enterprise Group and National Small Business United,
Survey of Small and MidSized Business -Trends for 1993.
(Chicago IL: Arthur Andersen, 1993), p. 9.
to the fact that much of small busi-ness lending by banks came from small and medium size banks, and in-state banking organizations in Colorado are primarily small and medium size. Small and medium size, out-of-state banking organizations also expanded their market share. Large banking organizations, both in-and out-of-state, lost market share in small business loans. Yet in 1996 they still provided close to 40 percent of small business loans made by banks, and so were still important providers of credit to small busi-nesses. Moreover, several large bank-ing organizations significantly
expanded their small business lend-ing. In addition, out-of-state banking organizations were actively serving borrowers in other markets, such as real estate, consumer lending, large loans for commercial and industrial borrowers, and lease financing. By 1994 bank consolidation and out-of-state participation in banking were well established in Colorado. As a result, the shifts we observe in small business lending are most likely due to the longer run effects of bank con-solidation. The large increase in small business lending by small and
medium banking organizations is a particularly striking example of responding to the opportunities cre-ated by consolidation. Small business borrowers may have faced some shifts in financing sources, but given the overall increase in loans, it appears that their credit needs were ade-quately met.
In spite of recent trends, it is uncer-tain whether small business lending in Colorado will continue to migrate towards small and medium size banks. First, we have not investigated how the business cycle might influ-ence small business lending patterns,
and so we cannot say whether the observed trends are unique to this period. Second, some large banking organizations are developing loan products that target small business, and the Colorado market has yet to see the impact of these products. Additionally, we have seen that non-bank providers of small business finance are making inroads to the market. These developments will con-tinue to pose significant challenges to small and medium size banks and others providing finance to Colorado’s small businesses.
Data on small business lending used in this article come from the second quarter call reports filed by commercial banks. Beginning in 1993, call reports have had a section for banks to report the number and total value of loans they make with a small original loan amount.1 This article examines the small commercial and industrial loans reported in this section because such loans provide insight into the small business lending mar-ket.2Not all of these smaller loans are necessarily made to small businesses. However, other studies have shown that the size of a business is correlated with the size of bank borrowing, and the vast majority of small commercial and industrial loans from call reports are likely made to small businesses.
Data for this study are based on the consolidated banking organization, with the loans and assets for all of the banks in an organization combined together. A handful of banks was acquired during the sample period, and their assets were con-solidated into that of the acquiring organizations for 1994 in order to allow for the same combined entity to be followed throughout the period.
Banking organizations were designated as either in- or out-of-state based on the location of their headquarters in June 1996. Thus, an in-state bank that was acquired by an out-of-state organization would be designated as part of an out-of-state organization for the entire sample period.
The small business loan data in call reports may not necessarily reflect all of the activity of an interstate organization for a par-ticular state in which it operates. A loan to a borrower in Colo-rado may be reported on the books of a bank that is chartered in California, or a loan to a borrower in Wyoming may be reported on the books of a Colorado bank. To the extent that this practice occurs, it would be most important for out-of-state organiza-tions, and so this study may misstate their small business lend-ing activity in Colorado. However, small business loans often require a relatively high degree of monitoring and oversight, which is done most effectively in close proximity to the borrower. 1Banks report the total of the original value and the number of loans made in each of three size categories: (1) under $100,000; (2) $100,000 to $250,000; and (3) $250,000 to $1,000,000.
2Banks also report small loans for commercial real estate and for agriculture. We do not analyze these data because they are beyond the scope of this project.
Thus, we would expect to see most small business loans placed on the books of banks close to the borrower.
Although the data were first collected in 1993, the analysis is limited to data for the years 1994 and 1996. Data for 1993 and 1995 are excluded because of data errors. Previous research has shown that banks made significant errors in reporting these items on the 1993 call report, possibly due to ambiguity in the call report instructions. A clerical error caused one banking organization to misreport the small business loan data for 1995. The organization has a large presence in Colorado, and this error meant that overall bank lending to small businesses was understated by approximately 6 percent. The organization was unable to provide the correct data, and rather than use an esti-mate, we excluded 1995. Finally, data for 1997 are excluded because a number of Colorado banks were converted to
branches of out-of-state banks under the new interstate branch-ing authority and these offices no longer file separate call
reports.