Moisés Hernández Morales1, J. Tinguaro Rodríguez2, Javier Montero2 1Afi Analytics,
Analistas Financieros Internacionales, Spain [email protected]
2Department of Statistics and Operations Research, Complutense University of Madrid,Spain
{jtrodrig,javier_montero}@mat.ucm.es
Abstract. This article is devoted to the replication of the internal methodologies of credit rating agencies for rating classification using fuzzy algorithms. To achieve this goal, the usage of different types of fuzzy algorithms (evolutionary and non-evolutionary fuzzy rule learning for classification) is explored, depart-ing from historical data on credit ratdepart-ings (ratdepart-ings) and fourteen financial ratios used as explanatory variables. This study is a preliminary work focused on pre-senting the problem and the methodology used in order to lay the foundation for further improvement work.
Keywords. Credit rating, Corporate rating, Fuzzy algorithms, Fuzzy classifica-tion
1
Introduction
A rating is a classification that expresses the independent views of the credit risks related to financial obligations of a company. It reflects both the probability of default and any financial loss suffered in the event of default. It is represented by the i-th rating class ωj∈ Ω, Ω = {AAA, AA, ..., D}, where Ω is a rating scale. Based on the above, credit rating modelling is considered to be a classification problem with the aim of classifying objects (as companies, assets, etc.) into rating classes ωj∈ Ω.
The methodology for calculating the various agencies’ ratings are (not public) in-ternal models that use both accounting information published periodically by compa-nies (quantitative information that is public but potentially susceptible to manipula-tion) and qualitative information that includes biased by criteria the analyst because the analysis depends on your point of view (e.g., president of the company, risks of nationalization, profit / loss of contracts, etc.).
Rating agencies are responsible for issuing and producing ratings and reviews for all contingencies in the financial community. These allow standardize the views of financial market products. The credit rating process carried out by international agen-cies has benefits for both the investor and entities.
Credit rating models have a long history in empirical finance and have been shown to be superior to subjective assessments of credit quality. Approaches for such prob-lem include statistical and soft-computing methods.
Mainly used statistical models are discriminant analysis [1], [4], multi-logit [19], neural networks [2], and, more recently, support vector machines [25]. In this wide range of approaches, multi-logit models have become the prevalent methodology for academics and practitioners to classify credit rating. However, high classification accuracy has been achieved especially by neural networks and support vector ma-chines. This is because they allow modelling complex non-linear relations and can be applied for unknown input data or raw data. The disadvantage of neural network and machine vector support lies in the fact that they are usually designed as so-called “black boxes”, i.e. it is difficult to extract understandable knowledge from them.
Soft Computing methods begin to be more important in the field of credit rating because many of the factors intervening in credit rating do not necessarily correspond with precise descriptions of reality. Therefore, using both precise and imprecise fi-nancial variables will be a critical step in the credit rating process, determining those variables that don’t belong to a precise description of reality but are extracted from natural language. Fuzzy logic is a natural approach to address this problem, since it allows modelling the meaning of words and natural languages.
In the late 90s began the study in the field of Soft Computing with the aim of ana-lyzing the factors that influence the process of assigning ratings of both private and public sectors. Different types of models have been used: neural networks (NNs) [5], [19], [20], [11] fuzzy systems[2], [11], evolutionary algorithms [6], artificial immune systems [8], [22], hybrid systems [20], and support vector machines (SVMs) [15], [23]. More recent works with major contribution in the field of credit rating with fuzzy methods belong to Brennan and Brabazon [5] and Hayek [11], [12], which have shown that:
Process modeling classification of credit ratings is a complex task that requires a prior selection process of the explanatory variables. This substantially improves the accuracy of the classification of credit ratings.
The methodologies of the rating agencies vary according to the economic sector. Best results are obtained when the diffuse sectoral classification is made against (total of private companies) study added.
The objective of this work is to apply classifiers based on fuzzy logic in order to replicate the internal rating methodologies used by major ratings agencies when quali-fying the different private companies. Therefore, it is a preliminary work focused on presenting the problem of credit rating using fuzzy classification methods that have not yet been used in similar studies.
The remainder of this paper is organized as follows: In Section 2 the dataset is de-scribed. Section 3 gives an overview of fuzzy classification models. In Section 4, the results of different fuzzy methods are shown. Finally, in Section 5 some concluding remarks are shed.
2
Data source
The system of internal rating of the main rating agencies is a quantitative proce-dure that assigns a score based on the behavior of a set of accounting variables (finan-cial statements). However, they are adjusted by incorporating qualitative information. Therefore, the inputs of the internal model are:
Analysis of financial ratios: Ratios of economic and financial situation (quantita-tive information).
Risk analysis by sector, country and size among other (qualitative information). In this study, only quantitative data is to be used as input (economic and financial ratios). Usually, the defined ratios between economic and financial variables are cate-gorized by families whose name is determined by the main purpose of the analytical ratios they integrate. Thus, there is nowadays economic, financial, operational and growth ratios, among others. These are defined in Appendix 1.
The database used in this study was constructed by the first author from the histori-cal information of corporate ratings supplied by leading market data providers. The steps followed for its elaboration were:
1. Selecting the universe of companies for which a search of the rating history will be held. Specifically, the database will be formed by companies belonging to the STOXX Europe 600 Stock Index, Standard & Poor's 500 and IBEX-35.
2. Downloading historical information of rating changes for the period between Janu-ary 2000 and December 2013. The information source is Bloomberg (http://www.bloomberg.com). Historical ratings pertain only to the main rat-ing agencies (S&P, Moody's and Fitch) and the type of ratrat-ing used is the long-term issuer rating in local currency. The historical frequency of ratings is irregular since a historical figure corresponds to a change in rating by any of the agencies.
3. Those historical records rating that correspond to additions of negative or positive outlook (watch list) are eliminated. For example, a company is in the watch list when the agency announced an improvement or deterioration in its current credit rating.
4. Accounting information is downloaded and the construction of economic and fi-nancial ratios explained in Appendix 1 is performed. The historical frequency is annual. The data provider from which this information is downloaded is FactSet (http://www.factset.com)
5. Historical information from Bloomberg ratings is crossed with the historical finan-cial ratios constructed from the accounting data supplied by FactSet.
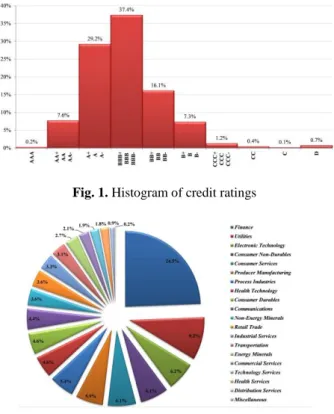
6. As a final step, an aggregation of the original rating categories is made. In particu-lar, we reduced from 22 to 10 the categories of the response variable (ratings). Therefore, as a consequence of the previous steps, the resulting database consists of 2276 records of 1106 private companies from 20 different economic sectors. The response variable (rating) has 10 classes and there are 14 explanatory variables corre-sponding to economic and financial ratios: EBITDA margin, net margin, asset
rota-tion, ROA (return of asset), average collection period for customers, average payment period for suppliers, inventory turnover, liquidity, solvency, debt, debt coverage, cov-erage of financial expenses, net cash flows (NCF) / EBITDA and investment needs.
Particularly, the histogram of the distribution of ratings and the pie chart of com-panies by economic sector are as follows:
Fig. 1. Histogram of credit ratings
Fig. 2. Percentage of companies by economic sector
3
Fuzzy classification models
Four fuzzy classification models are examined empirically in order to classify the credit quality of private companies. For the first time we will proceed to study in depth the credit rating from a fuzzy logic-based approach, using 5 fuzzy classification algorithms (evolutionary or not). We present next the features of these methods. 3.1 Fuzzy rule learning for classification
Fuzzy Rule Learning Model following the Chi et al. approach with rule weights (Chi-RW)
This method was proposed in [7] by Z. Chi, H. Yan, and T. Pham, extending Wang and Mendel’s method [27] for tackling classification problems. Basically, the
algo-rithm is quite similar to Wang and Mendel’s technique. However, since it is based on the FRBCS model, Chi’s method only takes class labels on each data to be consequent parts of fuzzy IF-THEN rules. In other words, rules are generated as in Wang and Mendel’s technique (WM) and then the consequent parts are replaced with their clas-ses. Regarding calculating degrees of each rule, they are determined by antecedent parts of the rules. Redundant rules can be deleted by considering their degrees. Lastly, fuzzy IF-THEN rules are obtained.
Fuzzy Unordered Rule Induction Algorithm (FURIA)
FURIA [16] builds upon the RIPPER algorithm. A first modification of RIPPER concerns the type of rule model that is learned and, related to this, the use of default rules. Learning a decision list and using one class as a default prediction has some disadvantages. In particular, it comes along with a systematic bias in favor of the default class. To avoid this problem, an unordered version of RIPPER’s predecessor IREP is proposed. Likewise, it is proposed to learn a rule set for every single class, using a one-vs-rest decomposition. Consequently, FURIA learns to separate each class from all other classes, which means that no default rule is used and the order of the classes is irrelevant.
When using an unordered rule set without default rule, two problems can occur in connection with the classification of a new query instance: First, a conflict may occur since the instance is equally well covered by rules from different classes. This prob-lem is rather unlikely to occur and, in case it still does, can easily be resolved. Sec-ond, it may happen that the query is not covered by any rule. To solve this problem, a novel rule stretching method was proposed in [16]. The idea is to modify the rules in a local way so as to make them applicable to the query.
The RIPPER algorithm can be divided into the building and the optimization phase. The rule building is done via the IREP algorithm, which essentially consists of a propositional FOIL algorithm, the pruning strategy and the stopping conditions. Interestingly, the pruning strategies in IREP have a negative influence on the perfor-mance of FURIA. Therefore, the pruning step was omitted and instead the initial ruleset was learned on the whole training data directly. To explain this, note that, without pruning, IREP produces more specific rules that better fit the data. More im-portantly, small rules provide a better starting point for the fuzzification procedure in which rules can be made more general but not more specific.
In the optimization phase, the pruning was retained, as its deactivation was not beneficial. This is in agreement with the goal to minimize the MDL. The coverage of the remaining positive instances, which is again accomplished by IREP, also benefit-ed from omitting the pruning, just like IREP in the building phase.
FURIA still applies pruning when it comes to creating the replacement and the re-vision rule. Here, the original pruning strategy is applied, except in case the pruning strategy tries to remove all antecedents from a rule, thereby generating a default rule. In this case, the pruning will be aborted, and the unpruned rule will be used for the MDL comparison in the optimization phase. It was found that those pruning strategies are still sufficient to avoid overfitting. Thus, the removal of the pruning in the IREP part has no negative impact on classification accuracy.
3.2 Evolutionary fuzzy rule learning for classification
Fuzzy rule approach based on a genetic cooperative-competitive learning (GFS-GCCL)
This method is based on Ishibuchi’s approach [17]. In this method, a chromosome describes each linguistic IF-THEN rule using integer as its representation of the ante-cedent part. In the consequent part of the fuzzy rules, the heuristic method is applied to automatically generate the class. The evaluation is calculated for each rule which means that the performance is not based on the entire rule set. The outline of the method is as follows.
Step 1: Generate an initial population of fuzzy IF-THEN rules.
Step 2: Evaluate each fuzzy IF-THEN rule in the current population.
Step 3: Generate new fuzzy IF-THEN rules by genetic operators.
Step 4: Replace a part of the current population with the newly generated rules.
Step 5: Terminate the algorithm if a stopping condition is satisfied, otherwise re-turn to Step 2.
Additionally, to handle high dimensional data, this method uses "don’t care" attributes on the antecedent fuzzy set.
Fuzzy Hybrid Genetics-Based Machine Learning (FH-GBML)
This method is based on Ishibuchi’s approach [18] using the hybridization of GCCL and the Pittsburgh approach for genetic fuzzy systems. The algorithm of this method is as follows:
Step 1: Generate population,each individual in the population is a fuzzy rule set.
Step 2: Calculate the fitness value of each rule set in the current population.
Step 3: Generate new rule sets by the selection, crossover, and mutation in the same manner as the Pittsburgh-style algorithm. Then, apply iterations of the GCCL to each of the generated rule sets with a probability.
Step 4: Add the best rule set in the current population to newly generated rule sets to form the next population.
Step 5: Return to Step 2 if the pre-specified stopping condition is not satisfied.
New SLAVE (Structural Learning Algorithm in a Vague Environment) (NSLV) This method was proposed in A. Gonzalez and R. Perez’s papers [9,10], which is applied for classification problems. SLAVE is based on the iterative rule learning approach which means that we get only one fuzzy rule in each execution of the genet-ic algorithm. In order to eliminate the irrelevant variables in a rule, SLAVE has a structure composed of two parts: the first part is to represent the relevance of varia-bles and the second one is to define values of the parameters. The following steps are conducted in order to obtain fuzzy rules:
Step 2: Collect the rule into the final set of rules.
Step 3: Check and penalize this rule.
Step 4: If the stopping criteria is satisfied, the system returns the set of rules as solution. Otherwise, back to Step 1.
This method uses binary codes as representation of the population and applies the basic genetic operators, i.e., selection, crossover, and mutation on it. And, the best rule is obtained by calculating the degree of consistency and completeness.
4
Experimental results
In the following table, the accuracy rates of the different classification algorithms on the ratings dataset are shown. It can be seen that the best results are obtained with the algorithm FH-GBML, however the results of FURIA and GFS-GCCL are very close (over 37%).
The algorithms with the worst behavior in solving this problem are the NSLV fol-lowed by the Chi-RW. In all algorithms, except NSLV, a better outcome than that that would result from a random model (10%) is achieved. Whereas this study is a first approach to the problem, it can be considered that the results are satisfactory based on such initial conditions, but clearly they can be improved.
Model Accuracy rate
Chi-RW 16.5%
FH-GBML 38.7%
FURIA 38.4%
GFS-GCCL 37.3%
NSLV 6.7%
Fig. 3. Accuracy rates
5
Conclusions
The most important conclusions drawn from the study of fuzzy classification for corporate credit rating are:
Classification of credit ratings is a complex task that requires a previous process of selection of the explanatory variables. Within this process is not only important to consider the analyst criteria but also a process to justify the discriminatory power of the variables. In this work, a database was constructed with fundamental ac-counting ratios, in order to maintain the simplicity of the final model. Probably, if we had increased the number of ratios we would have achieved a substantially im-proved accuracy in the classification of credit ratings.
The study that has been done is at the level of the whole economy, and this is a disadvantage because the internal methodology of credit rating agency rating varies
depending on the sector. This aspect makes sense because each sector has its own characteristics and in many cases a very different nature. Best results would be ex-pected by adding or considering sectoral level classification.
Of the 5 models applied, 3 have provided a rate of accuracy higher than 37%, but less than 40%. In order to improve the results obtained, there is a wide range of lines of future work to be considered:
─ Improved database: 1) extension of the initial set of explanatory variables in-cluding new types of financial ratios and other variables (e.g. market variables such as credit default swaps, Itraxx, etc); 2) incorporation of the economic sec-tor; 3) modeling the time dependence of the explanatory variables.
─ Development of error / success measurements more adapted to the structure of the set of classes.
─ Improved classification power by ensembles, bipolar representation and ordinal regression.
6
Appendix 1
The large number of ratios that can be calculated on financial statements makes possible to establish different classifications of the same, according to different criteria:
Economic or profitability ratios: Aimed at determining the economic position.
Financial Ratios: These ratios calculated on the balance sheet of the company and are aimed at determining the financial position.
Operating Ratios: Associated with the analysis of the functioning of the company, which is reflected through the current assets and liabilities.
Ratios of growth and expansion: Related to the growth and its impact on economic and financial position.
Ratios of operations: Linking analysis with the general progress of operations relating to economic and financial operational variables.
Despite the existence of a wide range of ratios, this paper will use only the most important to establish a credit rating. Specifically, we use two types of ratios: economic and financial ratios.
1.Economic ratios:
(a) EBITDA margin: Indicator obtained by finding the relationship between the EBITDA obtained (Earnings before interest, taxes, depreciation and amortization) and operating income thrown in the income statement.
(b) Net margin: Percentage which expresses how many net profit monetary units are ob-tained per 100 currency units of sales during the period.
(c) Asset rotation: Indicates the number of unit sales of assets used by the company. It is expressed as the number of times per year that takes place such rotation.
(d) ROA (Return of Asset): Measures the return on assets, i.e. the profitability or business. It depends on the economic sector in which the company operates.
(e) Average collection period for customers: It is an approximation of what the company takes to charge their customers. It is expressed in number of days.
(f) Average payment period for suppliers: It is an approximation of what the company takes to pay its suppliers. It is expressed in number of days.
(g) Inventory Turnover: Measure the stock rotation. It is expressed as the number of times per year that such rotation is carried out.
2.Financial ratios:
(a) Liquidity: It allows you to check whether current assets do not exceed the current liabil-ities. If its value is less than 1, the flows available to the company's assets would not be sufficient to settle its current liabilities.
(b) Solvency: Percentage of equity of the company relative to total assets of the same. (c) Debt: Percentage of leverage or indebtedness of the company. It shows the relationship
between the volume of debt and equity.
(d) Debt coverage: Measures weight of net debt to EBITDA. Number of years that would be required for full repayment of net debt should be earmarked for this wing all the gen-erated gross proceeds.
(e) Coverage of financial expenses: It measures the ability to cover interest expenses on outstanding debt of the company. It indicates the number of times that the company could face financial expenses with the EBITDA generated.
(f) Net cash flows (NCF) / EBITDA: It expresses the convertibility of EBITDA in cash. (g) Investment needs: It expresses the percentage of investments made by the company
during the year compared to the figure of income
References
1. Altman EI (1968) Financial ratios, discriminant analysis, and the prediction of corporate bankruptcy. J Finance 23(4):589–609
2. Ammar S, Duncombe W, Hou Y (2001) Using fuzzy rule-based systems to evaluate over-all financial performance of governments: an enhancement to the bond rating process, Pub-lic Budgeting and Finance 21 (4) 91–110.
3. Atiya AF (2001) Bankruptcy prediction for credit risk using neural networks: a survey and new results. IEEE Trans Neural Netw 12(4):929–35
4. Beaver WH (1966) Financial ratios as predictors of failure. J Acc Res 4:71–102.
5. Brennan D, Brabazon A (2004) Corporate Bond Rating using Neural Networks, Proc. Of the Conf. on Artificial Intelligence, CSREA Press, Las Vegas, USA.
6. Brabazon A, O'Neill M, Matthews R, Ryan C (2002) Grammatical Evolution and Corpo-rate Failure Prediction, Proc. Genetic and Evolutionary Computation Conf, Morgan Kauf-mann, New York.
7. Chi Z, Yan H, Pham T (1996) Fuzzy Algorithms: With Applications To Image Processing and Pattern Recognition. World Scientific.
8. Delahunty A, O'Callaghan D (2004) Artificial Immune Systems for the Prediction of Cor-porate Failure and Classification of CorCor-porate Bond Ratings, University College Dublin, Dublin, http://mis.ucd.ie/research/theses/Delahunty-OCallaghan.pdf.
9. Garcia D, González S, Pérez R (2014) Overview of the SLAVE learning algorithm: A re-view of its evolution and prospects. International Journal of Computational Intelligence Systems 7:6 0-1221.
10. González A, Perez R (2009) Improving the genetic algorithm of SLAVE. Mathware and Soft Computing 16 59-70.
11. Hajek P (2011) Municipal credit rating modelling by neural networks. Decis Support Syst 51(1): 108–118.
12. Hajek P (2012) Credit rating analysis using adaptive fuzzy rule-based systems: an indus-try-specific approach. Central European Journal of Operations Research,Volume 20, Issue 3, pp 421-434.
13. Hajek P (2015), Adaptive Fuzzy Rule-Based Systems for Credit Rating Analysis, in: Proc. of the 28th Int. Conf. Mathematical Methods in Economics (Ceske Budejovice, Czech Re-public, in press).
14. Hajek P (2015), Probabilistic Neural Networks for Credit Rating Modelling, in: Proc. of the Int. Conf. on Neural Computation (Valencia, Spain, in press).
15. Huang Z, Chen H, Hsu CJ, Chen WH, Wu S (2004) Credit rating analysis with support vector machines and neural networks: a market comparative study, Decision Support Sys-tems 37 (4) 543–558.
16. Hühn J, Hüllermeier E (2009) FURIA: an algorithm for unordered fuzzy rule induction. Data Mining and Knowledge Discovery 19:3 293-319.
17. Ishibuchi H, Nakashima T, Murata T (1999) Performance evaluation of fuzzy classifier systems for multidimensional pattern classification problems, IEEE Trans. on Systems, Man, and Cybernetics - Part B: Cybernetics, vol. 29. no. 5, pp 601-608.
18. Ishibuchi H, Yamamoto T, Nakashima T (2005) Hybridization of Fuzzy GBML Ap-proaches for Pattern Classification Problems. IEEE Transactions on Systems, Man and Cybernetics - Part B: Cybernetics 35:2 359-365.
19. Kim JW, Weisstroffer HR, Redmond RT (1993) Expert systems for bond rating: a com-parative analysis of statistical, Rule-based and Neural Network Systems, Expert Systems 10 (3) 167–172.
20. Kim KS, I. Han, (2001) The cluster-indexing method for case-based reasoning using self-organizing maps and learning vector quantization for bond rating cases, Expert Systems with Applications 21 (3) 147–156.
21. Kim KS (2005) Predicting bond ratings using publicly available information, Expert Sys-tems with Applications 29 (1) 75–81.
22. Kopacek L, Olej V (2010) Municipal creditworthiness modelling by artificial immune systems, Acta Electrotechnica et Informatica 10 (1) 3–11.
23. Lee YC (2007) Application of support vector machines to corporate credit rating predic-tion, Expert Systems with Applications 33 (1) 67–74.
24. Ohlson JA (1980) Financial ratios and the probabilistic prediction of bankruptcy. J Acc Res 18(1):109–131.
25. Trustorff J, Konrad PM, Leker J (2011) Credit risk prediction using support vector ma-chines. Rev Quant Finance Acc 36:565–81.
26. Van Leekwijck W, Kerre EE (1999) Defuzzification: criteria and classification, Fuzzy Sets and Systems, 108 (2), 159–178.
27. Wang LX, Mendel JM (1992) Generating fuzzy rule by learning from examples, IEEE Trans. Syst., Man, and Cybern., 22(6):1414-1427.