Is a visual worth more than a thousand words?
An investigation into brand engagement and social shopping on visual
social media
Dag Bennett bennetd@lsbu.ac.uk
London South Bank University
Christina Kunze christinakunze@hotmail.com
London South Bank University
ABSTRACT
Social media networking is now the most popular online activity worldwide and a large part of social media interaction involves sharing visual content on platforms such as Instagram and Pinterest. The phenomenal growth in numbers of users makes visual platforms enticing for marketers who spend ever-increasing time, effort and money on social media in the hope of generating consumer engagement for their brands.
This research investigates customer behaviour for the largest visual social media platform, Instagram. It looks at users’ behavioural engagement and links engagement to brand purchase decisions through a social shopping construct. In order to evaluate the potential marketing benefits of visual social media we compared brand-generated content with user-generated content in terms of brand engagement and its effect on social shopping. Engagement was measured in four different dimensions – cognitive, emotional, personal, and behavioural. Key issues in the use of visual social media are the credibility of the source content and the user’s willingness to be the recipient of marketing interventions This mixed-method approach revealed that user-generated content created by unfamiliar users such as bloggers is most effective in influencing purchase. Conversely and surprisingly, user-generated content from close social ties are least effective in inspiring purchase behaviour. The study highlights the importance for marketers of reaching key influencers with large followings in order to engender social shopping amongst visual social media users.
INTRODUCTION
Social media has come a long way since its inception in the 1990s and now claims over 2 billion users worldwide (Kemp, 2015). The proliferation of sites and communications technologies has created new opportunities for connectivity for both people and marketers. As a social phenomenon however, the importance or even relevance of social media to marketing has been questioned from the very beginning (Hucker, 2012).
Worldwide, the most popular online activity is Social networking, capturing 28% of all online time and averaging 1.7 hours per day (Globalwebindex, 2015). Over 82% of the world’s connected population are now reached by social networking (Hucker, 2012) and only 20% of internet users do not use at least one of the big four social networks Google+, Facebook, Twitter and LinkedIn (Mintel, 2013, Duggan & Smith, 2013)(figure 1).
Figure 1: Pew Research Center's Internet Project August Tracking Survey (Duggan & Smith, 2013)
As users increase their time spent on social media, they also increasingly overlap from one platform to another. A social media ecosphere is emerging where users have traditional relationships with friends or colleagues, but find new ways to relate to role-models, opinion leaders, and bloggers through ‘following,’ ‘permission granting,’ and signing up to ‘interest groups,’ or ‘feeds.’ These ‘relationships’ are typically two-way, and users can become very involved both in dialogue and with their own visual user-generated-content (UGC).
The Visual Web
Fast-growing visual social platforms such as Instagram, Vine, Tumblr and Pinterest will help shape the future of advertising (Warc Trends, 2013). Advances in technology have made the web much more visual-centric (Hemsley, 2012)—especially in social media, where even first generation networks such as Facebook and Twitter now offer new tools and site capabilities specifically designed for sharing images (Verma, 2013). More capable mobile devices, tablets and smartphones elicit more visual content and social networks have accelerated the trend by introducing simple ways and formats for sharing (Mintel, 2013). In the always-on omni-channel world, consumers rapidly swap channels and devices (Levitt, 2013) so that in both the marketplace and in shops, purchasing takes place in a melange of sharing with ever more participants (Burdett et al., 2013). Levitt (2013)
10
PEW RESEARCH CENTER
22 36 23 12 5 2
No sites One site Two sites Three
sites Foursites Five sites
Some 36% of internet users say that they use just one of the five social media sites specified in this report (Facebook, Twitter, Instagram, Pinterest, and LinkedIn), while 42% use two or more of these sites. The remaining 22% of
internet users have not adopted any of the five major platforms we asked about in our survey.
Among those internet users who only use one of these five major social networking platforms, 8% use LinkedIn, 4% use Pinterest, and 2% each say that
Instagram or Twitter is their sole social networking site. The remaining 84% say that Facebook is the one social
networking site they use.
Facebook is by far the most commonly-used social networking platform, and as a result, a significant majority of Twitter, Instagram, Pinterest, and LinkedIn users also use Facebook. At the low end, 83% of LinkedIn users also use Facebook. At the high end, 93% of Instagram users also use Facebook (Instagram’s parent company).
About a quarter of Facebook users use each of the other sites.
Turning to sites other than Facebook, a significant level of overlap exists between Instagram and Twitter users – 53% of Twitter users also use Instagram, and 53% of Instagram users also use Twitter. Among non-Facebook sites, this is the highest rate of “reciprocity” between user groups we measured.
Number of social media sites used
% of internet users who use the following number of social networking sites (sites measured include: Facebook, Twitter, Instagram, Pinterest, and LinkedIn)
Pew Research Center’s Internet Project August Tracking Survey, August 07 –September 16, 2013. N=1,445 internet users ages 18+. Interviews were conducted in English and Spanish and on landline and cell phones. The margin of error for results based on all internet users is +/- 2.9 percentage points.
describes social shopping as a link between social networking and online shopping where social media influences buying decisions.
Today’s marketers are experimenting in the online world to attract customers, build brand values, and to make sales. While many companies and brands have long used internet sites as company-managed information portals, many brands are now placing their brand content on other companies’ sites, including social networking sites.
Figure 2: Burberry brand presence on Pinterest
One of the most popular of the visual platforms is Pinterest, with over 200 million users (Pinterest, 2015). Burberry’s brand site on Pinterest (Figure 2) shows the links between advertising, catalogues, brand identity and social media. Each ‘board’ can be opened, and ‘pinned’ on a user’s personal site. Each pin also contains links back to Burberry.
Figure 3 Instagram user growth (BI Intelligence, 2015)
Instagram is a picture sharing social media platform launched in 2010 and bought by Facebook in 2012 that as of mid-2015 has over 300 million users (Instagramblog, 2015,
figure 3). When Hucker (2012) called Pinterest the fastest growing social media platform ever in 2012, he never expected Instagram to pass it in 2013.
By June of 2015, more than 2 billion photos had been posted on Instagram (Instagram Corporate report, 2015). Among these were many advertising images and Instagram claims their analytics show that such images can generate positive results in terms of reach, awareness and brand recall. Paid ads appear with a ‘sponsored’ label instead of a time stamp (Instagram Blog, 2014). Ads are intended to be creative and engaging and users are always given the option to hide ads they do not like, which serves as feedback for future ad targeting efforts (Instagram Blog, 2014).
Instagram is attractive to advertisers because it has a heavily Generation Y user base—90% of users are under 35 years old, 68% are women and 16% have household incomes over 75,000 USD. Many high-end brands now have Instagram presences, and by 2014 92% of prestige brands were on it (L2 Intelligence Report, 2014). Instagram courts brands by offering analytical services that help them track their pins, what is being shared, commented upon and so on. These services were started in 2015 and are similar to other companies’ offerings such as Google Analytics. They indicate the lengths to which social media will go to monetize the value of consumer networking for commercial interests.
Figure 4: Burberry brand presence on Instagram (Instagram, 2014)
The images in Figure 4 show Burberry’s Instagram regular account and a Burberry Live account that shares live images and videos from fashion shows and similar events. They are are more candid and casual and far less professional than those on Pinterest. This is partly because some of the content is user-generated, while some is made to look that way.
CONCEPTUAL FRAMEWORK
Social media is a hot marketing tool that may have great potential to influence consumer behaviour and move markets. On the other hand, measuring and assessing social media marketing effectiveness is still in its infancy and marketers and consumers differ on what social media is really for (Smith, 2013). Chung and Austria (2010) suggest that too little is known of how people perceive advertising and brand interaction on social media. While most users use social media for interpersonal connections and do not object to brands taking part (Mintel, 2013), many (30%) dislike overt brand intrusions (Smith, 2013).
Brand engagement research focused on Facebook may not extend to visual social media because of the different formats and operational concepts. Therefore an understanding of consumer behaviour on visual social media, Instagram for example, should begin with addressing whether engagement behaviour differs to that found in previous research. For example the finding that mostly heavy buyers engage with brands on Facebook (Nelson-Field, 2013) cannot be assumed to hold true for visual social media without further research, neither can motivations for engagement be generalised from previous studies. This research begins by exploring engagement on visual platforms. We question whether the visual environment leads to differing brand perceptions in terms of acceptance of brand presence and advertising. We also compare the intensity of engagement with user-generated content to brand-user-generated content. Finally we evaluate the relationship between engagement and purchase, and whether routine online activity evokes social shopping.
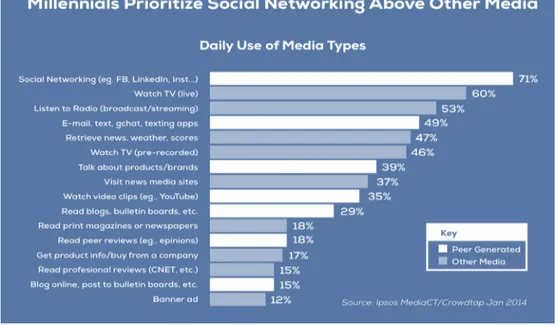
Figure 5: Millennials’ daily use of media types (Ipsos MediaCT, 2014)
Generation Y are people born between 1979 and 1995 (Nielsen, 2014). This is the generation that founded and use social media, who access digital media every day (figure 5) and are the driving force behind online shopping (Smith, 2011). The typical Millennial consumer spends roughly 18 hours a day engaging with media, and of this 30% of media time is spent with user-generated content and social networking (Ipsos MediaCT, 2014).
Millennials represent 20-22% of the total population in Europe (110 million) and the USA (80 million). From a marketer’s point of view, their purchasing power of over $170 billion per year (USA) (Waterworth, 2014) makes them an attractive target. Millennials are also more visually sophisticated (Bolton et al., 2013) and relationally inspired than any other generation (Nally, 2013). And although they are digital creatures, they also appreciate brands that fit with their chosen lifestyles (Nally, 2013, Kerner, 2013).
Smith (2013) says that Fostering and facilitating relationships with people and giving people social currency to spend and reasons to connect and share with each other is every brand’s new challenge. The potential payoff for brands that succeed in this is that earned, user-generated content will drive purchasing behaviour amongst consumers in this new era of consumer empowerment (L2 Intelligence Report 2014).
Research Problem
The ‘Seriously Social’ trend report of 2013 recommends more research to understand the causality between engagement on social media brand pages and brand purchasing (Field & Grande, 2013). This was still a suggestion in 2014 when Wallace et al. (2014) highlighted the lack of knowledge about the connection between brand ‘likes’ on social networks and buying behaviour. This led to calls for more research on Gen Y’s social media usage and the effects on purchasing and consumption (Bolton et al, 2013).
Gen Y consumers are likely to be the most valuable target market accessible by visual social media (Hoffman, 2013). Both Instagram and Pinterest offer ways to direct marketing communications at likely social shoppers—people who use social networks and whose buying decisions may be influenced by social media (Lysonski & Durvasula, 2008). In this regard Millennials are almost twice as likely to be social shoppers as other social media users (Hoffman, 2013) and their visual affinity means they engage better with visual platforms compared to traditional text-based platforms (L2 Intelligence Report, 2013).
With the recent introduction of advertising on visual social media, this research is a timely investigation of the effectiveness of marketing efforts in a visual social media environment. Furthermore it aims to assess how effective user-generated content is in comparison to brand-generated content.
Research Questions
1. To define engagement on visual social media and determine appropriate measurements. 2. To understand if usage of visual social networks varies across different platforms. 3. To determine if user-generated and brand-generated content have different effects on
millennial consumers’ brand engagement.
4. To analyse how engagement on visual social media impacts purchase behaviour and social shopping.
METHODOLOGY
The scope of this research was limited to an in-depth examination of Instagram, using the concept of customer engagement linked to purchase behaviour. The first phase of the work involved focus group interviews with Gen Y consumers that helped us refine our knowledge and frame the questions included in the quantitative survey. This was followed by in-depth interviews with marketing professionals who use social media marketing. These expert interviews helped to shape our understanding of the media from a professional point of view. We then conducted a quantitative survey.
The engagement concept originated in psychology, sociology and organisational behaviour (Brodie et al., 2011) but the Advertising Research Foundation acknowledges there is no single theory to explain engagement or how it works. Nonetheless, engagement definitions always include such concepts as attention, visual perception, emotion and social relations (Nelson-Field & Taylor, 2012). Here we use four types of engagement: cognitive engagement (Brodie et al., 2011; Bowden, 2009; Mollen & Wilson, 2010), emotional engagement (Calder & Malthouse, 2008; Hollebeek, 2011a; Bowden, 2009; Mollen & Wilson, 2010), behavioural engagement (van Doorn et al., 2010; Hollebeek, 2011a; Bowden, 2009; Lawrence et al., 2013), and personal engagement (Lawrence et al., 2013). Following van Doorn et al. (2010) and Brodie et al. (2011), the scope of this research was within the definition of interactive experience where the terms participation, interaction and involvement are seen as behavioural actions in a social media context. Thus consumers must not simply observe content, but must take some action to be considered engaged. We also assessed how engagement with use-generated content differs from engagement with brand-generated content (Field & Grande, 2013).
Sample
A non-probability sample was designed to capture frequent users of Instagram 18 to 34 years old (Gen Y) and two thirds female, to match Instagram’s user base. Since Instagram is not bounded by geography, we expected the sample to be international. We used an online snowball sampling technique. A self-administered questionnaire was distributed online. The questionnaire was available for two weeks, which was sufficient to satisfy the sample size of 115 participants, which is adequate given Instagram’s total user base.
Data Collection
A mixed-method strategy was applied with an initial exploratory focus group discussion to deliver insights and understanding of millennial use of visual social media. We then interviewed five marketing professionals who were asked to discuss visual media platforms in order to help form a general understanding of how the media work, the latest developments and trends and the issues of most concern to marketers. Qualitative findings then fed into secondary research to develop a coherent and well-informed questionnaire.
Components and data analysis
Quantitative data was collected through an online survey portal. Analysis was conducted with the aid of IBM SPSS Statistics software as well as Microsoft Excel. Different techniques and measurements were applied to display descriptive statistics and analyse relationships between variables, interdependence, averages, and trends (Pallant, 2013).
RESULTS
Qualitative results
Our first finding was that the expert interviews were in line with findings in the literature review, namely that Facebook remains the most frequently used platform (ROIresearch, 2012) but now faces increasing competition (Lunden, 2014). The experts felt Instagram was the most fun and enjoyable platform, but they spend more time on Facebook, (see Duggan and Smith, 2013). Instagram’s attraction is its ease of use and non-distracting interface (Facebook was described as cluttered, distracting and disruptive).
The discussion of visual content led to the insight that the experts have liked images or brands they did not find particularly appealing. The reason was that they were friends with users who shared an image, and liking the image was part of a so-called ‘friend codex’. This finding is similar to that of Lawrence et al. (2013) who show that in personal engagement, the content and/or the source of content is relevant to the user.
The experts also felt that Facebook and Instagram users are open to both brands and unfamiliar users such as bloggers, influencers or unknown users who share good content. Instagram was described as having a liberal attitude towards advertising because a user can follow other users (of all types) without automatically allowing them to follow back. Whereas connecting on Facebook is always a two-way street. Also, friends and connections are not notified when a user chooses to follow on Instagram. Finally the experts agreed that they do not mind seeing branded content on Instagram because it is, at the time of this research, still of high quality and visual appeal.
Quantitative results
The sample was 68% female, 32% male, and came from a dozen countries, the largest portions being German (35%), Italian (14%) Canadian and British (11% each) and US (7%). 46% had a bachelor’s degree, and 38% a postgraduate degree.
These Gen Y respondents were also frequent users of social media, with 57% claiming to use Instagram daily, and 68% using Facebook daily, or several times a day. However, the Facebook users tended to use it to communicate with friends, while they used Instagram to share pictures (Instagram has limited facility for text content).
The main differences in perceptions was that Facebook was not considered to be private while Instagram was. Facebook was useful but time-consuming, and most users spent 30 minutes or more per day on it. Instagram on the other hand accommodated busy users by being simple and easy, and users spent on average 1-5 minutes per session.
Consumers or Contributors—there is a debate over whether Generation Y social media users are really consumers or creators of social content (Bolton et al. 2013). We find they are both; 40% of participants claimed to often or very often share their own content on Instagram. In comparison 57% said they browse other people’s content and 50% claimed to like content, and are therefore characterised as contributors (Muntinga et al., 2011).
In order to understand consumer behaviour patterns better, Instagram users were classified into consumer types according to Muntinga et al. (2011), and were then cross-tabulated with their social shopping behaviour in terms of considered purchase. This revealed a clear relationship between users who were ‘consumers’ of social content who also considered purchasing after seeing visual content on Instagram. A Chi-square test for independence (n=115) indicated a significant association between the two variables with χ2 =16.08,
p-value for significance = .000, and φc (Cramer’s phi) = .374 which indicates a medium association between the variables (Pallant 2013). 62% of content consumers considered purchasing whereas only 23% of non-consumers did.
When looking at ‘creators’ (those who share content), two thirds considered making a purchase, whereas only 20% of non-sharers did. This result is statistically significant with an association between variables: χ2 =15.3, p-value= .000, and φc = .365.
‘Contributors’ considered a purchase in 60% of cases, whereas only 17% of non-contributing users did so. This result is also statistically significant with a medium association between variables: χ2 =11.9, p-value= .003, and φc = .322.
In sum, ‘engagement’ of all types, was related to consideration of purchase, in contrast to non-engagement. However there was no correlation between types and actual purchase. Nor was being active in creating and sharing own content an indication of higher social shopping. On the contrary, across all types, of those who considered making a purchase, less than half (46%) claimed to have made an actual purchase.
DISCUSSION, CONCLUSIONS AND IMPLICATIONS
Our first objective was to define engagement on visual social media and determine appropriate measurements from secondary data in the form of industry reports, market journals and academic literature. In this we found a general use of measures such as 'likes', comments and shares, though these measures were rarely linked to purchase intention or to actual purchase. However, the literature contains much discussion of engagement forms that have cognitive, emotional, personal and more rarely, behavioural components. There was also the the widely used engagement rate formula (Engagement as a percentage of base volume) which was sometimes tied to measures of marketing performance such as intent to purchase, but again, rarely tied to actual purchase.
The second objective was to understand usage of visual social networks and whether they vary across different platforms. Previous research established that people use Facebook for verbal or text communications and Instagram to share their pictures. Questions about privacy and usefulness of the platforms revealed that Facebook has lost some users’ trust over the years so they tend to share less information there. Instagram was described as both private, and easy to use.
About 90% of Instagram users followed their friends and nearly 50% followed brands, but only 16% Facebook users did so. Instagram users also aspire to lifestyles they do not currently have, e.g. 85% of Instagram social shoppers had never bought the brand before and 83% said they were following it because they would like to become a customer. These aspirational non-buyers named cost and budget restraints as major reasons for not buying.
Bloggers, influencers and content curators feel at home on Instagram where users were observed to be very open towards unknown or unfamiliar content sources. Nearly half of the Instagram users followed both brands and unfamiliar users, whereas on Facebook bloggers and unfamiliar users had a following of 21%.
The third objective was to determine if user-generated and brand-generated content have different effects on millennial consumers’ brand engagement. We found that of the followers of influencers and brands, 64% had engaged with the respective content. In comparison 86% liked their friends’ content—keeping in mind the ‘friend codex’ of liking things one is asked to like (Tuten, 2008; Tanyel et al., 2013).
Comparing user-generated content against brand-generated content, we found that content shared by unfamiliar users and content shared by brands got more total engagement (likes, comments, screen grabs) than friends’ content. This links back to the initial research problem ‘do user-generated photos inspire purchase action?’ If one strictly separated brand accounts from user accounts, then content of friends and content of unfamiliar users added together inspired more purchases than content from brands. The differentiation of friends and unfamiliar users was critical, because unfamiliar users are often bloggers, influencers and people with a high follower count. For marketers, the influencers within a brand’s target audience and are key to triggering social shopping.
The fourth objective was to analyse how engagement on visual social media impacts purchase behaviour and social shopping. Here we found over half (58%) of brand followers, who actively chose to become fans and engage with the brand were also social shoppers who bought an item after seeing it on Instagram. Social shoppers were 8 times more likely to follow brands than those who never purchased. This leaves brands with some indication of the value of an Instagram user. What can be concluded is that those who were receptive to brand interaction often did in fact engage in social shopping and make purchases.
85% of social shoppers (those who actually purchased) who follow brands were also new customers. Thus social shopping could be a key to brand growth. The question of whether there is a visible indication of a brand follower being ready to purchase was assessed by cross tabulating ‘brand followers who like brand-shared content’ and ‘actual purchase decision’. In around 60% of cases ‘liking’ brand-shared content resulted in purchasing. 96% of social shoppers who purchased showed cognitive engagement, i.e. ‘feeling interested’. In comparison, in terms of behavioural engagement, 67% of social shoppers had liked the image before purchasing, and 15% had commented on the picture. However feeling engaged in one way or another was not necessarily an antecedent to purchase-- 32% of claimed purchases happened without engagement or social shopping.
CONCLUSION
Instagram and other visual platforms in the social media scene emphasise the importance of visual information online. The explosive growth of such platforms attracts increasing marketing effort and establishes a need to better understand the marketing implications. The motivation of this research was to develop an empirically-derived picture of behaviour
on Instagram. Secondary and qualitative research played a supportive role, helped to clarify issues raised in the literature, and was useful in refining the questions for further research. A comparison of the more visual Instagram against Facebook showed that people primarily communicate with friends on Facebook and have little interest in following brands. Those who do follow brands, do so because they are already customers of that brand. On Instagram however, people are more open to following brands and unfamiliar users, and also engaging with content. To capitalize on these opportunities to expand reach, brands need to follow social media rules and etiquette.
Our main contribution is to show that there is a potential link between visual social media, intent to purchase, and actual purchase. We also conclude that the measures used to track and assess social media marketing, centred on engagement, are at best akin to conventional advertising measures such as reach and opportunity to see (OTS) and we found very little evidence that marketers attempt to link their social media marketing efforts to actual purchases or sales.
While marketers might be tempted by the social media potential for reaching a broad audience, they need to remember that 60% of brand exposure is achieved through user-generated content, which brands do not control. Thus building relationships with key influencers, such as bloggers, is critical to leveraging user-generated content. This research shows that Instagram users are open to following unfamiliar users and are receptive to visually pleasing branded content. The power to influence purchase intention via strong social ties is surprisingly low. This places even more importance on the need for brands to build relationships with influencers.
As of today Instagram remains understated in terms of advertising on its platform. It will be interesting to see whether it resists the urge to further monetise the platform and how that will affect users’ attitudes towards brands and branded content.
Limitations and Further Research
The scope of this research was limited to Instagram and further research is recommended on other emerging visual social media platforms in order to arrive at more generalizable results. Since the sample size of this study was relatively small, a larger sample is highly recommended for replications or studies on other visual social media. Additionally, attention needs to be drawn to the fact that this study is based on self-reported past behaviour and it would strengthen our findings to measure actual behaviour.
Furthermore the psychological aspect of engagement with pictures could be analysed in new research and a deeper assessment of underlying reasons and motivations in the form of quantitative research may be beneficial to fully understand user behaviour.
Finally, given the rapidly changing nature of social media any research needs to be updated on a regular basis. This is especially true in ‘social’ areas where the relationships between participants are evolving.
Given that key influencers and bloggers are most influential, we also suggest further research into their motivations and preferences.
REFERENCES
Beck, M, (2015): “Pinterest Launches Analytics For Business Accounts,” http://marketingland.com/pinterest-launches-analytics-upgrade-available-today-business-accounts-97379
BI Intelligence (2014) Research For the Digital Age [Report] online resource available at:
https://intelligence.businessinsider.com
Bolton, R. N., Parasuraman, A., Hoefnagels, A., Migchels, N., Kabadayi, S., Gruber, T., Loureiro, Y. K., Solnet, D. (2013): “Understanding Generation Y and their use of social media: a review and research agenda.” Journal of Service Management Vol 24 No 3
Bowden, J. L.-H. (2009): “The Process of Customer Engagement: A conceptual Framework.” Journal of Marketing Theory and Practice Vol. 17 No. 1
Brodie, R., Hollebeek, L.D., Juric, B. and Llic, A. (2011): “Customer Engagement:
Conceptual Domain, Fundamental Propositions, and Implications for Research,” Journal of Service Research, 14(3)
Bronner, F., de Hoog, R. (2014): “Social media and consumer choice.” International Journal of Market Research Vol. 56 Issue 1
Burdett L., Walker, J., Curry A., Gildenberg B. & Mader S. (2013): “The Future Shopper: How changing shopper attitude and technology are reshaping retail,” Kantar Retail.
Calder, B. J., Malthouse, E. C. (2008)” “Media Engagement and Advertising Effectiveness” in Kellogg on Advertising and Media, Bobby J. Calder, ed. Hoboken, NJ: Wiley, 1-36.
Chung, C., Austria, K. (2010): “Social Media Gratification and Attitude toward Social Media Marketing Messages: A Study of the Effect of Social Media Marketing Messages on Online Shopping Value.” Proceedings of the Northeast Business and Economics Association,
Ehrenberg, A., Jones, J. P. (2006): “The weak force school vs the strong force school.”
Brand Management Models. [online] Available through WARC: http://0-www.warc.com.lispac.lsbu.ac.uk/Default.aspx [Accessed 21 April 2014]
Field, P., Grande, C. (2013): “Seriously Social” – WARC Trends - A casebook of effectiveness trends in social media campaigns. WARC
Finn, G, (2015): “Pinpoint Targeting & Animated Ads Coming To Pinterest Soon,” Marketing Land, http://marketingland.com/pinpoint-targeting-animated-ads-coming-
Duggan, M, Smith, A, (2013): “Social Media Update,” [report], Pew Research Center, Online resource available at: http://www.pewresearch.org
Globalwebindex (2015): “Daily time spend on social networks rises to 1.72 hours,” accessed online 18/06/2015 at https://www.globalwebindex.net/blog/
Google (2014) Brand Engagement in the Participation Age. Ad Age Content Strategy Studio. February[research study] Available at: http://think.storage.googleapis.com/docs/brand-
Hemsley, S. (2012): “Looking for a visual feast in the tablet experience.” Marketing Week, 15 November, Vol. 35 Issue 48.
Hoffman, G. (2013): “Where Fashion-Focused Millennials find Inspiration.” CMO – Digital Marketing Insights for CMOs. [online] 18 November 2013
Hollebeek, L. (2011a): “Exploring customer brand engagement: definitions and themes.”
Journal of Strategic Marketing, 19, 7.
Hollebeek, L. (2011b): “Demystifying customer brand engagement: exploring the loyalty nexus.” Journal of Marketing Management, 27, 7–8.
Hucker, R. (2012): “Market Assessment 2012 – Social Media Marketing.” Key Note Second Edition September 2012.
Instagram Blog (2014): Available at:
http://blog.instagram.com/post/64973363225/adsoninstagram [Accessed 16 March 2014] Ipsos MediaCT (2014): “Social Influence: Marketing’s New Frontier. [Research Paper] March. Available at: http://go.crowdtap.com/socialinfluence [Accessed 14 April 2014] Kemp, S (2015): Digital, Social and E Mobile Worldwide in 2015, from We Are Social, http://wearesocial.net/blog/2015/01/digital-social-mobile-worldwide-2015/
Kerner, N. (2013): “Trying to Understand Gen Y? Get Comfortable With Being Uncomfortable.” Forbes Business Magazine, New York, USA
Lawrence, B., Fournier, S., Brunel, F. (2013): “When Companies Don’t Make the Ad: A multi-method Inquiry into the Differential Effectiveness of Consumer-Generated Advertising.” Journal of Advertising 42 (4)
Levitt, K. (2013): “The multi-screen path to purchasing 2013”. ComScore [online] Available at: http://www.comscore.com/Insights/Presentations_and_Whitepapers Lunden, I. (2013): “73 % of U.S. Adults Use Social Networks, Pinterest Passes Twitter In Popularity, Facebook Stays On Top.” Tech Crunch
Lysonski, S., Durvasula S. (2008): “A Double Edged Sword – Understanding Vanity Across Cultures,” Journal of Consumer Research Vol 25 issue 4
Mintel (2013): “Social Networking – UK” [report] Available through Mintel: http://0-academic.mintel.com.lispac.lsbu.ac.uk/ [Accessed 18 March 2014]
Mintel (2014): “Social and Media Networks – UK” [report] Available through Mintel: http://0-academic.mintel.com.lispac.lsbu.ac.uk/ [Accessed 15 June 2014]
Mintel, (2015): “Social Networking – UK” [report] Accessed online 18/06/2015 at http://0-academic.mintel.com.lispac.lsbu.ac.uk/display/737900/?highlight#hit1
Mollen, A., & Wilson, H. (2010): “Engagement, telepresence and interactivity in online consumer experience: Reconciling scholastic and managerial perspectives.” Journal of Business Research Vol. 63
Muntinga, D. G., Moorman, M., Smit, E. G. (2011): “Introducing COBRAs - Exploring Motivations for Brand- Related Social Media Use.” International Journal of Advertising, 30 (1) Nally, J. (2013): “Top 5 Tips for Inspiring the Visual Millenial,” Target Marketing. 3 (15) Nelson-Field, K., Klose, G. (2010): “The Social Media Leap: Integrating social media into marketing strategy.” ESOMAR [online] October 2010. Available from: WARC
Nelson-Field, K. (2013): Viral Marketing – The Science of Sharing. Oxford University Press, Australia
Nelson-Field, K., Taylor, J. (2012): “Facebook fans: A fan for Life?” Admap, May Nielsen (2014): “Millennials – Breaking the Myths.” Nielsen Reports. [online]. Available at: http://www.nielsen.com/us/en/reports/2014/millennials-breaking-the-myths.html Pallant, J. (2013): “SPSS Survival Manual.” 5th Edition. Mc Graw-Hill Education, England.
Pew Resaerch Centre (2013) Internet Access 2014 [report}, Online resource available at:
http://www.pewresearch.org
Pinterest (2013): Burberry Brand Boards. [online] Available at: http://www.pinterest.com/burberry/ [Accessed 2 December 2013]
Pinterest (2014a): “Planning for the Future. Oh how Pinteresting.” [Blog] 19 September 2013. Available at: http://blog.pinterest.com/post/61688351103/planning-for-the-future Smith, K.T., a (2011): “Digital marketing strategies that Millennials find appealing,
motivating, or just annoying.” Journal of Strategic Marketing. Vol. 19, No. 6, October Smith, S., b (2013): “Conceptualising and evaluating experiences with brands on Facebook.” International Journal of Market Research Vol. 55 Issue 3
Smitha, N. (2013): “Facebook Metrics defined – Engagement Rate.” SimplyMeasured, Tanyel, F., Stuart, E. W., Griffin, J. (2013): “Have “Millennials” embraced digital advertising as they have embraced digital media?” Journal of Promotion Management, 3(11) Van Doorn, J., Lemon, K. N., Mittal, V., Nass, S., Pick, D., Pirner, P., Verhoef, P. C. (2010): :Customer Engagement Behavior: Theoretical Foundations and Research Directions.” Journal of Service Research 13(3).
Verma, S. (2013): “Twitter joins the visual web. Industry Insights,” Piqora. [online] 30 October 2013. Available at: http://blog.piqora.com/twitter-joins-the-visual-web/
Wallace, E., Buil, I., de Chernatony, L. (2014): “Consumer engagement with self-expressive brands: brand love and WOM outcomes.” Journal of Product & Brand Management 23/1 Warc Trends (2013): Trends Snapshot: The future of native advertising. Warc Trends, December [Online] Available through WARC: http://0-www.warc.com.lispac.lsbu.ac.uk/Default.aspx Waterworth, N. (2014): “I’m a Millennial and this is How I Buy Things.” TFM&A Insights