STUDENTS’ PERCEIVED USEFULNESS OF THE E-LEARNING (A Survey Study at Ar-Raniry State Islamic University)
THESIS
Submitted by
NURUL HUSNA
Student of Faculty of Education and Teacher Training Department of English Language Education
Reg. No: 231324410
FACULTY OF EDUCATION AND TEACHER TRAINING
AR-RANIRY STATE ISLAMIC UNIVERSITY
DARUSSALAM - BANDA ACEH
2018 M/1439 H
iv
ACKNOWLEDGEMENT
Alhamdulillah, all praises are due to Allah, the Almighty who has blessed
and given me the chance, inspiration, and power to finish this thesis. Peace and salutation is being upon to the beloved Prophet Muhammad SAW who has shown us the perfect example of the greatest human being.
I thank to my beloved parent, Wiyono and Nurzaitun who have always motivated and supported me with all their prayers, affection and love. Nobody compares to the way you love me in this world. I also thank to my beloved brother, Ahmad Budi Santosa and all of my relatives and grandparents who have patiently given their support to me.
Besides, I express my respect and thank to Dr. T. Zulfikar, M.Ed and Yuni Setianingsih, M.Ag as my main supervisor and co-supervisor who have patiently guided and supervised me on writing this thesis. My appreciation is also addressed to all lecturers in English Education Department.
Moreover, I thank to all my best friends: Skoloners, Gina Kembari Jasman, S.E, Isra Mirandha, S.E, Putri Indahna Irda, S.E., S.Pd, Farah Hanum, S.Pd, M Farizs Akbar, S.E, and PBI 2013 who have participated and shared ideas in conducting this study. I wish Allah bless all of you forever. Amin.
Banda Aceh, July 4 2017
v ABSTRACT
Name : Nurul Husna
Reg. No : 231324410
Faculty/Major : Faculty of Education and Teacher Training/ Department of English Language Education Title : Students’ Perceived Usefulness of the E-learning
(A Survey Study at Ar-Raniry State Islamic University)
Advisor I : Dr. T. Zulfikar, M.Ed Advisor II : Yuni Setia Ningsih, M.Ag
Keywords : Perceived Usefulness; Students’ Attitude; E-learning
This study examines the impact of perceived usefulness on students’ attitude to e-learning use in Ar-Raniry State Islamic University. The variables used in this study are perceived usefulness and students’ attitude. The Simple Linear Regression is analyzed to test the research question as an analysis model. An online survey is conducted and distributed to 109 respondents, English Language Education students of class 2013 and 2012. The result of this research shows that perceived usefulness gives positive impact on students’ attitude after experiencing the e-learning. When students think that e-learning is more useful to support their study, students will experience positive impression in their learning process. Overall, the use of e-learning is useful to support learning process in Department of English Language Education, Ar-Raniry State Islamic University.
vi CONTENTS
Page
DECLARATION LETTER ... iii
ACKNOWLEDGEMENT ... iv
ABSTRACT ... v
CONTENTS ... vi
LIST OF TABLES ... viii
LIST OF FIGURES ... ix
LIST OF APPENDICES ... x
CHAPTER 1: INTRODUCTION 1.1 Background of the Study ... 1
1.2 Research Question ... 4
1.3 Research Objective... 5
1.4 Research Hypothesis ... 5
1.5 Significance of the Study ... 5
1.6 Terminology ... 6
1. Students’ Perceived Usefulness ... 6
2. Students’ Learning Attitude ... 6
3. E-learning ... 7
CHAPTER II: LITERATURE REVIEWS 2.1 E-learning ... 8
2.1.1 Type of Social Media for E-learning ... 9
2.1.2 The Strengths and Weaknesses of E-learning ... 13
2.2 Technology Acceptance Model (TAM) ... 15
2.3 Perceived Usefulness ... 15
2.4 Students’ Learning Attitude ... 16
2.5 Students’ Perceived Usefulness of the E-learning towards their Learning Attitude ... 16
2.6 Previous Studies ... 17
CHAPTER III: RESEARCH METHODOLOGY 3.1 Research Location ... 21
vii
3.3 Population and Sample ... 22
3.4 Research Instrument ... 23
3.5 Data Collection Techniques ... 24
3.6 Data Analysis ... 24
3.6.1 Descriptive Statistic of Respondent Characteristics ... 24
3.6.2 Descriptive Statistic ... 24
3.6.3 Instrument Validity and Reliability ... 24
3.6.4 Classical Assumption Testing ... 26
3.6.5 Hypothesis Testing ... 26
3.6.5.1 Simple Linear Regression ... 26
CHAPTER IV: RESEARCH FINDING AND DISCUSSION 4.1 Descriptive Statistic of Respondent Characteristics ... 28
4.2 Descriptive Statistic ... 29
4.3 Descriptive Statistic of Perceived Usefulness ... 29
4.4 Descriptive Statistic of Students’ Attitude ... 32
4.5 Instrument Validity and Reliability Test ... 35
4.5.1 Instrument Validity Test ... 35
4.5.2 Instrument Reliability Test ... 36
4.6 Classical Assumption Testing... 37
4.6.1 Normality Test ... 37
4.7 Hypothesis Testing ... 40
4.7.1 Simple Linear Regression ... 40
4.7.2 Result ... 41
4.7.3 Discussion ... 42
CHAPTER V: CONCLUSIONS AND SUGGESTIONS 5.1 Conclusion ... 44
5.2 Suggestion ... 45
REFERENCES ... 47
APPENDICES ... 51
viii
LIST OF TABLES
Page Table 3.1 The Number of Active English Department Students,
Ar-Raniry State Islamic University ... 22
Table 4.1 Descriptive Statistic of Respondent Characteristics ... 26
Table 4.2 Mean and Standard Deviation ... 27
Table 4.3 Descriptive Statistic of Perceived Usefulness ... 28
Table 4.4 Descriptive Statistic of Students’ Attitude ... 30
Table 4.5 The Result of Validity Test ... 34
Table 4.6 The Result of Reliability Test ... 36
Table 4.7 One-Sample Kolmogorov-Smirnov Test before Trimming Process ... 37
Table 4.8 Standardize Score (Z Score) ... 38
Table 4.9 One-Sample Kolmogorov-Smirnov Test after Trimming Process ... 39
ix
LIST OF FIGURES
Page FIGURE 4.1 Total Respondents’ Responses of Perceived Usefulness ... 29 FIGURE 4.2 Total Respondents’ responses of Students’ Attitude ... 33
x
LIST OF APPENDICES
I. Appointment Letter of Supervisor
II. Confirmation Letter of Conducting Research from Faculty of Education and Teacher Training, Ar-Raniry State Islamic University
III. Confirmation Letter of Conducting Research from Department of English Language Education, Ar-Raniry State Islamic University
IV. Questionnaire
V. The Responses of the Questionnaire VI. Documentation of the Research
1
CHAPTER I INTRODUCTION
This chapter deals with the background of study, research question, research objective, research hypothesis, significance of study, and terminology. Background of the study provides and explains the phenomenon of the study, the aspects are studied, and the significance to be studied. The main purpose is to reveal the main motive of the research, the problem that needs to be solved, the importance of the research, and the introduction of terminology of this study.
1.1 Background of the Study
Globalization has changed human’s life with sophisticated technology and information. Information technology enables human activities to become easier by using internal integrated technology such as computer, smartphone, and internet connection. Internet users could do everything by doing a single click on computer or smartphone anywhere and anytime. It facilitates the user to explore the world without moving any single steps to another part of the world at the same time.
The usefulness of internet technology allows users from all part of the world to use them as a source of information, business, style, and education. According to the International Telecommunications Union (2017), the internet users from Indonesia in December 31, 2017 have increased significantly in number from year 2000; 2,000,000 and 143,260,000 respectively. 50.4% of total Indonesian population is internet users. According to Juniarta (2015), the
2
Indonesian Ministry of Communications and Information spokesman, Ismail Cawidu stated that 58.4 % of Indonesian internet users in 2015 are 12 to 34 years old and online for five hours by personal computer and about two hours by mobile devices. Most of teenager and youth spend their time using internet to search information (20%), emailing (10%), downloading, viewing, and chatting (30%), playing game (30%) and other activities less than (10%).
The data above indicates that globally people tend to spend many hours on internet, especially on social media (Jabr, 2011). Consistent with Greenhow, Robelia, & Hughes (2009), social networking media is not only used to support communication but also to share knowledge between users. Moreover, Jonnavithula and Tretiakov (2012) also stated that social media can be used by teacher as e-learning site.
E-learning is a frequent application used to support education field (Islam, 2016). Using e-learning helps teaching and learning process to reduce time and boundary in education context (Chang, Jeyhun, & Chia-Rong, 2017). E-learning also allows student and teacher to widely search information from various sources indefinitely (Elkaseh, Wong, & Fung, 2016). E-learning also can be used to help collaborative and interactive learning environment (Fischer & Mandl, 2005). Besides, using e-learning, a teacher might teach the students through utilizing internet without visiting a classroom and a student also could access an e-learning site at home.
In Department of English Language Education, Ar-Raniry State Islamic University, there are many lecturers who use e-learning to support teaching and
3
learning process. The lecturers use many kinds of social media such as; Facebook, Nicenet.org, and Gmail to support e-learning activities. The students are required to read the materials posted, give comment, and post the assignment on it. This teaching and learning process is not only taking place in the classroom, but also outside the classroom. It eases the students to learn a specific material given by a lecturer from various materials on internet such as journals, articles, online books, and online magazines.
On the other hand, based on the writer’s and peers’ experience, students of Department of English Language Education, Ar-Raniry State Islamic University faced difficulties when using the e-learning. Students need a fast internet connection to connect their computer and access the e-learning in the classroom. Unfortunately, the internet connection is not supported well in all area of the college. Besides that, most of students do not have the Wi-Fi in their homes and need to find free internet access outside their homes. The home menu on e-learning is not familiar to the users. Students need to pay attention and learn how to use the learning. Students also complained that the tasks given on the e-learning were confusing and need further explanation. Lecturer need to explain further about the tasks given in the classroom.
Along with the usefulness of the e-learning found by the experts and the difficulties found by students in Department of English Language Education, Ar-Raniry State Islamic University, it shows that there is a gap between the finding of expert and the difficulties faced by students of Department of English Language
4
Education when using e-learning. Therefore, this research is important to conduct in order to analyze students’ perception on e-learning use.
To analyze students’ perception towards e-learning use, this study will use a model developed by Davis (1985) called TAM (Technology Acceptance Model). TAM has been successfully identified students’ decision to use a learning system. The main objective of this model is to explain the individual's behavior towards the adoption of technology (Chang, Jeyhun, & Chia-Rong, 2017). TAM has central variables; perceived ease of use and perceived usefulness which directly influence attitude toward technology use (Davis, 1989). However Davis (1993) reinforces his statement that perceived usefulness was 50% stronger than perceived ease of use to influence users’ attitudes towards using a technology.
Because of the existed issue found among students of Department of English Language Teaching who experience difficulties on e-learning use, it is important to conduct a study in order to identify students’ attitude after studying on e-learning. This study examines the impact of perceived usefulness on students’ attitude to e-learning use among students of Department of English Language Teaching. This study focuses on students of Department of English Language Teaching, class of 2012 and 2013, who had experienced e-learning sites such as Facebook, Nicenet.org, and Gmail. It is due to the experience of e-learning use in Ar-Raniry State Islamic University.
5
1.2 Research Question
Based on issues provided in background of study, the research question for this study is: Does students’ perceived usefulness of the e-learning give positive impact on their learning attitude?
1.3 Research Objective
In line with the research question above, the objective of this study is to analyze the impact of students’ perceived usefulness of the e-learning towards their learning attitude.
1.4 Research Hypothesis
Therefore, the following hypothesis is conducted for this study:
H0: Students’ perceived usefulness of the e-learning does not give positive impact on their learning attitude.
H1: Students’ perceived usefulness of the e-learning gives positive impact on their learning attitude.
1.5 Significance of the Study
There are two benefits of this study:
1. This study aims to contribute to information and educational technology, especially the implementing of e-learning as a learning method in classroom and students’ perception to use it.
2. Teachers can optimize the learning activities, both inside and outside the classroom. E-learning can also ease teaching and learning process
6
and the task given because the learning can be done anytime and anywhere.
3. Schools can improve their students’ learning outcomes by using e-learning to meet the objectives of the curriculum that had been expected.
1.6 Terminology
To avoid the misinterpretation, some significant terms would be used throughout the research are explained below:
1. Students’ Perceived Usefulness
Davis (1989:320) defined perceived usefulness as the degree to which a person believes that using a particular system would enhance his or her job performance. Ma’ruf (2005; p. 62) also defined perceived usefulness as the internet users’ subjective assessment degree towards the increase of achievement goal by using internet system. In this study, students’ perceived usefulness is defined as students’ perception of e-learning use because of its usefulness to help and improve students’ learning process.
2. Students’ Learning Attitude
Sun et al. (2006) defined students learning attitude as students’ impression after participating the e-learning activities. The definition of students’ learning attitude is actual influence on the use of the e-learning (Chang, Hajiyef, & Su, 2017). This study defines learning attitude as the
7
students’ positive impression after using the e-learning. The more positive students’ perceive usefulness on e-learning, the more positive their attitudes are toward e-learning.
3. E-learning (Electronic learning)
Sun et al. (2006) defined e-learning as web-based system that makes information or knowledge available to users or learners and ignores time and geography limit. Islam (2016) also stated that e-learning is a frequent application used to support education field. This study defines e-learning as an educational application designed for teaching and learning process by using Nicenet.org. This study examines the use of Nicenet.org due to the use of Nicenet.org to support teaching and learning process in Department of English Language Education, Ar-Raniry State Islamic Univeristy.
8 CHAPTER II
LITERATURE REVIEWS
This chapter explains the relevant previous studies related to the perceived usefulness of the e-learning and theoretical description. Previous studies discuss about related theories and the findings. Theoretical description describes the explanation of each theory.
2.1 E-learning
E-learning is the abbreviation of electronic learning. Nowadays, the e-learning systems are known as modern information technologies which have various kinds of applications and provide the computer-based learning process, online learning, virtual classrooms and digital collaboration (Hsia, Chang, & Tseng, 2012). In addition, Sun et al. (2006) defined e-learning as a particularly a system based on web which provides the information and knowledge for the users or learners without geographic boundary. E-learning uses the communication technology to convey information for education and training.
Nowadays, e-learning is considered as modern education. In the past decade, the learning context has been transformed into web access, along with the crucial of technological competency to be mastered by students, teachers, and administrators. The use of web access has increased continuously in educational institutions, houses, neighborhoods, and communities (Greenhow, Robelia, & Hughes, 2009).
9
Islam (2016) stated that e-learning is a frequent application used to support education field. Using e-learning helps teaching and learning process to reduce time and boundary in education context (Chang, Jeyhun, & Chia-Rong, 2017). The use of e-learning allows teacher to teach the students through utilizing internet without visiting a classroom and a student also could access an e-learning site at home to attend a lecturer. Besides, e-learning also allows student and teacher to widely search information from various sources indefinitely (Elkaseh, Wong, & Fung, 2016). Hence, e-learning can be used to help collaborative and interactive learning environment (Fischer & Mandl, 2005).
According to Jonnavithula and Tretiakov (2012), social media can be used by teacher as e-learning site. Consistent with Greenhow, Robelia, and Hughes (2009), social media is not only used to support communication but also to share knowledge between users. Using social media to support teaching and learning process have a positive effect on students’ learning outcome (Jakson, 2011). Social media adopting offers students to get various material resources to enhance their understanding (Friesen & Anderson, 2004).
2.1.1 Type of Social Media for E-learning
There are many kinds of social media that can be used to support teaching and learning processes and activities such as Facebook (Pappas, 2015), Twitter (Buddle, 2014 and Elkaseh, Wong, & Fung, 2016), Canvas (Farkas, 2012 and
Carroll, Tchangalova, & Harrington, 2016) and Nicenet.org (Mohamed &
Dzakiria, 2005). In this part, the description of Facebook, Canvas, and Twitter are explained briefly. However, the description of Nicenet.org is explained in detail
10
due to the focus of this study is the use of nicenet.org as e-learning site in Department of English Language Education, Ar-Raniry State Islamic University.
1. Facebook
Facebook is a popular American online social media and social networking service company based in Menlo Park, California. Pappas (2015) stated that Facebook enables the support of e-learning and makes everyone easily not only to connect and build relationships with the virtual classmates, but also to exchange e-learning information. Pappas (2015) explained the strengths in using Facebook as e-learning tool such as Facebook is easy to be access for everyone, ideal to boost collaborative and active learning, suitable to enhance students’ engagement, and inexpensive to share material for students. On the contrary, Pappas (2015) also described the weaknesses of using Facebook as e-learning tool such as Facebook is not secure for privacy term. It also limits the lecturer to take control over the class. Hence, it is hard to conclude and give feedback on a learning activity (Pappas, 2015).
2. Canvas
Canvas is software that provides class to build an online study for courses, where class can post readings, video tutorials, discussion boards, tasks, and tests (Carroll, Tchangalova, & Harrington, 2016). Canvas offers a virtual space where students can study independently on their learning process and make great learning experiences for themselves and their
11
friends (Farkas, 2012). Carroll, Tchangalova, & Harrington (2016) stated that canvas course is delivered effectively to students in term of
information literacy and material content. Lecturer as a co-instructor can
also monitor student involvement and performance by using Canvas. Lecturer needs to create Canvas modules and directly import the content into students’ course space. Each session of the course was created to meet students’ needs in their courses (Carroll, Tchangalova, & Harrington, 2016).
3. Twitter
Gil (2018) stated that Twitter is on online news and social networking site where people communicate in short messages called tweets. Twitter can be used for academic application. Teachers, students, and parents can participate together on teaching and learning process by using Twitter in education (Norman, 2016). The short tweets can be used to tell students about any information and to collaboratively work as a great team.
Buddle (2014) described the strengths of using Twitter to support e-learning such as; Twitter improves the contact between students and their lecturer. It also helps to increase the cooperation between students. Twitter offers an active learning where students can experience the materials inside and outside classroom. Finally, Twitter can help to build a strong learning community between students. On the contrary, Schroeder, Minocha, & Schneider (2010) explained the weaknesses of using Twitter
12
to support e-learning process such as the data ownership are not secured and the quality of student interactions is poor.
4. Nicenet.org
Nicenet is also known as Internet Classroom Assistant (ICA). It is a web-based tool to manage a classroom such as language classroom. Nicenet.org is a courseware developed by non-profit organization to provide a free service for teaching and learning process. The application is free of charge and contains no advertising. Nicenet.org is designed for every level of education from elementary to post-secondary.
Nicenet.org is designed as a user friendly tool and easy to adopt and use. To start a teaching room on Nicenet.org, the only requirement needs is an internet connection. Once a teacher provides an instruction and creates a virtual class on Nicenet.org, it is possible for teacher to modify and edit according to the class needs anytime. Nicenet.org uses a password to protect the users and only the member of the class can enroll the space. This capability allows students and teachers to create a closed and private classroom virtual community safely (Erben & Sarieva, 2013).
Nicenet.org has many functions to facilitate teacher and student in collaborative learning. Teacher and students can do discussion, link sharing, document posting and sharing, class schedule posting and syllabus posting. The teacher and students who are enrolled in the Nicenet.org classroom can communicate through messages posted in conference space while conferencing. Both of teacher and students can
13
post any topic for discussion in conferencing space. All of the messages will be saved on Nicenet.org space. Students can post their assignments on Nicenet.org where the others student members and parents can easily access their assignments as well. Nicenet.org also uses e-mail address and the participants’ e-mail on the course will appear on the list (Erben, Ban, & Castaneda, 2009).
2.1.2 The Strengths and Weaknesses of E-learning
The implementation of e-learning in education, particularly for higher educational institutions has several strengths. Many studies have provided the strengths derived from the implementation of e-learning in education (Arkorful &
Abaidoo, 2015; Algahtani, 2011; Hameed et al, 2008). Some of the strengths of
e-learning adoption in education are:
1. E-learning provides the flexibility of time and place for lecturer and students to take a class. Students are free to choose time and place that suits them.
2. E-learning increases the effectiveness of knowledge with a huge amount of information access.
3. E-learning offers opportunities for students to have discussion among peers and lecturer by using discussion forums. Therefore, e-learning motivates students to interact with other, as well as exchange and respect different point of views.
4. E-learning is cost effective where students and lecturer do not need to travel to a real class. E-learning is also cost effective for learning
14
where e-learning class is available for maximum number of learners with no need for many buildings. (Arkorful & Abaidoo, 2015; Algahtani, 2011; Hameed et al, 2008).
Despite of the strengths, the implementation of e-learning also possesses some weaknesses in education. Studies support that e-learning has some weaknesses (Arkorful & Abaidoo, 2015; Hameed et al, 2008). Some of the weaknesses of e-learning adoption in education are:
1. E-learning makes students to experience lack of interaction or relation between peers and lecturer on teaching and learning process.
2. E-learning gives negative effect in the improvement of students’ communication skills. Although students might have an excellent knowledge in academics, students may not possess the communication skills to deliver the acquired knowledge to others. It due to the lack of real interaction between their peers.
3. It is difficult for lecturer to control the test provided on e-learning. It is hard to regulate bad activities like cheating.
4. E-learning may also probably be misled to piracy and plagiarism. 5. It is also not all discipline can adopt the e-learning technique in
education. For instance the purely scientific discipline that cannot be done through e-learning. Researches have argued that e-learning is more appropriate in social science and humanities disciplines than
15
scientific discipline where there is the need of practical skills.
(Arkorful & Abaidoo, 2015; Hameed et al, 2008).
2.2 Technology Acceptance Model (TAM)
Technology Acceptance Model (TAM) was developed by Davis (1985). This model is built to forecast individual’s attitude after using information technology. There are two independent variables in TAM; perceived usefulness and perceived ease of use, one dependent variable; behavioral intention, and one mediating variable; attitude. The result showed that perceived usefulness and perceived ease of use influence users’ attitudes towards using a technology. However Davis (1993) reinforces his statement that perceived usefulness was 50% stronger than perceived ease of use to influence users’ attitudes towards using a technology. Therefore, this study uses perceived usefulness of the e-learning to predict students’ attitude after participating the e-e-learning.
2.3 Perceived Usefulness
Perceived usefulness is the believe degree of an individual who use a particular system to increase her or his performance (Davis, 1989; p. 320). Ma’ruf (2005; p. 62) defined perceived usefulness as the internet users’ subjective assessment degree towards the increase of achievement goal by using internet system. Liu, Liao, & Pratt (2009) in their research also defined perceived usefulness as the degree to which the technology is considered as superior to its predecessor. Hsia, Chang, & Tseng (2012) stated that perceived usefulness, the critical internal belief in Technological Acceptance Model (TAM), as the degree
16
of users’ belief after using a particular system that will increase their job performance within an organizational context. In addition, according to Sun et al. (2006) perceived usefulness is the degrees of work improvement after adopting e-learning system.
2.3 Students’ Learning Attitude
Many previous studies indicated that students’ attitude is a significance factor in e-learning satisfaction (Arbaugh & Duray, 2002; Sun et al., 2006; Chang, Hajiyef & Su, 2017). The definition of students’ learning attitude is actual influence on the use of the e-learning (Chang, Hajiyef, & Su, 2017). In addition Sun et al. (2006) defined students learning attitude as students’ impression after participating the e-learning activities. The more positive students’ perceive usefulness on e-learning, the more positive their attitudes are toward e-learning. As the result, it will improve students’ learning experiences and satisfaction, and chances to use e-learning in the future (Arbaugh & Duray, 2002; Sun et al., 2006). Piccoli, Ahmad & Ives (2001) also stated that students’ positive attitude on e-learning will let students to feel more satisfactory and effective in an e-e-learning environment. Furthermore, positive attitudes towards e-learning increase the chances of successful learning process (Sun et al., 2006).
2.4 Students’ Perceived Usefulness of the E-learning towards their Learning Attitude
TAM has central variables; perceived ease of use and perceived usefulness which directly influence attitude toward technology use (Davis, 1989). TAM has been successfully identified students’ decision to use a learning system. The main
17
objective of this model is to explain the individual's attitude towards the adoption of technology (Chang, Jeyhun, & Chia-Rong, 2017). TAM has been validated by many empirical studies of e-learning acceptance. TAM is the most commonly applied theory in e-learning studies (King & He, 2006; Sumak et al., 2011; Hsia, Chang, & Tseng, 2012; Jonnavithula and Tretiakov, 2012; Al-Gahtani, 2016; Elkaseh, Wong, & Fung, 2016; and Chang, Hajiyef, & Su, 2017). When students perceive e-learning as useful tool to support learning process, they will likely have a high degree of intention to use e-learning (Hsia, Chang, & Tseng, 2012).
In addition Elkaseh, Wong, and Fung (2016) stated that perceived ease of use and perceived usefulness are important factors to predict directly students’ and teachers’ attitude toward e-learning. Davis (1993) highlighted that perceived usefulness was 50% stronger than perceived ease of use to influence users’ attitudes towards using a technology. Finally, this study only examines the effect of perceived usefulness of the learning on students’ attitude after studying on e-learning.
2.5 Previous Studies
Studies related to perceived usefulness of the e-learning have been conducted in many previous studies. The researchers that have been involved in this field are Mohamed and Dzakiria (2005), Sun et al. (2006), Hsia, Chang, & Tseng (2012), Jonnavithula and Tretiakov (2012), Al-Gahtani (2016), Elkaseh, Wong, & Fung (2016), and Chang, Hajiyef, & Su (2017).
Mohamed and Dzakiria (2005) examined the Nicenet.org as the Internet Classroom Assistant (ICA) in English classroom at University of Utara Malaysia
18
(UUM), Malaysia. The data is collected by using a survey to examine students’ reaction towards the use of Nicenet.org in learning process. The findings show that Nicenet.org is able to reduce the language barriers and increasing students’ motivation in language learning. Besides that, they also found that Nicenet.org is useful tool to increase students’ writing ability. Nicenet.org offers the chance for students to send messages and communicate among student and teachers.
Sun et al. (2006) found critical factors drive a successful e-learning. An empirical investigation was conducted to examine the learners’ satisfaction. One of the critical factors that affect learners’ satisfaction is perceived usefulness. The perceived usefulness affects users’ attitudes toward a software tool and affects individuals’ belief and behavior when adopting the tool. The more positive learners’ attitudes are on e-learning, the better students’ improvement on learning experiences and satisfaction.
Hsia, Chang, & Tseng (2012) examined the implementation of e-learning in many companies for employee training. This study examines the feasibility of the extended TAM to explain employee acceptance of e-learning systems. One of the results show perceived usefulness positively affects behavioral intention to use e-learning among the employee in Taiwan.
Jonnavithula and Tretiakov (2012) conducted a research entitled “A Model for the Effects of Online Social Networks on Learning”. This study analyzed the effect of online social networks such as; Facebook or Google Plus on students’ learning. The results show that online social networks can be utilized by teachers to make students experience an e-learning. More critically, students may utilize
19
the online social networks in ways that influence their learning engagement and learning results by themselves, without a direct control from their teachers. The results also show the use of online social networks increases a higher students’ engagement and outcomes. Finally, the use of online social networks for e-learning increased students’ e-learning outcomes after participating on e-e-learning.
Al-Gahtani (2016) investigated the acceptance of e-learning by using a Structural Equation Model in academic field. A result survey of 286 students was analyzed to determine the factors that influence the learners’ intention to use e-learning. This study is focused on Technology Acceptance Model (TAM). The result shows that one of the factors significantly predict the students’ intention to use e-learning is perceived usefulness.
A research by Elkaseh, Wong, & Fung (2016) analyzed perceived ease of use and perceived usefulness of social media for e-learning. They stated that social networking media gives new opportunities for students and teachers to learn, share, create, and interact between each other. Therefore, they conducted a study to find out the factors that influence students’ and teachers’ acceptance of using social networking media as an e-learning tool. They used Technology Acceptance Model (TAM); perceived ease of use and perceived usefulness to test the factors of social networking using for e-learning. They adopted a mixed methodology and collected the data through questionnaire and interview. Finally, the results were examined by using Structural Equation Model (SEM) to predict students’ and teachers’ behavior of using social networking media for e-learning. The results showed perceived ease of use and perceived usefulness as important
20
factors that predict a students’ and teachers’ behavioral intention in using social networking media for e-learning.
In addition, Chang, Hajiyef, & Su (2017) examined the factors that affect university students’ behavioral intention to use e-learning system for the aim of educational purpose in Azerbaijan. The sample was undergraduate students and master students and collected by using a convenient sampling technique. The data were analyzed by using Structural Equation Modeling (SEM). One of the results show perceived usefulness positively influences students’ behavioral intention to use e-learning.
The findings form all the previous studies above showed that students’ perceived usefulness of the e-learning gives positive impact on their learning attitude. The more positive students’ perceived usefulness of the e-learning, the more positive students’ attitude after participating of the e-learning. In conclusion, perceived usefulness of the e-learning gives positive impact on students’ attitude after studying on the e-learning.
21 CHAPTER III
RESEARCH METHODOLOGY
This chapter explains and provides the information about the research methodology for this study. It consists of detail description of research design, research population and sample, research instrument, data collection technique and data analysis.
3.1 Research Location
The study is conducted in Department of English Language Education, Faculty of Education and Teacher Training, Ar-Raniry State Islamic University. The object of the study is students of Department of English Language Education. The address is JL. Ibnu Sina, No. 2, Kopelma Darussalam, Syiah Kuala, Banda Aceh, Aceh, Indonesia.
3.2 Research Design
This study uses quantitative method to analyze the data and to answer research question. Quantitative method is used to describe variables and examine relationships between variables. Quantitative data analysis is a powerful research form and often associated numerical data analysis (Cohen, Manion, & Morrison, 2013). The aim of this study is to find out the impact between two variables. Perceived usefulness which is symbolized by “X” is as independent variable and dependent variable is learning attitude which is symbolized by “Y”.
22
The method adopted under quantitative method approach for this study is survey. Survey research is most generally used method and considered as the most appropriate method to test the hypothesis (Elkaseh, Wong, & Fung, 2016). There are many types of survey; oral survey, written survey, and online survey. This study focuses on written survey. Written survey can be categorized as questionnaire, mail survey, or drop-off survey (Fowler, 2009). An online survey is used in this study. It ensures the respondents to respond the questionnaire in low cost and time-efficient way (Chang, Hajiyev, & Su, 2017).
This study uses SPSS V. 20 program as statistical analysis. To test the hypothesis, this study uses a linear regression model which is free of assumptions of the classical linear regression model. This study uses 1 independent variable; perceived usefulness and 1 dependent variable; students’ attitude on e-learning.
3.3 Population and Sample
According to the data from the Information Technology and Database Center of Ar-Raniry State Islamic University, there are 129 students of Department of English Language Education who are enrolled from class of 2012 and 2013 in even semester 2017/2018. Therefore, the population in this study is 129 students of Department of English Language Education. Hence, the number of students experienced e-learning from Nicenet.org are 109 students of Department of English Language Education. Those students have experienced e-learning class through Nicenet.org for each particular subject such as Writing III, Linguistics, Computer Assisted Language Learning, English Language Assessment, and Discourse Analysis. Finally, the sample for this study is 109
23
students of Department of English Language Education, Ar-Raniry State Islamic University.
Table 3.1 The Number of Active Students of Department of English Language Education , Ar-Raniry State Islamic University
No Academic Year Number of Students
Number of Students Experienced E-learning by Nicenet.org
1 2012 22 7
2 2013 107 102
Total 129 109
Source: Archive of Information Technology and Database Center, Ar-Raniry State Islamic University
3.4 Research Instrument
The research instrument used for this study is questionnaire. The type of questionnaire used is online questionnaire. Online questionnaire is more effective and easy to collect the data from the respondents. The questionnaire used is a closed-ended questionnaire by using Likert’s scale. The scale types used of the questionnaire is four-point scale; 1) strongly disagree; 2) disagree; 3) agree; 4) strongly agree. This questionnaire is adapted from Davis (1989), Gattiker and Hlavka (1992), Sun et al. (2006), Shahsavar (2012) and Chang, Hajiyev, & Su (2017). The question items consist of 40 questions; 26 questions related to students’ attitude as dependent variable items, 14 questions related to students’ perceived usefulness of the e-learning as independent variable items, and 3 questions related to respondents’ characteristics. The questions are related to the impact of students’ perceived usefulness toward their learning attitude of the e-learning.
24 3.5 Data Collection Techniques
The online questionnaire is created on Google Forms. To collect the data from participants, the link address of online questionnaire is distributed to the respondents via social media; Line, and WhatsApp. The respondents’ responses are examined to answer the research question. The result is analyzed by using Statistical Package for Social Science (SPSS V.20).
3.6 Data Analysis
3.6.1 Descriptive Statistic of Respondent Characteristics
Descriptive statistic of respondent characteristics is conducted to show and summarize the information of respondent characteristics (Sugiyono, 2012). This study summarizes the data percentage and data frequency. The summary of the data are measured by using SPSS V.20.
3.6.2 Descriptive Statistic
Descriptive statistic is conducted to measure and summarize the information of data distribution in each research variables (Sugiyono, 2012). This study provides the information of average, mean and standard deviation of the data. The information of the data distribution is measured by using SPSS V.20.
3.6.3 Instrument Validity and Reliability
1. Validity test is the extent to which an instrument measures what it is supposed to measure and performs as it is designed to perform. Validity test is also the extent to which the results of a study can be generalized from a sample to a population. The data collected from the
25
questionnaire need a high validity so that the data really describes the phenomenon to be measured.
The validity test used in this study is conducted statistically by using Pearson product-moment coefficient of correlation test on SPSS
version 20. The validity test of the questionnaire is based on the comparison of r-test and r-table score. The value of r-test is measured by finding the correlation value between alternative scores of respondents’ answer on certain question items and total item score in related variables. Furthermore, the r-test is compared with the critical value of r-table (r-product moment). If r-test ˃ r-table, the question item in a certain variable is declared valid and vice versa (Ghozali, 2005).
2. Reliability test is a tool to measure a reliability of questionnaire which is the indicator of a variable. A questionnaire is reliable if the responses of the questionnaire are consistent or stable over time. To measure the reliability of questionnaire, this study uses Cronbach Alpha test. This test is conducted only once to a group of respondents on each variable. The reliability score is considered reliable based on the coefficient of Cronbach alpha (α); > than 0.60 (Malhotra, 2011). If the reliability degree is greater than the coefficient of Cronbach alpha (α), the results show that the questionnaire a high level of accuracy and consistency (Ghozali, 2005).
26 3.6.4 Classical Assumption Testing
Classical assumption testing is conducted to fulfill the BLUE (Best Linear Unbiased Estimation) model criteria. To fulfill the classical assumption criteria of regression model in this study, the tests that should be conducted is normality test. Normality test is conducted to determine whether the distribution data of dependent and independent variable are normal, close to normal, or not (Gujarati, 2006). Normality testing can be done by Kolmogorov-Smirnov non-parametric statistical test (K-S) on SPSS V.20.
3.6.5 Hypothesis Testing
3.6.5.1Simple Linear Regression
Linear regression is a linear approach to a research modeling to examine the relationship between dependent variable and one or more independent variables. A research model that has one independent variable is called simple linear regression (Freedman, 2009). The relationship for this study can be modeled as:
Y = α + βX
Definition:
Y : Dependent Variable (Perceived Usefulness) α : Constant
β : Coefficient of Determination
27
To conduct simple linear regression on the research data, this study uses SPSS V. 20 to analyze the data and conclude the regression result. The result can be seen on coefficients regression table. The table of coefficient regression can be seen from the output of the linear regression test on SPSS V.20.
28 CHAPTER IV
RESEARCH FINDING AND DISCUSSION
This chapter explains and provides the research finding and research discussion. The research finding is derived from the data analysis of the questionnaire. The discussion is deliberated from the research finding of data analysis as a final result. The finding explanation is described and correlated to previous results of the previous studies.
4.1 Descriptive Statistic of Respondents’ Characteristics
The questionnaire is given to 109 students of Department of English Language Education, Ar-Raniry State Islamic University from Google Form. The questionnaire consists of three part questions; question related to respondents’ characteristic, students’ perceived usefulness, and students’ attitude. The respondents’ characteristics are identified in the table below:
Table 4.1 Descriptive Statistic of Respondents’ Characteristics
Frequency Percentage Gender: Male Female 36 73 33.03 66.97 Unit: 1 17 15.60 2 12 11.01 3 5 4.59 4 11 10.09 5 11 10.09 6 15 13.76 7 13 11.93 8 25 22.94
29
Table 4.1 shows that the respondents are dominated by female. There are 73 female students participated in this study. It equals 66.97% of total respondents. The male respondents are 36 students or equaled 33.03% of total respondents. The respondents also come from different units; unit 1 - unit 8. The number of students participated in this study is nominated by unit 8. It consists of 25 students or equals 22.94% of total respondents. In other hand, the lowest number of students participated in this study is 5 students of unit 3. It equals to 4.59% of total respondents.
4.2 Descriptive Statistic
Descriptive statistic measures and summarizes the information of data distribution for each of research variables (Sugiyono, 2012). This study provides the data value of mean and standard deviation. The result of descriptive statistic on SPSS 20 is shown in the table 4.2.
Table 4.2 Mean and Standard Deviation
Variable Mean Standard Deviation
Perceived Usefulness 2.982 0.534 Student Attitude 2.626 0.383
4.3 Descriptive Statistic of Perceived Usefulness
The result of respondents' responses to perceived usefulness can be seen in the table 4.3. The table provides the information of the responses in SD (Strongly Disagree), D (Disagree), A (Agree), and SA (Strongly Agree). Besides, it also shows the mean value of each question items.
30
Table 4.3 Descriptive Statistic of Perceived Usefulness No Questions
Perceived Usefulness: SD D A SA Mean
1 Using e-learning is useful in learning program. 4 11 57 37 3.17 2 Using the e-learning would allow me to
accomplish learning tasks more quickly. 1 12 56 40 3.24 3 Using e-learning would improve my learning
performance. 3 18 59 29 3.05
4 Using e-learning would enhance my
effectiveness in learning. 4 20 61 24 2.96
5 Using e-learning would increase my productivity
in learning. 6 11 61 31 3.07
6 Using e-learning gives me greater control over
my study 6 23 54 26 2.92
7 Using e-learning saves my time 4 19 50 36 3.08 8 Using e-learning allows me to accomplish more
tasks than would otherwise be possible 2 17 62 28 3.06
9 Using e-learning reduces the times I spend on
unproductive activities 6 20 54 29 2.97
10 Using e-learning improves the quality of study 4 20 53 32 3.04 11 Using e-learning makes me easier to study 9 12 50 38 3.07 12 E-learning supports critical aspects of my study 5 22 58 24 2.93 13 E-learning addresses my study-related needs 5 19 65 20 2.92 14 I feel difficult to learn without e-learning 22 46 29 12 2.28
Average 2.98
Table 4.3 shows that the average students’ response of perceived usefulness on e-learning is 2.98. Most of the respondents’ responses are in A (Agree). It shows that most of the respondents agree to the usefulness of e-learning in supporting their e-learning activity. Most of the responses in SD (Strongly Disagree) for the usefulness of e-learning are below 10% than all of the total responses. The highest mean value from 14 question items of perceived usefulness is “Using the e-learning would allow me to accomplish learning tasks more quickly”. The highest mean is 3.24. It shows that using e-learning help students to complete their tasks faster than regular learning in the classroom. In another hand, the lowest mean value from 14 question items of perceived usefulness is “I feel difficult to learn without e-learning”. The lowest mean is 2.28. It shows that the students are acceptable to learn without e-learning. The
31
brief illustration of total responses for perceived usefulness is represented in the figure 4.1.
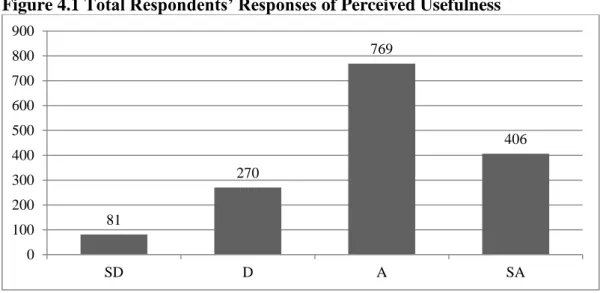
Figure 4.1 Total Respondents’ Responses of Perceived Usefulness
The bar chart provides the information of the total respondents’ responses on perceived usefulness of e-learning in Strongly Disagree (SD), Disagree (D), Agree (A), and Strongly Agree (SA). The total responses of perceived usefulness are 1526 responses. The highest number of total response is Agree (A) for 769 responses (50.39% of total responses). The total response of Strongly Agree (SA) is about half of the total responses for A (Agree); 406 responses. Hence, the lowest response is Strongly Disagree (SD); only 5.30% of total responses. Overall, the respondents’ responses to the usefulness of using e-learning in learning process are mostly agreed and strongly agreed. It shows that students have positive responses on perceived usefulness. Based on students’ positive responses, it indicates that students perceive the e-learning as useful tool to support their study.
81 270 769 406 SD D A SA 0 100 200 300 400 500 600 700 800 900
32
4.4 Descriptive Statistic of Students’ Attitude
The result of respondents' responses to students’ attitude can be seen in the table 4.4. The information of the responses in SD (Strongly Disagree), D (Disagree), A (Agree), and SA (Strongly Agree) are provided in the table 4.4. It also displays the mean value of each question items as well.
Table 4.4 Descriptive Statistic of Students’ Attitude
No Questions
Students’ Attitude: SD D A SA Mean
1 I believe that learning with e-learning is very difficult
34 42 25 8 2.06
2 I believe that learning with e-learning is very complicated
20 52 29 8 2.06
3 I believe that learning with e-learning requires technical ability
12 43 46 8 2.23
4 I believe that learning with e-learning lets me feel psychological stress very greatly
24 46 31 8 2.46
5 I believe that learning with e-learning can be done only if one knows a programming language such as basic
17 46 32 14 2.21
6 I believe that learning with e-learning is only advisable for people with a lot of patience
16 46 36 11 2.39
7 I believe that learning with e-learning makes a person more productive at his/her study
6 23 66 14 2.81
8 I believe that learning with e-learning is for people with the same age as mine only
29 27 40 13 2.34
9 E-learning makes the course more interesting to me
1 17 56 35 3.15
10 I need to take training to understand how to use e-learning
8 41 35 25 2.71
11 E-learning helps me to learn new words from my classmates’ postings
1 15 50 43 3.24
12 E-learning helps me to get new ideas from my classmates’ postings
2 12 51 44 3.26
13 I enjoy sharing my knowledge with my classmates on e-learning
6 14 45 44 3.17
14 Using e-learning in learning process is a waste of time
26 46 20 17 2.26
15 E-learning provides me opportunities that I have never tried before in traditional classrooms
5 10 54 40 3.18
16 I felt isolated when I participated in an e-learning class
30 47 21 11 2.12
17 It is easier for me to convey my thoughts through e-learning than to converse face-to-face with my classmates
9 33 50 17 2.69
18 Study through e-learning is quite boring 27 43 31 8 2.18 19 I am not the type to study well with e-learning 23 51 21 14 2.24 20 I prefer to study alone to study with my 10 46 39 14 2.52
33
classmates in an e-learning
21 E-learning helps me to communicate more with other students
8 25 50 26 2.86
22 I do not like to use e-learning 39 43 18 9 1.97 23 E-learning is good as a tool for discussing with
other students
9 10 67 23 2.95
24 It is easier to voice out my opinions through e-learning than to convey it face-to-face to my lecturer
9 24 50 26 2.85
25 I am motivated to read others’ postings 6 17 57 29 3.00 26 It is interesting to share my personal ideas with
others on e-learning
7 12 53 37 3.10
Average 2.63
Table 4.4 shows that the average response of students’ attitude on e-learning at Ar-Raniry State Islamic University is 2.63. Most of the respondents’ responses are in A (Agree). Those responses are related to the positive impressions after studying on the e-learning. It shows that most of the respondents experience positive impressions in e-learning activity. The highest responses in SD (Strongly Disagree) and D (Disagree) are dominated in question 22, “I do not like to use e-learning”. It shows that 82 of 103 total respondents like to use e-learning for their study. It equals 79.61% of total respondents with the lowest mean value; 1.97.
On the other hand, the highest mean value from 26 question items of students’ attitude is “E-learning helps me to get new ideas from my classmates’ postings”. The highest mean is 3.26. It shows that using e-learning help students easier to get new ideas from their peers’ posting on e-learning than regular learning. Overall, the respondents’ responses to students’ attitude after experiencing e-learning in learning process are positive impressions. The brief illustration of total responses for students’ attitude is represented in the figure 4.2 below.
34
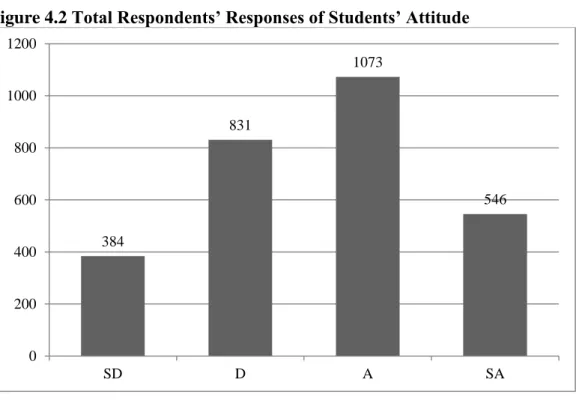
Figure 4.2 Total Respondents’ Responses of Students’ Attitude
The bar chart provides the information of the total respondents’ responses on students’ attitude after studying on e-learning in Strongly Disagree (SD), Disagree (D), Agree (A), and Strongly Agree (SA). The total responses of students’ attitude are 2834 responses. The highest number of total response is Agree (A) for 1073 responses (37.86% of total responses). The total response of Strongly Agree (SA) is 546 or about half of the total responses for A (Agree). The total response of Strongly Disagree (SD) is 384 or about half of Disagree (D). Overall, the respondents’ responses to the students’ attitude are mostly agree. It shows that students have positive impressions after using e-learning in learning process. 384 831 1073 546 SD D A SA 0 200 400 600 800 1000 1200
35
4.5 Instrument Validity and Reliability Test
This study examines the validity of questionnaire by using Pearson product-moment coefficient of correlation test on SPSS version 20. The test is conducted by comparing the r-test and r-table score (r-product moment). R-test ˃ r-table for each question item indicates that the item in questionnaire is valid and
vice versa. Besides, this study examines the reliability test by using Cronbach Alpha test. The coefficient of reliability test > Cronbach alpha (α) (0.60) indicates that the questionnaire has a high level of accuracy and consistency (Ghozali, 2005).
4.5.1 Instrument Validity Test
The result of Pearson product-moment coefficient of correlation test on SPSS 20 for each of the question items is described in the table 4.5. The table provides the information of coefficient of correlation for each of question items. It also displays the critical value (5%) for N=103 and the result of validity test.
Table 4.5 The Result of Validity Test
No Question Items Variables Coefficient of Correlation Critical Value 5% (N=103) 1 X1 X 0.698 0.194 Valid 2 X2 0.581 Valid 3 X3 0.755 Valid 4 X4 0.779 Valid 5 X5 0.750 Valid 6 X6 0.733 Valid 7 X7 0.708 Valid 8 X8 0.640 Valid 9 X9 0.679 Valid 10 X10 0.720 Valid 11 X11 0.801 Valid 12 X12 0.737 Valid 13 X13 0.687 Valid 14 X14 0.397 Valid 1 Y1 Y 0.625 0.194 Valid 2 Y2 0.577 Valid
36 3 Y3 0.530 Valid 4 Y4 0.517 Valid 5 Y5 0.530 Valid 6 Y6 0.573 Valid 7 Y7 0.291 Valid 8 Y8 0.527 Valid 9 Y9 0.281 Valid 10 Y10 0.675 Valid 11 Y11 0.369 Valid 12 Y12 0.355 Valid 13 Y13 0.264 Valid 14 Y14 0.506 Valid 15 Y15 0.360 Valid 16 Y16 0.629 Valid 17 Y17 0.416 Valid 18 Y18 0.450 Valid 19 Y19 0.560 Valid 20 Y20 0.390 Valid 21 Y21 0.378 Valid 22 Y22 0.301 Valid 23 Y23 0.271 Valid 24 Y24 0.509 Valid 25 Y25 0.360 Valid 26 Y26 0.412 Valid
The critical value of the Pearson Product-Moment Correlation Coefficient of this study has the level significance of 5% (sig α = 0.05) and the degree of freedom of this study is (df = N - 2), where N is the total number of respondents; Df = N – 2, (Df = 103 – 2; Df = 101). Therefore, the r-table Pearson Product Moment with critical value 5% (N = 103) in this study is r-table = 0.194. Based on the table 4.5, the coefficient of correlation or r-test for each question items in each variables exceeds the critical value (r-table); the coefficient of correlation > critical value (r-table) product moment (0.194). Therefore, the entire question items on the questionnaire used in this study are valid.
4.5.2 Instrument Reliability Test
The reliability of the questionnaire used in this study is described in this part. The result of Cronbach Alpha test on SPSS 20 for each question items is described
37
in the table 4.6. The table shows the value of coefficient Cronbach’s Alpha. The result of the reliability test is provided as well.
Table 4.6 The Result of Reliability Test
No Variable Total
Items
Cronbach’s Alpha
Coefficient α
1 Students’ Perceived Usefulness 14 0.914 0.60 Reliable 2 Students’ Attitude 26 0.841 0.60 Reliable
The table 4.6 shows the result of reliability test from the questionnaire. The coefficient of Cronbach’s Alpha for each variable is 0.914 and 0.841. The coefficient Cronbach’s Alpha of both variables have bigger values than α (0.60); coefficient of Cronbach’s Alpha > α. Consequently, all of the question items from the questionnaire in this study are reliably.
4.6 Classical Assumption Testing
The model used in this study fulfills the classical assumption criteria of regression model. The classical assumption test conducted in this study is normality test. The test is aimed to test the data distribution (Gujarati, 2006). One of normality test on SPSS V.20 is Kolmogorov-Smirnov non-parametric statistical test (K-S).
4.6.1 Normality Test
This study examines the normality of the data by conducting normality test. The test is used to determine whether the data of each research variables is distributed in normal, close to normal, or not (Gujarati, 2006). This study measures the normality of data by using Kolmogorov-Smirnov non-parametric
38
statistical test (K-S). To determine the normality of data by using Kolmogorov-Smirnov test, Ghozali (2013) states that if the value of asymptotic significance 2– tailed > 0.05, the data is distributed normally and vice versa. The result of normality test is shown in the table 4.7.
Table 4.7 One-Sample Kolmogorov-Smirnov Test before Trimming Process Unstandardized Residual
N 109
Normal Parametersa,b Mean 68.3119266 Std. Deviation 1.85968451 Most Extreme Differences Absolute .093 Positive .051 Negative -.093 Test Statistic .093
Asymp. Sig. (2-tailed) .022c
The non-parametric Kolmogorov-Smirnov (K-S) test is required a normal data distribution on the residual values. Based on the table 4.7, the unstandardized residual of asymptotic significance (2–tailed) N = 109 is 0.022 < 0.05; the data are not normally distributed. Therefore the data is required to do treatment in order to have a normal data distribution. Grubbs (1969) states the mechanism that can be used for data distribution problem is to do trimming method or removing outlier. The outlier is the data observation of a research that is far from the other data observations (Grubbs, 1969). The data is categorized as outlier when the standardized score (Z Score) of the data is more than 3 to 4; for the sample number more than 80 observations (Hair et al., 1998: p.65). To categorize data outliers, the standardized scores are shown in the table 4.8.
39 Table 4.8 Standardize Score (Z Score)
No Z Score No Z Score No Z Score
1 -0.567 41 -0.033 81 -0.467 2 -0.999 42 -0.060 82 -0.718 3 0.037 43 -0.794 83 -0.769 4 0.213 44 3.470 84 -0.592 5 0.468 45 0.519 85 -0.746 6 -0.087 46 3.066 86 -0.002 7 -0.696 47 4.466 87 0.087 8 0.119 48 -0.690 88 -0.090 9 0.190 49 -0.517 89 -3.128 10 0.798 50 0.090 90 -0.115 11 0.369 51 -3.268 91 -0.899 12 -0.028 52 0.090 92 -0.746 13 0.137 53 -0.970 93 -0.643 14 0.112 54 0.568 94 -0.115 15 -3.245 55 0.902 95 -0.796 16 -0.340 56 -0.038 96 0.040 17 0.998 57 -3.707 97 0.090 18 0.592 58 -0.543 98 0.443 19 0.894 59 -0.769 99 -0.592 20 0.483 60 -0.442 100 0.136 21 -0.272 61 0.858 101 0.832 22 -0.517 62 -0.164 102 -0.139 23 0.466 63 0.889 103 3.820 24 -0.137 64 0.240 104 -0.777 25 0.772 65 -0.064 105 0.190 26 -0.139 66 0.295 106 0.114 27 -0.690 67 0.010 107 0.300 28 0.266 68 0.493 108 -0.593 29 0.492 69 0.493 109 -0.147 30 -0.466 70 0.010 31 -0.844 71 -0.545 32 -0.643 72 0.974 33 0.974 73 0.721 34 -0.292 74 0.420 35 4.847 75 -0.642 36 -0.922 76 0.340 37 -0.269 77 0.190 38 -0.647 78 0.766 39 0.040 79 -0.753 40 -0.291 80 0.267
40
Table 4.8 shows that there are 6 responses with Z score more than 3 to 4. Those respondents are respondent 15, 35, 44, 46, 47, 51, 57, 83, and 103. Therefore, a trimming process is conducted to exclude the outliers from the observation in this study. Consequently, those 6 respondents have been excluded from this study. Finally, the number of observations is left 103 from 109 observations. The test result of normality test after trimming process is shown in Table 4.9 below:
Table 4.9 One-Sample Kolmogorov-Smirnov Test after Trimming Process Unstandardized Residual
N 103
Normal Parametersa,b Mean 0E-7 Std. Deviation 7.81975651 Most Extreme Differences Absolute .066
Positive .066 Negative -.040 Kolmogorov-Smirnov Z .665 Asymp. Sig. (2-tailed) .768
After conducting the trimming process, the test result of normality test shows that number of total observation is decreased; N = 103 from N = 109 (compare N number in table 4.7 and table 4.9). Hence, table 4.9 shows the unstandardized residual of asymptotic significance (2–tailed) N = 103 is 0.768 > 0.05. It can be concluded that the data of this study are normally distributed.
4.7 Hypothesis Testing 4.7.1 Simple Linear Regression
The result of simple linear regression model in this study is examined by computer software IBM SPSS 20. It analyzes the effect of perceived usefulness of the e-learning on students’ attitude after experiencing the e-learning. The output
41
of SPSS shows the regression result. Based on the table 4.10, the coefficient of regression table, the result of this study is concluded. The result is shown in the table 4.10.
Table 4.10 Coefficient of Regression Coefficientsa
Model Unstandardized Coefficients Standardized Coefficients B Std. Error Beta
1 (Constant) 65.814 4.686
X .037 .111 .034
a. Dependent Variable: Y
Based on the research result of simple linear regression in the table 4.10, therefore the result can be transformed into the research model as:
Y = α + βX (I) Y = 65.814 + 0.037X (II) 4.7.2 Result
Based on the simple linear regression model (II), the result of hypothesis testing in this study is interpreted from the prediction of the equation below.
Y = 65.814 + 0.037X (II) 1. Constant (α)
The constant in the model is 65.814. Therefore, the students’ attitude is predicted to be 65.814 when perceived usefulness as an independent variable in this study is zero or constant.