A Direct Ridership Model for Rail Rapid Transit in Canada Matthew Durning A Thesis in The Department of
Geography, Planning and Environment
Presented in partial fulfillment of the requirements for the degree of Master of Science (Geography, Urban and Environmental Studies) at
Concordia University Montréal, Québec, Canada
September 2015 © Matthew Durning, 2015
CONCORDIA UNIVERSITY School of Graduate Studies
This is to certify that the thesis prepared
By: Matthew Durning
Entitled: A Direct Ridership Model for Rail Rapid Transit in Canada
and submitted in partial fulfillment of the requirements for the degree of
Master of Science (Geography, Urban and Environmental Studies)
complies with the regulations of the University and meets the accepted standards with respect to originality and quality
Signed by the final Examining Committee:
________________________________________________ Chair Dr. Pascale Biron ________________________________________________ Examiner Dr. Luis Miranda-Moreno ________________________________________________ Examiner Dr. Zachary Patterson ________________________________________________ Supervisor Dr. Craig Townsend Approved by ___________________________________________ Dr. Monica Mulrennan Chair of Department ___________________________________________ Dr. André Roy
Dean of Faculty of Arts and Science
iii
Abstract
A Direct Ridership Model for Rail Rapid Transit in Canada Matthew Durning
Rail rapid transit forms the backbone of many public transportation systems in cities globally moving people at both high speed and at high capacity. As cities seek to alleviate problems of congestion and environmental pollution many are constructing or expanding urban and suburban rail networks including in Canada where in 2015 numerous projects were underway or recently completed. Traditionally travel choices have been considered to be products of time and monetary cost academics and researchers have resented strong evidence also linking travel behaviour to factors including the built environment, station amenities, and street networks. This thesis links local station level factors, including built form, street network, station amenities and service, and socioeconomic characteristics, and rail rapid transit ridership in Canada. A direct ridership model (DRM) approach is used with OLS, robust, and two-stage least squares regression and bootstrapping is used to enhance the models. Data was collected for from 342 station locations in Canada’s five largest metropolitan areas with an average weekday ridership of over 3 million. Average weekday station boardings were used as the dependent variable and 53 socioeconomic, built environment, and system attributes were chosen as potential explanatory variables that were chosen after a review of the DRM and travel demand literature. The study yielded three sets of models with an adjusted r-squared values ranging between 0.650 and 0.864. Canadian rail rapid transit stations were tested together and separately as urban and suburban service types. The most important factor identified in the models was the supply of transit service, followed by inter-modal connections (bus stops for urban stations and primarily parking for suburban stations), and residential population density. Socioeconomic factors of the
population in the area surrounding stations were not found to be significant. The absence of socioeconomic variables in the final model indicates that planners and policy makers have significant scope to exert influence over transit use through land use planning, design, and service features.
iv
Contents
Contents ... iv
List of Tables ... vi
List of Figures ... vii
List of Equations ... viii
1. Introduction ... 1
1.1. Background ... 1
1.2. Summary ... 11
2. Literature Review... 12
2.1. A Brief History of Urban Transport ... 12
2.2. Direct Ridership Models ... 19
2.3. Station Access and Catchment Areas ... 29
2.4. Socioeconomics ... 31 2.5. Internal Factors ... 32 2.6. Urban Form ... 35 3. Methods... 37 3.1. Catchment Areas ... 37 3.2. Dependent Variable ... 40 3.3. Independent Variables ... 41 3.3.1. Socioeconomics ... 41
3.3.2. Station and Network ... 42
3.3.3. Neighbourhood and Street Network ... 43
3.3.4. Service... 47
v
3.4.1. OLS ... 50
3.4.2. 2SLS ... 53
3.4.3. Bootstrapping ... 54
3.5. Model Development Process ... 54
4. Model Results ... 57
4.1. All Stations Models ... 57
4.1.1. Suburban Station Models... 70
4.2. Urban Stations Models ... 76
5. Conclusions and Recommendations ... 84
5.1. Summary of Results and Recommendations ... 84
5.2. Study Limitations and Future Research ... 88
References ... 89
Appendix A ... 108
Appendix B ... 125
Appendix C ... 134
vi
List of Tables
Table 1 – List of Canadian Rail Rapid Transit Systems ... 4
Table 2 - DRM Literature Review Summary ... 22
Table 3 - Station Access Mode Share by Transit Operator ... 29
Table 4 - Variable Descriptions ... 48
Table 5 - All Stations OLS and Weighted OLS Models VIF Scores... 58
Table 6 - All Stations Unweighted OLS Model with Bootstrapped Estimates ... 60
Table 7 - All Stations Unweighted Spatial Lag and Spatial Error Models ... 61
Table 8 - All Stations Weighted OLS Model with Bootstrapped Estimates ... 63
Table 9 - All Stations Instrumental Model with Bootstrapped Coefficient Estimates ... 65
Table 10 - All Stations Instrumental Spatial Lag and Spatial Error Models ... 66
Table 11 - Elasticity Estimates for All Stations Models ... 66
Table 12 - Unweighted Suburban OLS Model ... 71
Table 13 – Suburban Unweighted Spatial Lag and Spatial Error Models ... 72
Table 14 – Suburban Stations OLS and Weighted OLS Models VIF Scores ... 72
Table 15 - Weighted Suburban Stations OLS Models with Bootstrapped Estimates ... 73
Table 16 - Comparison of Bootstrapped Elasticity Estimates for Suburban Stations Models ... 74
Table 17 - Urban Stations OLS and Weighted OLS Models VIF Scores ... 76
Table 18 - Unweighted Urban Stations OLS Model with Bootstrapped Estimates ... 77
Table 19 - Urban Stations Spatial Lag and Spatial Error Models ... 78
Table 20 - Weighted Urban Stations OLS Models with Bootstrapped Estimates ... 79
Table 21 - Weighted Instrumental Variable Model for Urban Stations with Bootstrapped Estimates ... 80
Table 22 - Urban Stations Instrumental Spatial Error Model ... 81
Table 23 - Comparison of Elasticity Estimates for Bootstrapped Unweighted OLS and Weighted OLS and Instrumental Variable Urban Stations Models ... 81
vii
List of Figures
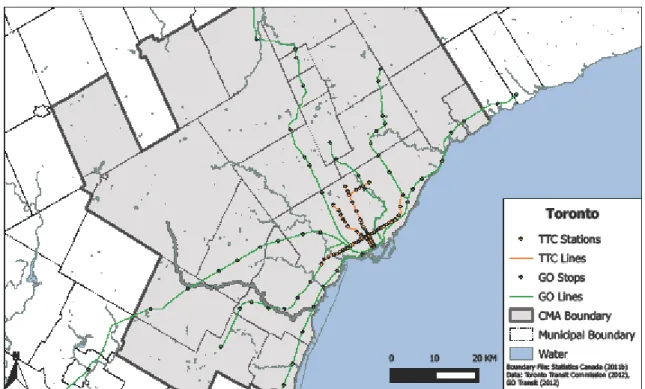
Figure 1 – Map of Toronto... 6
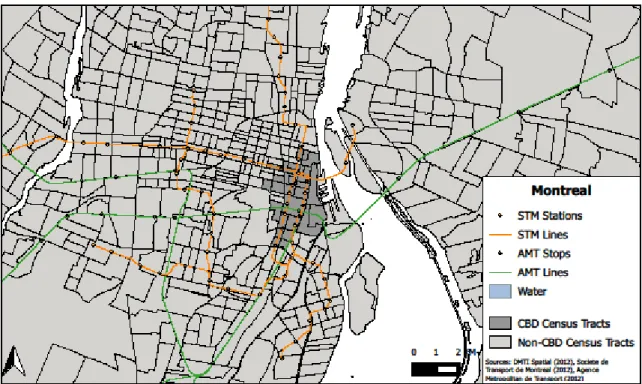
Figure 2 – Map of Montréal ... 6
Figure 3 – Map of Vancouver ... 7
Figure 4 – Map of Calgary ... 7
Figure 5 – Map of Edmonton ... 8
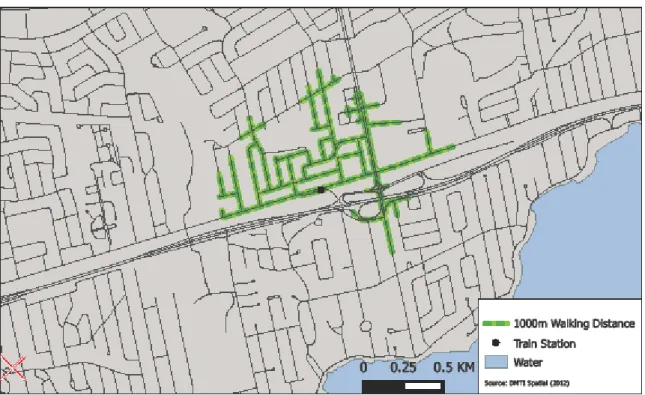
Figure 6 - 1000m Service Area before Addition of Footpaths ... 39
Figure 7 - 1000m Service Area after Addition of Footpaths ... 39
Figure 8 - Average Weekday Boardings by City ... 41
Figure 9- System Maps ... 43
Figure 10 - Montréal CBD Map... 46
Figure 11 - Toronto CBD Map ... 46
Figure 12- Histogram of Boardings for All Stations ... 55
Figure 13 - Histogram of Boardings after Transformation for All Stations ... 56
viii
List of Equations
Equation 1 – Entropy Index ... 36
Equation 2 – Land Use Mix Index ... 36
Equation 3 – Walkability Index ... 36
Equation 4 – Cut-Off Value for Cook’s Distances ... 52
Equation 5 – Elasticity Calculation for Log-Transformed Response Variables ... 63
Equation 6 – Elasticity Calculation for Non-Transformed Response Variables ... 63
1
1.
Introduction
1.1.Background
Rail rapid transit forms the backbone of many public transportation systems in cities globally; it moves people at both high speed and high capacity. Rail rapid transit in this context refers to fixed guideway public transit system operating in exclusive or shared rights of way, and includes subways, light rail transit (LRT), heavy suburban rail, and elevated rail. Rail rapid transit, and public transit in general, has many benefits when compared with private motorized
transportation. Mobility (the potential for movement) and accessibility (the potential for
interaction) can be provided with less traffic and better public health as a result of more walking and less pollution. Transit can also be cost effective in providing mobility and accessibility as it does not require the vast amounts of roads, highways, parking, and energy that automobiles do. Shifting the share of travel from automobiles to transit is one way of reducing air pollution and greenhouse gas emissions. Indirectly, transit can also encourage economic growth and urban growth leading to agglomeration economies caused by clustering and densification (Chatman & Noland, 2014). Finally, in terms of social justice, public transit can also ensure a more equitable distribution of transportation resources and access (Deka, 2004).
Despite the negative effects of automobile use and the potential benefits of transit in Canada, roughly only 20% of people living in urban areas use transit to commute to work in 2011
(Statistics Canada, 2013). Toronto and Montréal had the highest transit mode shares (23.3% and 22.2% respectively), followed by Ottawa-Gatineau (20.1%), Vancouver (19.7%), Calgary
(15.9%), Winnipeg (13.4%), Halifax (12.5%), and Edmonton (11.3%) (Statistics Canada, 2013). Reasons for the relatively low transit commute shares in Canada’s largest cities compared to that of private automobiles include low residential densities and low levels of transit provision outside of city cores, attitudes towards transit use, and long transit commute times (Turcotte, 2011). The fact that transit commute times in Canadian cities are significantly longer than those for automobiles (44 minutes vs. 27 minutes on average in Canada’s largest cities) indicates that transit service does not, in most cases, compete in terms of travel times (Turcotte, 2011). This is likely a major contributing factor that has made large numbers of people reliant on automobiles, often used at low capacity, generating considerable congestion at peak hours. Automobile
2
dependence has also grown globally with countries such as Sweden, France, Germany, and the United Kingdom, reaching levels of automobile ownership and use approaching those found in the United States (Handy, 2002). This trend, however, may be on the decline, with some researchers suggesting that automobile use in industrialized countries has slowed or halted in terms of growth (Jones, 2014; Millard-Ball & Schipper, 2011).
While transit usage is generally higher in Canada compared with the United States, Canada’s transit share is small compared with most other high income countries (Stantec Consulting Ltd. & Victoria Transport Policy Institute, 2011). Despite higher transit use, average commute times in Canada’s largest cities are comparable to those south of the border (Statistics Canada, 2013). In 2011, Toronto had the longest average automobile commute times in Canada at 29.3 minutes, while the longest in 2011 in the United States was found in the New York-Northern New Jersey-Long Island metropolitan area at 29.02 minutes (Statistics Canada, 2013; U.S. Census Bureau, 2014a, 2014b). Transport Canada (2006) estimates the direct costs of congestion in terms of delay, emissions, and wasted fuel at $2.3 billion to $3.7 billion for Canada’s nine largest urban regions. The C.D. Howe Institute (Dachis, 2013) estimates a $1.5 billion to $5 billion in congestion costs for the Toronto region alone due to economic externalities such as foregone income and clustering, and agglomeration benefits. The effects of congestion are also not spread evenly, with 80% of the total costs coming from Canada’s largest cities, 42.5% for Toronto, 20.6% for Montréal, and 16.6% for Vancouver (COMT, 2012). Population growth in the largest metro areas and increasing private automobile ownership rates are likely to continue the trend of increased congestion and associated costs (Transport Canada, 2006). Increasingly, governments at the provincial, regional, and municipal levels are seeking strategies to remediate automobile congestion and transportation issues have become important debates in political campaigns. As awareness of transportation issues on the part of the public increases and the need to replace aging transport infrastructure in many Canadian cities grows, a major opportunity exists to plan and build in more sustainable ways.
Evidence suggests that increasing road infrastructure is an ineffective means to reducing traffic congestion as it reduces the cost of automobile travel and induces new demand, resulting in traffic congestion returning to similar levels (Duranton & Turner, 2011). Therefore new strategies including new transit infrastructure and improved transit service that aim to reduce
3
congestion, increase accessibility, and limit the harmful effects of automobile emissions are required. McIntosh et al. (2014) have suggested in a global analysis of travel behaviour that the provision of rail-based transit has a strong relationship with decreased automobile travel. Baum-Snow & Kahn (2000) have also shown that increasing proximity to transit service can also increase transit commuting. Kohn (2000) observed that service cuts made by transit agencies in some Canadian cities in the 1990s contributed to a decrease in riders. Given this evidence, the recent trend of increased transit funding for operations and capital investments in Canada are encouraging. There are currently eight rail rapid transit projects under construction or recently completed in Canada: Vancouver’s Evergreen Line, Edmonton’s Metro Line, the Waterloo Region’s Ion LRT, Toronto’s York-Spadina Subway Extension, Eglington Crosstown LRT, Toronto’s Union-Pearson Airport train, Ottawa’s Confederation Line LRT, and Montréal’s Train de l’Est, which will add a total of 109.7 km of new track and 78 new stations. The Canadian Urban Transit Agency (CUTA) in 2012 estimated that the estimated cost of transit infrastructure plans in Canada for 2012 to 2016 were $53.3 billion, while existing funding sources only
amounted to $40 billion (Felio, 2012). The New Building Canada Plan announced by the federal government in 2013 will provide $53 billion in infrastructure investments over 10 years,
although investments are not limited to transit projects (CUTA, 2014). Despite these new infrastructure investments funding for transit, and equally important integrated land use policies, still fall short of the level necessary to effectuate large scale changes in travel behaviour. The history of rail rapid transit began in Canada in 1954 when Toronto opened its first subway line. Canadian cities began to transition from bus- and streetcar-based systems to urban rail rapid transit soon after. Montréal inaugurated its Metro in 1966, followed by Edmonton’s (1977) and Calgary’s (1982) light rail, and Vancouver’s elevated SkyTrain (1986). Overall transit ridership over this period grew steadily from less than 1.1 billion passengers annually in 1970 to 1.53 billion in 1990, when it began to decline (Kohn, 2000). Suburbanization, the falling cost of automobile travel, and cuts to funding and service are likely to have played a role in this decline by eroding any advantage transit may have had in terms of convenience and travel time
competitiveness (Kohn, 2000). More recent data suggests that transit use had rebounded in Canada and reached over 2 billion passengers in 2012 (CUTA, 2012). After several years of decline, transit ridership began to rebound in Toronto in 1999, Vancouver in 2000, and Montréal in 2003 (Agence Métropolitaine de Transport, 2008; Toronto Transit Commission, 2003;
4
TransLink, 2013). This was matched by a 9.5% increase in its supply (measured as total vehicle kilometres) between 2008 and 2012 and the initiation of several new rail transit infrastructure services or expansions (CUTA, 2012). In North America in general, the 1990s marked a turning point in the direction of transit ridership. Allen & Levinson (2014) present evidence that
indicates that since then, ridership on commuter rail service, in terms of commuter rail distance travelled, has outpaced the growth of highway vehicle distance travelled. They attribute this success in part to the adoption of higher capacity trains, faster service, off-peak scheduling, and the growth of park-and-ride lots. All of these are elements that help to increase the accessibility and convenience of transit for growing suburban populations.
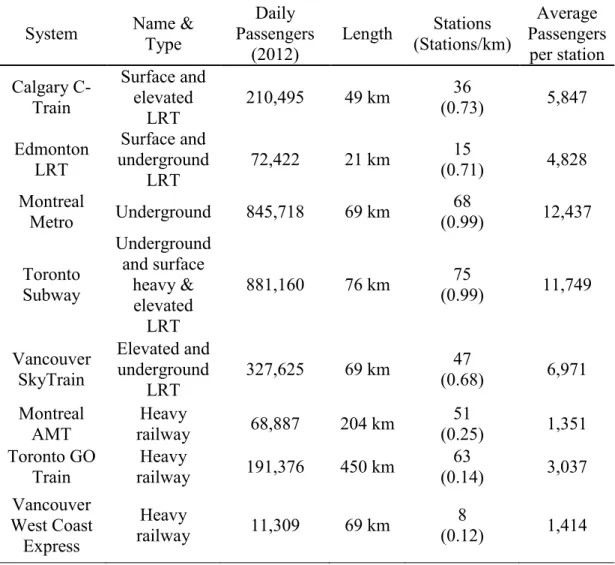
Table 1 – List of Canadian Rail Rapid Transit Systems
System Name & Type
Daily Passengers
(2012)
Length (Stations/km) Stations
Average Passengers per station Calgary C-Train Surface and elevated LRT 210,495 49 km 36 (0.73) 5,847 Edmonton LRT Surface and underground LRT 72,422 21 km (0.71) 15 4,828 Montreal Metro Underground 845,718 69 km (0.99) 68 12,437 Toronto Subway Underground and surface heavy & elevated LRT 881,160 76 km (0.99) 75 11,749 Vancouver SkyTrain Elevated and underground LRT 327,625 69 km 47 (0.68) 6,971 Montreal
AMT railway Heavy 68,887 204 km (0.25) 51 1,351 Toronto GO
Train railway Heavy 191,376 450 km (0.14) 63 3,037 Vancouver West Coast Express Heavy railway 11,309 69 km 8 (0.12) 1,414
5
The purpose of this study is to determine station-level and network factors that influence transit ridership in Canadian cities and to quantify their effects. Factors at the station level, particularly those related to the built environment and station amenities, have the potential to influence demand for transit and a better understanding of the magnitude of their effects will help to better plan new transit projects and improve existing ones. One means of assessing the influence of these factors is through the use of Direct Ridership Models (DRMs) which typically use a set of variables found within a given distance of a station to estimate ridership at the stop, line, or system level.
The scope of this study are the areas immediately surrounding rail rapid transit stations in Canada’s five largest metropolitan regions: Toronto, Montréal, Vancouver, Calgary, and Edmonton. Each city has at least one form of rail rapid transit; a summary of system characteristics can be found in Table 1 and maps of each city in Figure 1-5.
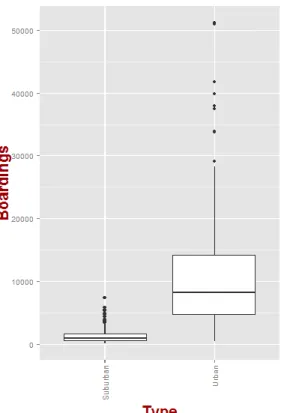
Rail rapid transit in Canada encompasses a number of technologies from diesel or electric locomotive driven suburban services to subways, light rail on reserved right of way and mixed with traffic, and elevated trains. They also vary significantly in terms network length, stop density, service frequency, and average boardings per station. As a result, two major functional classifications are used for this study: suburban rail and urban rail, which generally serve two distinct purposes. Suburban rail is oriented towards commuter service, often exclusively, and serves to connect outlying areas directly to the downtown with the bulk of service at peak hours. Urban service, on the other hand, serves a more diverse purpose with higher frequencies, all-day service, more interconnections, and denser stop spacing. Montréal’s AMT, Toronto’s GO and Vancouver’s West Coast Express train services fall into the suburban rail category, while the Calgary C-Train, Edmonton LRT, Vancouver SkyTrain, Montréal Metro, and Toronto Subway are considered urban. Both forms are examined together and in separate models in an effort to highlight any effects specific to either type of service. Temporally, station boarding data was collected for 2012 and all other data was collected for dates as close as possible. Socioeconomic data comes from the 2011 Canadian Census and National Household Survey and jobs figures are from the 2006 Canadian Census.
6
Figure 1 – Map of Toronto
7
Figure 3 – Map of Vancouver
8
Figure 5 – Map of Edmonton
The shift towards more transit use in Canadian cities can be attributed to factors related to the increasing cost of automobile travel (e.g. increasing fuel costs), transit service improvements, and greater acceptance of transit particularly among younger segments of the population (Turcotte, 2011). Land use planning and policy can also affect behaviour to favour collective and active modes thought changes to neighbourhood and street designs. As a result, a number of planning movements and theories such as Transit Oriented Development (TOD), Smart Growth, and New Urbanism have emerged as approaches to designing cities with an aim to reduce automobile dependence and increase active and transit mode share.
TOD refers to planning around transit for existing and future stations, aiming to generate
ridership and capitalize on development encouraged by proximity to a transit station (Calthorpe, 1990, 1993). It can also be used to describe the actual physical environment of station areas. TODs generally aim to create mixed-use, high density, and accessible neighbourhoods around stations to facilitate transit use and walking, and to discourage automobile travel (Cervero, Ferrell, & Murphy, 2002). New Urbanism and Smart Growth refer to broader urban design movements that emphasize walkable communities with a mixture of land uses developed in
9
reaction to automobile induced urban sprawl (Calthorpe, 1990, 1993; Duany & Plater-Zyberk, 1994; Duany & Talen, 2002).
The application of TOD principles is not new to Canada; the developments surrounding stations of the Yonge Subway line in Toronto in the 1950s and 60s can be seen as early examples of the creation of supportive neighbourhoods (CUTA, 2004). Official plans for
transit-supportive, pedestrian friendly, dense, and diverse neighbourhoods also appear in planning documents prepared by the City of Ottawa (RMOC Planning Department, 1973) and the Greater Vancouver Regional District (GVRD, 1975) as early as the 1970s. TOD principles have since become common in Canadian urban planning practice and elements have been adopted to varying degrees in many station area developments. The Canada Mortgage and Housing
Corporation (CMHC) examined 10 TOD applications in Canadian cities, finding a wide range of development sizes (0.45ha to 73ha), housing types (single-family homes to high-rise towers), pedestrian connectivity features, and land use mix (CMHC, 2009). What remained constant, however, was the fact that residents owned fewer automobiles, drove less, and used transit more in these developments (CMHC, 2009). Another common theme among the case studies was the lack of involvement on the part of the local transit agency itself in the planning of these projects, perhaps indicating a greater need for the involvement of transit agencies not only in the provision of service, but also in land use and development planning.
Planning for transit and, specifically, in immediate station areas has thus been a major focus in transit infrastructure decisions, but their application and their success vary depending on location (CMHC, 2009). Filion & Kramer (2012) have argued that the support for urban intensification and a reduction in automobile dependence in planning policies of the six largest metropolitan regions in Canada is an indication of the adoption of Smart Growth and New Urbanist principles. Further, they argue that most of the six regions have adopted “nodal” development typical of TOD. Generally it has been found that TOD and neighbourhoods that emphasize
transit-supportive density, diversity, and design can achieve higher rates of transit use and active mode share, while reducing automobile travel (Evans et al., 2003).
As transit is seeing a resurgence in popularity among users and increasing government support understanding what may influence transit ridership at the station level can be useful for planners. As a result, transit agencies and planners seek to optimize the resources allocated to them. One
10
means to achieving this goal is to use available data and technology to better understand which local factors influence transit use to better plan new infrastructure investments. Traditional four-stage travel demand models estimate travel flows between traffic analysis zones (TAZs) by first estimating the number of trips originating in each TAZ, distributing the trips between TAZs, estimating mode choice of travellers, then assigning traffic to the travel networks (Cervero, 2006). Four-stage demand models can accurately predict commuting flows at a regional scale and are an essential element of long term transit planning but are not capable of assessing the role of small scale design and land use factors (Cervero, 2006; Usvyat, Meckel, DiCarlantonio, & Lane, 2009). They are also data-intensive and require specialized knowledge to derive accurate results. A Transit Cooperative Research Program (TCRP) survey found that out of 36 transit agencies across North America that responded, only 51% used four-stage models (Boyle, 2006). Data quality, accuracy, and availability were among major concerns of respondents and it is reported that several agencies at the time were in the process of developing new tools to better assess local scale factors influencing transit use (Boyle, 2006). Four-stage models are still seen as an effective means to plan in the long term at a regional scale but impractical for smaller scale changes where professional judgement, rules of thumb, and service elasticities are widely
employed (Boyle, 2006; Chatman et al., 2014).
One alternative to four-stage modelling is station level modelling, also known as direct ridership modelling (DRM), which uses ridership as a measure of transit demand, DRMs have been developed to better guide the transit planning process at the local scale and to define the factors that have the greatest potential to influence ridership. Transit planners in the United States interviewed by Chatman et al. (2014) as part of the development of project level and regional scale ridership models indicate that these types of models will be beneficial in future planning. To this date most ridership models have been conducted in the United States. Thus there is an academic base of knowledge on what influences transit ridership in the United States. It is likely, given the different historical development processes, roles of government, and social structure that some of the factors that influence travel behaviour vary between Canada and the United States. For example, race or ethnicity appears to play an important role in transit use in many US studies (e.g. Chu, 2004; Dill et al., 2013; Ryan & Frank, 2009; Chow et al., 2003) where racial segregation is stronger than in Canada (Walks & Bourne, 2006)
11
The goal of this study is to develop a direct ridership model in order to predict station-level boardings with a variety of socioeconomic, built environment, station, and network
characteristics mostly within walking catchment areas around stations. A secondary goal is to develop separate models for urban rail rapid transit and suburban commuter rail to see if different station-level factors are influential. Finally, this project also aims to make
recommendations that could be used to produce greater ridership, better situate planned transit stations, and improve existing ones.
1.2.Summary
Chapter 2 provides a review of the travel demand literature and a summary of the DRMs surveyed for this project. This is followed by a summary of important factors associated with ridership: socioeconomics, internal factors, built form, and station access. Finally, statistical methods used for this analysis are discussed.
Chapter 3 presents the methodology used in this study describing how catchment areas were determined, which variables were used and how they were collected, the statistical methods employed in the analysis, and the steps of the modelling process.
Chapter 4 presents the models that were developed and provides a discussion of the findings. Chapter 5 discusses the implications of the findings presented in Chapter 4 and policy
recommendations, as well as outlines the limitations of the research and proposals for future improvements.
12
2.
Literature Review
This section reviews the literature analysing links between factors associated with transit usage including the built environment, socioeconomics, and service supply. It also provides a
summary of the DRM approach and a survey of published DRMs. Section 2.1 - A Brief History of Urban Transport provides a general overview of the ways in which travel and built form are linked through a history of urban development and its relation to transportation technology and contemporary research on the topic. Section 2.2 - Direct Ridership Models describes the DRM approach and the links it with the broader travel and built environment research. A fundamental component of DRMs is the delineation of station catchment areas, typically a walking distance from a station, which is addressed in Section 2.3. Finally, sections 2.4 to 2.6 review in detail studies of factors influencing transit use, divided into three categories: socioeconomics, internal factors, and urban form. Section 2.4 - Socioeconomics describes the various socioeconomic factors found in the literature to be associated with travel behaviour. Section 2.5 - Internal Factors reviews the literature examining the influence of transit service directly influenced by transit providers such as pricing, service, and station amenities. Finally, Section 2.6 - Urban Form summarizes research analyzing the elements of the built environment including land uses and street networks that are thought to influence travel behaviour.
2.1.A Brief History of Urban Transport
One of the most influential forces shaping the spatial patterns of urban growth throughout history has been the diffusion of new transportation technology. Newman and Kenworthy (1999)
identified three distinct city forms shaped by the dominant transportation technology of the time: 1. The walking city
2. The transit city 3. The automobile city
Early cities were limited in size to areas accessible by foot, generally no larger than an individual could walk more than 45 minutes from the center. As a result, population densities in major centers reached levels similar to those found in the densest modern cities (Muller, 2004;
Pushkarev & Zupan, 1977). It was not until the implementation of the first public transit systems that cities began to grow to cover larger areas of land and people at lower densities (Kain, 1999). The first American mass transit system, a horse-drawn streetcar, was established in New York in
13
1852 (Muller, 2004). This resulted in the expansion of the city beyond its walking city size, enabling the affluent and middle-class to escape the crowded core while maintaining the same level of access to employment and services (Kain, 1999; Muller, 2004). From 1852 to 1888, cities across the United States and Canada implemented horse-drawn street car systems and slowly expanded outward (Muller, 2004).
In 1888, the electric street car was used for the first time in North America and spread almost immediately to most major cities (Kain, 1999). Cities began to expand much more rapidly along new streetcar lines, affording a larger segment of the population a chance to escape the still crowded urban centers (Muller, 2004). City development in this era occurred in radial corridors along the streetcar lines further than ever before from the core (Newman & Kenworthy, 1999; Porter, 1997). Streetcars served as backbones of neighbourhoods, with residential streets fanning out for several blocks along the lines (Muller, 2004). The electric streetcar dramatically
increased the speed of travel, opening up large areas of new land for residential and commercial use and permitting the construction of even lower density neighbourhoods (Newman &
Kenworthy, 1999). Harrison & Kain (1974) estimated that each new mile of streetcar track built in cities in the United States between 1890 and 1910 resulted in a 3.2% increase in single-family homes in an urban region. The first transit systems clearly exerted a decentralizing effect on cities but at the same time, facilitated the clustering of functions, particularly employment, in areas with the greatest access (Porter, 1997). The electric streetcar also increased the economic and ethnic segregation initiated by their horse-drawn predecessor, with homes growing larger and neighbourhoods more affluent further from downtown (Muller, 2004).
Although the automobile was introduced in the 1890s, it was not until Henry Ford’s process of mass production 20 years later that car ownership rates began to increase and transit use decreased dramatically (Kain, 1999; Muller, 2004). By the 1920s, suburban growth exceeded that of the center cities for the first time and the spaces between the streetcar suburbs and beyond began to undergo intensive development (Muller, 2004).
The period between World War I and II was characterized by steady suburban growth and increasing ethnic homogenization in neighbourhoods, as well as the suburbanization and segregation of industry and commerce (Muller, 2004). After World War II, the construction of freeway networks, improved automobile technology, and still increasing automobile ownership
14
rates facilitated a massive outward expansion (Muller, 2004). Baum-Snow (2007) has estimated that the construction of highways through central cities in the United States, facilitating mobility and decreasing the cost of automobile travel, contributed directly to a decline in central area populations. Increasing income levels and preferences for lower density living also contributed to the decline of transit in North America (Kain, 1999). Wealthier families were able to afford to live in increasingly lower density neighbourhoods where transit provision is difficult (Kain, 1999). Nearly ubiquitous automobile ownership and readily accessible high speed road
infrastructure effectively rendered most areas of a city easily accessible, drastically reducing the need for clustering or concentration of activities. This, combined with zoning codes that tended towards separating land uses, helped to entrench the automobile as the preferred, and often only viable, means of transport in North American cities. Mobility was no longer dependent on fixed infrastructure and the cost of moving almost anywhere within an urban region was much more equal. This also served to decrease the importance of the center both in terms of population and employment. This is notable as centralized employment is a particularly important element in the success of the fixed guideway transit systems constructed in the early- to mid-19th century, which were oriented towards delivering commuters to downtowns from outlying areas (Kain, 1999).
By the 1950s and 1960s, academics, planners, and consultants began to recognize the links between widespread automobile ownership and the rapid rate of suburbanization. In the 1970s, researchers turned to understanding the interaction between built environment and public transit amidst concerns about rapidly declining transit use, particularly in the United States (see Adams, 1970; Newman & Kenworthy, 1989b; Pushkarev & Zupan, 1977; Smith, 1984). It became clear that transportation technologies and infrastructure played a major role in shaping cities in terms of their size and how land uses were distributed, and that automobile use and infrastructure were drastically changing the urban environment. Once the implications of automobile-centered development on the environment and social structure of the city were understood attention turned to how design and planning could mitigate its negative effects. In Canada this manifested itself in planning policies at the municipal and regional level in cities such as Toronto and Vancouver, which favoured intensification of already built-up areas (Taylor & Burchfield, 2010). Later, planning movements such as New Urbanism and Smart Growth emerged as responses to the unchecked growth of suburbia and the negative consequences of this type of development.
15
These movements emphasized the creation of relatively dense, mixed use communities that supported active transport and the use of transit. Through the provision of high quality street environments, greater residential densities, and a mix of land use functions, it is believed that walking and transit trips could be encouraged and automobile trips reduced significantly (Handy, 2002).
The relationship between the built environment and travel behaviour continues to be a major motivation for research on transport. Researchers have examined links between travel behaviour and the built environment through measurements of vehicle kilometres travelled (VKT), station boardings, mode choice, and frequency of walking trips among others at scales varying from the metropolitan level to individual travellers (Ewing & Cervero, 2010). Ewing & Cervero (2010) provided a comprehensive meta-analysis of the built environment-travel literature comprising 62 studies covering a range of methods, data types, statistical controls, and locations. They
examined the built environment’s effects, specifically land use intensity, land use mix, and design on VKT, the rate of walking trips, and transit use. They found that individually built environment variables had relatively small effects on the three types of travel behaviour but that in combination, the effects may be larger. With respect to walking, they found that intersection density, the ratio of jobs to housing, and distance to commercial services exhibited the strongest relationships. For transit use, it was found that access to transit was the most important factor in the mode share and likelihood of transit use followed by intersection density and land use mix. These findings indicate that the policies encouraging densification and mixed use development around bus stops and rail rapid transit stations have the potential to influence travel behaviour. Cervero & Kockelman (1997) in an examination of the 3 “D”s (density, diversity, and design) of the built environment, found that built form variables had statistically significant, although moderate, effects on single occupant vehicle trip making and VMT. Density, diversity, and design later expanded to include distance to transit and destination accessibility, representing five major ways that the built environment influences travel behaviour including transit share (Cervero & Murakami, 2008).
Density is typically measured in terms of population and sometimes job concentration, and it is broadly accepted that high densities are if not a prerequisite, at least a strong contributing factor to the success of transit (Cervero, 1998; Cervero et al., 2002; Ewing, Pendall, & Chen, 2003).
16
Some of the first studies to assess the viability of transit projects conducted by Pushkarev & Zupan (1977) and Pushkarev, Zupan & Cumella (1982) established minimum density thresholds for various transit types. Higher densities can increase the potential opportunities for individuals to interact and increase the total number of services that can be supported (Banister, 2005; ECOTEC, 1993). Density shortens the distances between work, home, and commercial activities, which reduces average travel distances (Banister, 2005; ECOTEC, 1993; Holtzclaw, Clear, Dittmar, Goldstein, & Haas, 2002; Steiner, 1994). If the distance required to travel is shortened, the time advantage of driving is reduced. This coupled with parking restrictions typically found in denser settings has the potential to make automobile use much less convenient than walking, cycling, or transit (Kuzmyak et al., 2003). The links between densities and travel behaviour have received much attention in the past with higher density generally being
associated with a range of travel-related phenomena at varying scales. Higher population densities have been linked to lower levels of energy consumption for transportation (Naess, 1993; Newman & Kenworthy, 1989a, 1989b), higher work and shopping trip transit mode share (Frank & Pivo, 1994; Kitamura, Mokhtarian, & Laidet, 1997), a reduction in total distance travelled (Holtzclaw, 1990; Holtzclaw et al., 2002), as well as lower levels of automobile ownership (Dunphy & Fisher, 1996) and automobile trip making (Steiner, 1994).
On a metropolitan scale, there appears to be a correlation between density, road supply, and transit usage with less dense and more automobile-oriented North American cities demonstrating considerably less transit usage (Cervero, 1998; Kuzmyak et al., 2003). Both population and job density in station areas have also been shown to be associated with passenger distance travelled on transit systems at a metropolitan scale in the United States (Chatman et al., 2014). On a smaller scale, Lee et al. (2011) used a cluster analysis to identify a number of neighbourhood types, finding that, overall, neighbourhoods with higher densities and better transit access tended to produce more transit trips. Population and employment density at the station catchment level is associated with increased ridership for new transit projects (Chatman et al., 2014). Individuals living in compact neighbourhoods (defined as areas with mixed housing, nearby commercial services, and transit access) have also been associated with more walking, cycling, and transit trips (Dunphy & Fisher, 1996; Karash et al., 2008).
17
Despite a significant body of evidence that connects density to travel behaviour measures used in travel behaviour assessments represent density as well as a number of related factors (Kuzmyak et al., 2003). The effects of density then also incorporate the higher levels of accessibility, greater congestion, and restrictions on parking that are usually associated with higher density environments (Kuzmyak et al., 2003). Density on its own likely does contribute in a small way to travel behaviour, though “second order” effects of density may be more influential (Kuzmyak et al., 2003) .
Diversity, often measured as a jobs-to-housing ratio (Johnson, 2003; Kuzmyak et al., 2003), the proportions of various land use types (Dill, Schlossberg, Ma, & Meyer, 2013; Johnson, 2003; Sohn & Shim, 2010), or a composite land use mix index (Dill et al., 2013; Estupinan & Rodriguez, 2008; Ryan & Frank, 2009), exerts a similar effect as density. By providing a diversity of opportunities to work and shop close to residences, trip lengths can be shortened reducing the need to use automobiles and making active transport and public transit more
feasible alternatives (Banister, 2005). Diverse neighbourhoods, particularly in suburban centers, tend to produce more transit, walking, and cycling trips (Porter, 1997). Having retail services situated between a transit stop and one’s residence has also been shown to increase work transit trip rates (Cervero, 1996). While jobs-to-housing ratios have not generally shown strong
associations with travel behaviour, other measures such as land use entropy indices and distance to nearest commercial location often do (Ewing & Cervero, 2010; Kuzmyak et al., 2003; Vance & Hedel, 2007).
Design refers to street network patterns and amenities (e.g. lighting, sidewalks, and shading) that have the potential to influence travel behaviour by providing safe environments and convenient routes. Street network patterns can be measured in a number of ways including intersection density, street density, average block length, and intersection to street link ratio. Intersection density is a common measure of neighbourhood permeability that is frequently associated with lower VKT and higher rates of walking, cycling, and transit use (Boer, Zheng, Overton,
Ridgeway, & Cohen, 2007; Ewing & Cervero, 2010). Street density is a simple measure of the length of the street network in a given area divided by the size of the area. Higher street densities would then indicate that road space comprises a large proportion of a given area. Average block length is determined by dividing the total number of street links (sections of road
18
between intersections) by the total length of streets. This yields another measure of network permeability with longer average block lengths indicating more distance between intersections and therefore fewer options for alternative routes. Similarly, intersection to street link ratio measures the total number of intersections divided by the links between them and provides a measure of permeability with higher ratios indicating a wider range of route options. Cervero & Kockelman (1997) found that walking quality, particularly intersection density, block length, sidewalk provision, and limited street parking were associated with lower levels of single-occupant vehicle travel. Pedestrian friendliness, often measured as a composite index of
amenities, route directness, and quality, also shows some correlations with higher rates of transit, walking, and cycling trips (Ewing & Cervero, 2010; Porter, 1997). For example, Estupinan & Rodriguez (2008) found that a composite factor of ‘walking supports’ including pedestrian and bike friendliness, sidewalk quality, and perceptions of safety and cleanliness was strongly associated with transit use for Bogota’s BRT stations. Pedestrian environment factors have also been associated with reduced VKT, higher transit and active transport mode shares, and higher active transport station access mode share (Kuzmyak et al., 2003).
Distance to transit refers to the local accessibility of transit services, which may be a determining factor in whether or not an individual chooses transit for any trip type (Lee et al., 2011). Krizek (2003) analyzed the effects of residential relocation on mode choice in the Seattle area, finding that households that move to areas providing greater options for transit and active transport modes tend to drive less. Baum-Snow & Kahn (2000), using data from five U.S. cities from 1980 to 1990, found that decreasing distance to rail transit stations from an average of 5.79 km to 4.79 km increases transit commute shares at the census tract level by 1.4%. El-Geneidy et al. (2014) have presented evidence for Montréal that shows that walking distance to transit can vary by transit, trip, and household type, but that the majority of walking access to transit occurs between 873 m and 1259 m for rail based transit. Cervero & Gorham (1995) found that neighbourhood type (automobile vs. transit oriented) in San Francisco and Los Angeles also influenced commuting behaviour noting, however, that this effect may be dependent on a metropolitan area’s orientation towards one form of transit or the other. This relates to the final “D”: destination accessibility, which refers to how well a transit station, for example, connects a neighbourhood to the rest of the region (Cervero & Murakami, 2008). Metropolitan regions that
19
favour transit connectivity with higher overall transit accessibility are likely to produce higher transit usage simply by connecting more useful locations (Cervero & Gorham, 1995).
The nature and strength of the relationship between urban form and travel is still subject to debate and is potentially confounded by factors such as residential self-selection (the propensity for people who prefer one mode of transportation moving to areas where it is easier to use that mode). When accounted for, researchers generally find that built environment variables are still associated with travel behaviour although the effect is mitigated, in part, by residential self-selection (Cao, Mokhtarian, & Handy, 2009; Ewing & Cervero, 2010; Mokhtarian & Cao, 2008). The results, however, vary with Ewing & Cervero (2010) finding that in some cases,
self-selection actually enhanced the built environment’s effect on travel behaviour, while Cao et al. (2009) found that the effect is attenuated by it. Chatman (2009) has also argued that residential self-selection may actually underestimate the built environment’s effect on travel choices, particularly for transit-preferring households as these households may be opting to use transit regardless of their neighbourhood type.
2.2.Direct Ridership Models
Predicting potential ridership of proposal is important in the transport planning process. One means of assessing the potential drivers of transit ridership is the use of a direct ridership model (DRM). A DRM is a methodological tool that has grown in popularity owing to ease of
implementation and interpretation of results. Fundamentally, DRMs estimate ridership, typically measured at the station, line, or system level, and are frequently used in the assessment of transit infrastructure proposals and in investigations of built form, station amenity, and service supply effects on transit use. In contrast with the traditional four-stage transit demand modelling, DRMs allow for the analysis of small-scale local factors often not included in large-scale regional model. DRMs represent a cost-effective alternative as many transit agencies simply do not have the resources available to conduct four-stage demand models (Boyle, 2006; Usvyat et al., 2009). Advances in GIS technology and increasingly large amounts of data available are enabling transit agencies to better understand what drives transit ridership and consequently plan for better service. Still, a large proportion of transit agencies rely on rules of thumb, professional judgement, comparisons with existing routes, or published elasticities for many planning
20
Nineteen DRMs were surveyed for this study: 11 from the United States, two from Spain, and one each from Canada, Colombia, Mexico, South Korea, and Taiwan, Some studies examine only one form of transit (Cardozo, Garcia-Palomares, & Gutierrez, 2012; Cervero, 2006; Cervero, Murakami, & Miller, 2010; Chan & Miranda-Moreno, 2013; Chow, Zhao, Liu, Li, & Ubaka, 2003; Duduta, 2013; Estupinan & Rodriguez, 2008; Gutierrez, Cardozo, & Garca-Palomares, 2011; Johnson, 2003; Kuby, Barranda, & Upchurch, 2003; Ryan & Frank, 2009; Sohn & Shim, 2010) while others combine several (Chu, 2004; Dill et al., 2013; Kohn, 2000; Lane, DiCarlantonio, & Usvyat, 2006; Taylor, Miller, Iseki, & Fink, 2008) covering bus, BRT, trolley, light rail, heavy rail, and subway systems. The majority employ standard OLS
regression, while others use two-stage least squares (2SLS), geographically weighted regression (GWR), and structural equation modelling (SEM). A notable absence in the DRM literature is the role of service supply and its interactions with ridership. Taylor et al., (2008) and Estupinan & Rodriguez, (2008) use 2SLS with an instrumental variable finding that service provision is strongly associated with demand. Sohn & Shim (2010) go further using SEM to evaluate two-way relationships between a range of potentially interacting variables finding a number of significant links. Another element lacking in most DRM studies, including all 19 cited here, is the potential for a spatial relationship among variables. In other words these analyses do not account for the fact that ridership at certain stations or in certain areas may be clustered.
Statistical techniques exist to account for these relationships and may help to explain some of the observed variation in ridership that is not captured by traditional regression modelling.
Five of the 19 studies mentioned here combine multiple cities for their analysis using from 265 (Taylor, et al., 2008) to 8 different locations (Kohn, 2008). While aggregating data for multiple regions may mask location-specific influences on transit use it has the added benefit of
increasing the sample size and generating better estimates. Most cases are limited to one form of transit though some combine light rail and commuter services (Lane et al., 2006), multiple transit types (Taylor et al., 2008), bus and light rail (Dill et al., 2013), and bus, trolley, and LRT (Chu, 2004). One benefit of combining urban and suburban rail services is again to obtain a large sample of stations from which to derive estimates as well as to account for the fact that suburban train stations in some cases exist in relatively dense environments more typical of urban rail station settings while the opposite is true for many urban rail stations. The majority of the DRM literature surveyed relied on average daily boarding data as opposed to AM/PM or peak/off-peak
21
periods while Chan & Miranda-Moreno (2013) estimated separate models for trip production and trip attraction at the AM peak.
The diversity of locations, methods used, types of transit, and variables considered in the models have resulted in a range of potentially significant factors. In order to simplify the large number of variables used in other studies and considered in this one, four categories are used:
socioeconomics, station, neighbourhood and street network, and service attributes. Table 2 contains a summary of the key attributes and findings of the DRMs surveyed for this study. The variables tested in these models guided the choice of variables to be used in this study.
22
Table 2 - DRM Literature Review Summary
Authors Chu, 2004 Cervero et al., 2010 Chan & Miranda-Moreno,
2013
Location Jacksonville, Florida Los Angeles, California Montréal, Québec Transit Type Bus, trolley, light rail Bus Rapid Transit (BRT) Subway
Method Poisson regression OLS Regression OLS Regression
Socioeconomic Population Age % female pop. Ethnicity Household income No-vehicle households Population Population Income
Station and Network Bus stops within walking distance
Other bus stops in area Trolley stop dummy
Bus line dummy Rail line dummy Distance to next closest
stop
Interaction term between dedicated BRT lane, bus lines, rail lines, population, and parking availability
Bus stops within walking distance
Bus routes within walking distance
Distance to downtown terminus
Terminal station dummy Transfer station dummy Neighbourhood and
Street Network Jobs Commercial land use area Government/institutional land use area
Service Daily bus supply High frequency service
dummy Other
23
Authors Dill et al., 2013 Kuby et al., 2003 Lane et al., 2006
Location Portland, Oregon 9 US Cities 17 US Cities
Transit Type Bus, light rail Light Rail Light and Commuter Rail
Method OLS Regression OLS Regression OLS Regression
Socioeconomic % white population % pop. under 17/over 65 Pop. with higher education Households with a vehicle Households > poverty line Population
Population % renters
% no-vehicle households
Average household size Total households Population
Station and Network Distance to downtown Stop location
Transfer station dummy Rail or BRT station Park and ride spaces Transit center dummy Total stations in area
Parking availability dummy
Terminal station dummy Transfer station dummy Total bus connections Relative accessibility
Parking availability dummy
Total bus connections Transit center dummy Fare
Total stations on network Distance to nearest station Neighbourhood and
Street Network % single floor residential % multi-floor residential % commercial land use Total park area
Land use mix index Employment
Pedestrian destinations Street connectivity
Multi-use/bike paths (km)
Employment Employment
Service Average headway
Maximum coverage time
Time and speed to center Midday headway
Other Job accessibility CBD/metro employment
CBD pop. density Metro area pop.
24
Authors Usvyat et al., 2009 Lin & Shin, 2008 Cervero, 2006
Location 10 US Cities Taipei, Taiwan Charlotte, North Carolina
Transit Type Heavy Rail Subway Light Rail
Method OLS Regression OLS Regression OLS Regression
Socioeconomic Population Household income
Car ownership
Motorcycle ownership
Population
Station and Network Parking spaces
Terminal station dummy Distance to downtown Rail connections
Transfer station dummy Intermediate station
dummy
Transfer bus availability
CBD station dummy Parking availability Total bus connections Terminal station dummy Distance to nearest station Neighbourhood and
Street Network Employment Bus routes within walking distance 4-way intersections Sidewalk length Retail/service floor/area ratio Interaction between CBD employment and density
Service Midday headway Level of service
25
Authors Ryan & Frank, 2009 Duduta, 2013 Sohn & Shim, 2010
Location San Diego, California Mexico City, Mexico Seoul, South Korea
Transit Type Bus Bus Rapid Transit (BRT) Subway
Method OLS Regression OLS Regression OLS Regression/SEM
Socioeconomic Income No vehicle households % female pop. % Hispanic pop. % White pop. % youth
Population density Population density
Station and Network Microbus connections
Microbus terminal dummy Total bus/BRT connections Number of connecting
subway lines Long distance bus
connection dummy Direct distance to CBD
Number of transfers to center
Feeder bus connections Transfer station dummy
Neighbourhood and
Street Network Walkability index Employment University dummy
Commercial land use area
Service Level of service
26
Authors Estupinan & Rodriguez, 2008 Taylor et al., 2008 Gutierrez et al., 2011
Location Bogota, Colombia 265 US metro regions Madrid, Spain
Transit Type Bus Rapid Transit Various Subway
Method 2SLS 2SLS Distance decay regression
Socioeconomic Education Unemployment rate Socioeconomic stratum Population Unemployment rate % college students Recent immigrants Ethnicity No-vehicle households Foreign population
Station and Network Total amenities Urban bus connections
Suburban bus connections Parking availability Station accessibility on
network
Number of lines at station Neighbourhood and
Street Network Cleanliness and safety Accidents Thefts and deaths Traffic calming Sidewalk length Bike path length Land use mix Intersection count Road density
Freeway lane length Employment Employment in
commercial sector
Employment in education sector
Land use mix
Service Vehicle revenue hours
Fares Headways
27
Authors Chow et al., 2003 Cardozo et al., 2012 Kohn, 2000
Location Broward County, Florida Madrid, Spain 8 Canadian Cities
Transit Type Bus Subway Various
Method Distance decay regression Distance decay regression OLS Regression Socioeconomic Ethnicity
No-vehicle households Vehicle ownership rate for
households with no children
Station and Network Suburban bus connections
Number of lines at station Neighbourhood and
Street Network Employment Employment
Service Vehicle service hours
Fares
Fares
Vehicle revenue hours Other
28
Authors Johnson, 2003
Location Minneapolis, Minnesota
Transit Type Bus
Method OLS Regression
Socioeconomic % household with access to a car
% of pop. 0-16 Population density Station and Network
Neighbourhood and
Street Network Multi-family housing (1/8 mile and 1/8 to 1/4 mile from stops)
Mixed use land Retail land use Housing/jobs balance Housing/shopping balance Service
29
2.3.Station Access and Catchment Areas
How far individuals are willing to walk to access transit is a key consideration for planners and is something that can vary dependent on location, time of day, trip purpose, and type of transit used (El-Geneidy et al., 2014). The accessibility of transit is also a key factor in travel decision-making as Baum-Snow & Kahn (2000) have demonstrated, decreasing the distance to transit has a positive effect on transit use in the United States. Station access modes can be split into three categories: automobile, other transit, and active transport. In Canada, access mode share for rail rapid transit varies within a wide range by station, system and by transit type (see Table 3).
Table 3 - Station Access Mode Share by Transit Operator
Operator Transit Type Automobile Transit Active
AMT Suburban 62% 12% 26%
STM Urban 8% 46% 46%
GO Suburban 80% 10% 10%
(Agence Métropolitaine de Transport, 2012) (Salsberg, 2013)
Urban stations are typically accessed by active transport and other modes of transit while suburban station access is mostly dominated by automobile and other transit (Agence
Métropolitaine de Transport, 2012; Crowley, Shalaby, & Zarei, 2009). Quantifying these access variables using measures of physical infrastructure rather than surveys of other travel behaviour data is relatively easy for automobile (e.g. the number of parking spaces at a station) and other transit (e.g. the number of connection bus lines at a station) and are consistently found to be associated with ridership in station level models (Cardozo et al., 2012; Cervero, 2006; Cervero et al., 2010; Chan & Miranda-Moreno, 2013; Chu, 2004; Dill et al., 2013; Duduta, 2013; Gutierrez et al., 2011; Kuby et al., 2003; Lane et al., 2006; Lin & Shin, 2008; Sohn & Shim, 2010; Usvyat et al., 2009).
Active transport access, on the other hand, is less clearly quantified and in most cases requires the delineation of a station catchment area from where it is assumed that the majority of local riders originate or the use of a distance decay function, which weights the effect of access by distance.
30
Variables measuring the permeability of street networks and the diversity of land uses in station areas are often positively correlated with transit ridership in stop-level analyses, which aim to capture a station area’s potential to facilitate pedestrian trips (Chu, 2004; Estupinan &
Rodriguez, 2008; Johnson, 2003; Lin & Shin, 2008; Ryan & Frank, 2009). Permeability simply refers to the degree to which a street network facilitates travel by providing a diversity of routes. Gridded street networks with relatively short blocks, for example, have a high degree of
permeability, which can be contrasted with suburban neighbourhoods comprising curvilinear streets and cul-de-sacs that limit through traffic. Estupinan & Rodriguez (2008) found that station areas that provided supports to walking, such as sidewalk quality, continuity, and width had significant positive effects on BRT station-level ridership in Bogota. Similarly, Ryan & Frank (2009) found that the inclusion of a composite walkability variable capturing land use mix, density, and street network form helped to explain station level bus ridership in San Diego. Intersection density and sidewalk length (Lin & Shin, 2008), and pedestrian destinations and street connectivity measured as the number of intersections divided by the number of links between them (Dill et al., 2013) were positively associated with ridership at the stop level as well. Other measures of pedestrian access, such as land use mix or proportions of residentially or commercially zoned land, were associated with increased transit use (Chan &
Miranda-Moreno, 2013; Dill et al., 2013; Gutierrez et al., 2011; Johnson, 2003; Lin & Shin, 2008; Sohn & Shim, 2010). In the travel demand literature, intersection density, population and employment density, and jobs-housing balance were generally found to be positively associated with an increased frequency of walking trips and that more integrated, or mixed, land uses can encourage transit trip frequency (Ewing & Cervero, 2010; Kuzmyak et al., 2003). Regardless of the
measure employed, all aim to capture how well an area can provide access to non-motorized travellers through providing a diversity of opportunities or routes.
Methods of measuring station catchment areas include fixed boundaries, either network based or circular, or without fixed boundaries through the use of geographically, or distance-decay, weighted regression that discount the effects of variables as distance from the station increases (see: Cardozo et al., 2012; Chow et al., 2003; Gutierrez et al., 2011). It is generally accepted that 800 m (≈ ½ mile) is the distance within which most walking trips to rail rapid transit occur, and an adequate representation of a person’s willingness to walk to access transit, and there is some evidence to suggest that boundary size and shape (network-based vs. circular) have little
31
influence on station level predictions of transit ridership (Guerra, Cervero, & Tischler, 2012). However, El-Geneidy et al. (2014) suggest, using origin destination survey data for Montréal, that the distances passenger was to stations depends on numerous factors including the type of transit being accessed. They found that travel on foot to access transit varies based on location, personal characteristics, and service type. They found that mean walking distances to Montréal’s Metro stations is 565 m (0.35 miles) and 873 m (0.54 miles) at the 85th percentile. For suburban train stations, the mean walking distance was 818 m (0.5 miles) and 1,259 m (0.78 miles) at the 85th percentile, suggesting that larger service areas for suburban train stations more accurately capture its catchment area.
2.4.Socioeconomics
The majority of reviewed DRMs found associations between socioeconomic variables and transit usage. The wide range of variables tested in the models and likely high collinearity among them makes it difficult to isolate one or even several factors. Significant predictors included in DRMs were income, economic status (e.g. population below poverty line), employment rates, housing tenure, and car ownership. Several studies in the United States found significant relationships between variables representing ethnicity (or race) and transit use (Chu, 2004; Dill et al., 2013; Ryan & Frank, 2009; Taylor et al., 2008), while those conducted elsewhere did not find these factors to be significant. Several studies found negative associations between income and transit ridership (Chan & Miranda-Moreno, 2013; Chu, 2004; Dill et al., 2013; Lin & Shin, 2008; Ryan & Frank, 2009), while the inverse was true for unemployment rates (Estupinan & Rodriguez, 2008; Taylor et al., 2008).
Car ownership influenced transit ridership in both DRMs (Chow et al., 2003; Dill et al., 2013; Johnson, 2003; Kuby et al., 2003; Lin & Shin, 2008; Ryan & Frank, 2009; Taylor et al., 2008) and in the travel demand literature (Bento, Cropper, Mobarak, & Vinha, 2005; Paulley et al., 2006; Taylor & Fink, 2003). This is likely as a result of the faster speeds and greater
convenience offered by private automobiles relative to public transit in most places. Finally, age groups in a station area were found to influence boardings with higher proportions of youth and seniors positively related to transit ridership (Chu, 2004; Dill et al., 2013; Johnson, 2003; Ryan & Frank, 2009). Dill (2013) and Johnson (2003) found a positive association between the proportion of youth in the population and transit use, while Ryan & Frank (2009) observed the
32
opposite relationship. Differences in the direction of the relationship from one model to the next may be explained by local factors. In the case of Portland, where Dill (2013) conducted a study, students were provided free transit passes, which was not the case in San Diego, the location of the Ryan & Frank (2009) study. Possible explanations for the effect age has on transit usage include the fact that youth and seniors may not be able to drive or afford an automobile. Again, it is likely that these variables exhibit a high degree of collinearity. Collinearity among
socioeconomic variables and the potential complications of residential self-selection discussed previously make interpreting the role of socioeconomic variables in ridership models difficult. Socioeconomic variables included in ridership models in most cases reflect income or class. Housing tenure, unemployment, car ownership, and even age groups can be seen as proxy variables for income.
It is clear from the literature that income affects travel behaviour by reducing the cost of automobile travel. These effects may, however, vary depending on location owing to transit service levels and attitudes towards transit use (Buehler & Pucher, 2012). Regions with more integrated and convenient transit service do not have the same relationships between mode share and income normally found in North America. Buehler & Pucher (2012) found that it is the “integrated package of complementary policies that explains…” (pg. 563) how German public transport succeeds in attracting riders away from automobile use across all income groups. This is achieved through providing transit service that approaches the convenience and speed of private automobile use. This relates to Cervero & Gorham’s (1995) statement that some of the variation in the effects of neighbourhood type on travel behaviour observed in San Francisco and Los Angeles may be explained by metropolitan scale orientations towards one form of transport auto neighbourhoods vs. transit neighbourhoods. It should therefore be expected that regions with more comprehensive transit planning and better transit service will not exhibit the same relationships between socioeconomic, and potentially other variables, and transit ridership as areas with weaker transit policies.
2.5.Internal Factors
Internal factors, as termed by Taylor & Fink (2003), refer to the elements of a transit system under the direct control of a transit agency and include elements such as fares, station amenities (e.g. shelters or schedule information), and service supply. Taylor & Fink (2003) in a survey of