© EIB – 12/2010 – EN QH-PA-15-001-EN-C ISSN 1830-3676
E u r o p e a n I n v e s t m e n t B a n k • E u r o p e a n I n v e s t m e n t B a n k • E u r o p e a n I n v e s t m e n t B a n k • E u r o p e a n I n v e s t m e n t B a n k • E u r o p e a n I n v e s t m e n t B a n k
EIB Papers
•
Volume 15
•
No1
•
2010
Economic and Financial Studies
98-100, boulevard Konrad Adenauer L-2950 Luxembourgwww.eib.org/efs
E u r o p e a n I n v e s t m e n t B a n k • E u r o p e a n I n v e s t m e n t B a n k • E u r o p e a n I n v e s t m e n t B a n k • E u r o p e a n I n v e s t m e n t B a n k • E u r o p e a n I n v e s t m e n t B a n k
EIB Papers
•
Volume 15
•
No1
•
2010
EIB
Papers
Public and private financing of infrastructure
Evolution and economics of private infrastructure finance
Volume 15
•
No1
•
2010
Infrastructure finance in Europe: Composition, evolution and crisis impact Rien Wagenvoort, Carlo de Nicola and Andreas Kappeler The economics of infrastructure finance: Public-Private Partnerships versus public provision Eduardo Engel, Ronald Fischer and Alexander Galetovic
Infrastructure as an asset class Georg Inderst Risk, return and cash flow characteristics of infrastructure fund investments Florian Bitsch, Axel Buchner and Christoph Kaserer
16 40 70 106
EIB
Papers
Editor
Hubert Strauss
Production
Anna Schumacher EIB Graphic Workshop
Editorial Policy
The EIB Papers are published each year by the Economic and Financial Studies Division of the European Investment Bank. The journal is divided into two issues and is aimed at encouraging high-quality economic research and debate on matters of European interest. As such the Papers
are intended to be accessible to non-specialist readers and emphasise policy dimensions rather than technical issues. They present the results of research carried out by Bank staff together with contributions from external scholars and specialists.
Articles will only be accepted for publication on the condition that they have not already been published elsewhere. All articles in the EIB Papers may be freely reproduced and quoted; however, the Editor would appreciate acknowledgement and a copy of the publication in question. They can also be freely accessed and downloaded from our website: www.eib.org/efs/
EIB
Papers
Public and private financing of infrastructure
Evolution and economics of private infrastructure finance
EIB PAPERS Volume15 N°1 2010 3
Preface by Philippe Maystadt, President 5
Conference speakers 9
Public and private financing of infrastructure
Evolution and economics of private infrastructure finance
Editor’s introduction 11
Infrastructure finance in Europe: Composition, evolution and crisis impact 16 Rien Wagenvoort, Carlo de Nicola and Andreas Kappeler
The economics of infrastructure finance:
Public-Private Partnerships versus public provision 40
Eduardo Engel, Ronald Fischer and Alexander Galetovic
Infrastructure as an asset class 70
Georg Inderst
Risk, return and cash flow characteristics of infrastructure fund investments 106 Florian Bitsch, Axel Buchner and Christoph Kaserer
EIB PAPERS Volume15 N°1 2010 5
Preface
Philippe Maystadt President
Well-functioning infrastructure networks are the backbone of prospering economies. The European Union is facing large infrastructure investment needs over the coming decade: in the “old” Member States, a significant part of the existing capital stock comes up for renewal; in the “new” Member States, there is still need for raising their infrastructure capital stock. What is more, throughout Europe and other parts of the world new investment needs arise with population ageing and climate change. This leads to the question of how these infrastructure investment needs can be financed, even more so as they come at a time when the financial and economic crisis is putting public budgets under tremendous strain. The question is of utmost importance for the European Investment Bank, since financing infrastructure is what the EU’s long-term financing arm has been doing since its creation in 1958. While the scope of our activities has become more diversified over the years, finance for infrastructure and infrastructure-related projects still accounted for about half of our total lending in the European Union in the 2005-09 period. Against this background, the Bank must have a keen interest in keeping up to date its understanding of both the economics of infrastructure finance and the ensuing policy and operational implications.
One of the central questions asked at the 2010 EIB Conference in Economics and Finance, on which this volume of the EIB Papers draws, was whether the private sector can in the future finance a larger share of infrastructure. In providing the answer, a natural first step is to study the composition of infrastructure finance and how it has evolved in the past. Indeed, the relative importance of private finance was increasing, and that of government finance decreasing, during the 1990s and until the beginning of the financial crisis, but this trend has – at least temporarily - been reversed.
A second step would then be to look at possible obstacles to private participation in infrastructure finance. Several contributions to this volume argue that the right division of roles between the government and the private sector in general and the right allocation of risks in particular are essential in mobilizing more private finance and lowering its cost.
That said, infrastructure will always compete with other uses for private investors’ money. It is therefore rewarding to shed some light – as is done in the final two articles of this issue of the EIB Papers (Volume 15, Number 1) – on investors’ motivations, the particular form of their involvement in infrastructure, and the performance of infrastructure investments compared with investments in other sectors. We also need to ask whether the market left to itself channels too little finance into infrastructure. An undersupply of finance for infrastructure could, for example, be due to the investment horizon of private finance being shorter than the lifespan of physical infrastructure assets. Could this mismatch narrow in the future as more EU citizens seek investments in long-term assets to ensure their standard of living after retirement? In this context, this volume explores to what extent the physical infrastructure could be backed by financial infrastructure assets that pension funds and other long-term institutional investors find attractive.
In any case, the government will remain an important player in infrastructure finance. This raises a number of public-policy issues with respect to regulation, long-term planning, infrastructure-related aspects of climate change, and the role of public and international players in developing countries.
These issues will be discussed in an issue (Volume 15, Number 2) accompanying this edition. Suffice it to say here that government failures deserve as much attention as market failures in mobilizing additional private finance for infrastructure.
When presenting Volume 13 of the EIB Papers to you, I wrote that the composition and productivity of infrastructure were one side of a coin and its financing another. By looking at financing issues, this volume deliberately “turns the coin” of the 2008 EIB Papers. Together with Volume 10 (2005), which is devoted to Public-Private Partnerships, these papers are testimony to the EIB’s ongoing reflection on the underlying economic elements of its infrastructure operations.
I am confident that the research findings presented in this volume will further enhance our understanding of infrastructure finance and I am happy we can share them with you.
EIB PAPERS Volume15 N°1 2010 9
Public and private financing of
infrastructure
Evolution and economics of private infrastructure finance
The 2010 EIB Conference in Economics and Finance – held at EIB headquarters in Luxembourg on November 11 – brought together academics, policy makers and companies to discuss trends and policy issues in infrastructure-financing. It highlighted the relevant facts and figures and the basic economics of infrastructure finance. Moreover, it focused on infrastructure assets and markets, including the impact of the crisis, and it identified the key factors shaping infrastructure finance going forward as well as the public-policy issues involved.Speakers included:
Rien WAGENVOORT
of the European Investment Bank
Eduardo ENGEL
of Yale University
Georg INDERST
Independent Adviser
Christoph KASERER
of Technische Universität München
Nicolás MERIGO
of Marguerite Adviser S.A.
Dieter HELM
of University of Oxford
James STEWART
of Infrastructure UK
Marianne FAY
of the World Bank
Antonio ESTACHE
EIB PAPERS Volume15 N°1 2010 11
Editor’s introduction
Member states of the European Union are facing large infrastructure investment needs over the coming decade as a significant part of the existing assets comes up for renewal in the old member states and the new member states still have scope for raising their infrastructure capital stock. Developing countries are still facing a large infrastructure deficit compared with the Millenium Development Goals, and needs continue to rise with population and economic growth. Moreover, throughout the world, there are new infrastructure needs resulting from mega-trends such as climate change and population ageing. As a consequence, the demand for infrastructure is up, both Europe- and worldwide.
At the same time, the economic and financial crisis has left a deep mark on the supply of infrastructure finance. Finance at longer maturities has become difficult to obtain. Bond finance dried up in the wake of the breakdown of mono-line insurance, and the search for other forms of credit enhancement is still on. Governments enacted large stimulus packages to stabilize aggregate demand. Together with tax revenue shortfalls and increased social expenditure, this brought deficit and debt levels to new peacetime highs, calling for significant and sustained fiscal consolidation going forward. While some of the financing bottlenecks are likely to be temporary, the need for fiscal consolidation is here to stay. If history is any guide, this will affect government investment significantly, including in infrastructure.
As a consequence, more private finance needs to be mobilized to meet the increasing demand. Since this might not happen smoothly or automatically, the market and government failures inherent in infrastructure should be identified and addressed. Against this backdrop, the contributions to the 2010 EIB Conference in Economics and Finance, which are compiled in this volume of the EIB Papers, discuss to what extent post-crisis infrastructure finance will differ from pre-post-crisis patterns; the roles of the government and private sector; and how to address the various obstacles to more private infrastructure finance.
This guided tour through Volume 15 follows the structure of the EIB Conference by presenting first the main facts and figures about infrastructure finance (Section 1) and then zooming in on the various issues in private investment in infrastructure (Section 2). Section 3 spells out some of the key public-policy issues related to infrastructure finance. Section 4 concludes.
1. Facts and figures and the economics of infrastructure finance
At face value, there is a consensus about long-term trends and the crisis impact on infrastructure. The government share was on a sustained decline until the crisis as the private share was growing. The crisis turned this trend upside down, at least temporarily, as private investors drew out of infrastructure, especially the riskier early-stage investments, while stimulus packages meant government investment held up well. In their opening article to Volume 15, Rien Wagenvoort, Carlo de Nicola and Andreas Kappeler
demonstrate how inadequate macro and sectoral data availability makes it difficult toestablisheven these basic facts and figures with precision. Making as comprehensive an analysis as possible despite the data limitations, the authors come up with a quite differentiated picture.
As for the composition of infrastructure finance in Europe, investment is higher in the new member states than in the old, with the difference fully accounted for by higher government financing. Further, project finance, which accounts for less than ten percent of total private finance, has a higher gearing (one to six) than corporate-sector entities such as utilities investing in infrastructure. Moreover, there are large differences in the source of funding across sectors of activity, with the government providing 85 percent of investment finance in the education sector but only one fifth in utilities. As for the crisis impact, the authors’ estimates document that project finance was indeed hit hard as bond finance dried up.
More on the facts than on the figures side, the contribution by Eduardo Engel, Ronald Fischer and
Alexander Galetovic presents the most important economic insights about Public-Private Partnerships (PPPs) and public procurement of infrastructure investment projects. The article provides a useful conceptual framework that helps to put in a proper context the individual issues discussed throughout the volume. The authors explain that project finance meshes well with the basic economic characteristics of many infrastructure assets – that is, large upfront investment; companies reaching efficient scale even when managing only one physical asset; saving on life-cycle costs by bundling construction and operation; and widespread use of outsourcing the many specialized services. In terms of financing, this implies that sponsor equity and bank loans dominate in the risky construction phase whereas the lower-risk operational phase allows for a higher share of bonds. In terms of organizational form, it makes sense to have a Special Purpose Vehicle (SPV) own and manage the infrastructure asset until the investment cost has been recouped. Another fundamental observation is that the per-dollar cost of PPP finance exceeds that of government debt, with the difference sometimes labelled as the “PPP premium”. The latter can be ascribed to two sets of reasons: faulty contract design, whereby the SPV has to bear exogenous risk (e.g. demand risk in a fixed-term PPP contract); and the need to give the SPV incentives to aim at life cycle cost savings such as organizational innovations in maintenance. Finally, based on their analytical insights, the authors take a stance on the fiscal-accounting debate, calling for a need to improve intertemporal fiscal accounting of PPPs to avoid that contingent debt is hidden from the government balance sheet. The authors postulate that the present value of the PPP contract should be considered as government capital expenditure regardless of the PPP’s risk of failure, and government debt should be increased by the same amount. The stream of revenues to the PPP during the operational phase – whatever their source – would then contribute to gradually extinguishing the amount of that PPP debt. To conclude, Engel and his co-authors stress that the main rationale for PPPs is that their organizational form matches the economics of infrastructure projects and contributes to better accountability.
2. Private infrastructure finance
The volume then shifts the perspective from a bird’s eye view to that of private investors to examine their benefits from investing in infrastructure assets as well as the obstacles facing them. An important question in this respect, which Georg Inderst sets out to answer, is whether infrastructure represents a financial asset in its own right. Infrastructure investments are often said to have several distinct characteristics such as stable, long-term and inflation-protected returns. However, the empirical evidence reported in this article suggests an alternative proposition that treats infrastructure simply as a sector within each of the financing vehicles used (listed and private equity and funds thereof, bonds etc.), not least because of the high degree of heterogeneity across and within infrastructure sectors. Participants in the financial markets differ as to how they classify their investments in the infrastructure domain. So the first sobering answer is that infrastructure assets are not a well-defined asset class with a distinct “stylized” risk-return profile.
That said, investors specialising in infrastructure have enjoyed solid returns in the past one and a half decades. For example, unlisted infrastructure funds slightly outperformed private-equity funds as a whole over the period 1993-2007, according to evidence gathered from the worldwide Preqin database. This outperformance also holds for risk-adjusted returns as investments in infrastructure are found to be less risky, on average, than those in many other areas of private equity. Further, infrastructure funds have seen more stable returns over time (i.e. over consecutive vintages of funds) than, for example, buyout and real-estate funds where often spectacular returns for the vintages of the first half of this decade were followed by negative returns for funds issued between 2005 and 2007.
Comprehensive data are so far scarcer for the crisis years 2008 and 2009. Nonetheless, it can be said that infrastructure investments have not escaped the financial crisis unscathed. For one thing, the latest pre-crisis vintages of unlisted infrastructure funds have returned only little of the paid-in capital back to investors even though due to the natural “J-like” time profile of returns over the fund’s life, final assessments of
EIB PAPERS Volume15 N°1 2010 13 investment multiples and rates of returns can only be made once an infrastructure fund has completed its
activity. For another, actual allocations to infrastructure by private-equity investors are below declared targets and increases in allocations have repeatedly fallen short of intentions, too. Still, if investment intentions materialized, one could expect substantial new demand for infrastructure assets in the medium term. To illustrate, a 3-percent asset allocation shift into infrastructure by pension funds worldwide would result in an additional demand of some USD 700 billion, the equivalent of the estimated annual infrastructure investment gap in developing countries.
Florian Bitsch, Axel Buchner and Christoph Kaserer present empirical results on the risk-return characteristics of infrastructure investments unaffected by the J-curve by looking only at completed private-equity transactions. Their study is complementary to Inderst’s in two further respects. First, they study the risk-return profile of unlisted infrastructure and other private equity at the deal level rather than the fund level. Second, they use a different international data source (CEPRES database). The authors dismiss some widely held views on unlisted infrastructure funds. For example, infrastructure fund investments do not have longer duration; more stable cash flows; lower returns; and inflation-linked returns; also, returns do not appear to have suffered, like other private equity, from capital over-supply during the boom years of the mid-2000s. That said, the “conventional wisdom” is proven right on other aspects in that infrastructure deals are found to be more capital intensive; have lower risk; and are uncorrelated with GDP. All in all, the authors cannot confirm the allegedly bond-like characteristics of infrastructure deals.
The striking combination of lower risk with higher returns holds both for the comparison between infrastructure and other private-equity deals and, within the infrastructure realm, for the comparison between Greenfield and Brownfield investments. This could have to do with the fact that the authors look only at equity participations in portfolio companies, and infrastructure deals are known to be highly leveraged, especially when projects are at a more advanced stage. Yet the flip side of higher leverage is higher market risk – as reflected in the positive correlation of infrastructure investment performance to stock market performance – and greater sensitivity of returns to changes in the interest rate compared to other private-equity investments.
3. Public-policy issues in mobilizing finance
While the empirical analysis of private infrastructure finance is gradually improving, a full understanding of the determinants of private participation in infrastructure also requires a look at the policy side. The network characteristics of many types of infrastructure and the resulting externalities imply that the government will remain an important player in infrastructure finance. Thus, the relationship between the government and the private sector is at the core of the infrastructure financing problem. Following the typical division of roles, it is for public policy to decide which types of infrastructure to put in place at which network size, to govern the planning and licensing activities and to set the regulatory framework, which determines inter alia the price of using the infrastructure services. Within the framework set by public policies, the private sector may then own and operate existing and new infrastructure assets and deliver infrastructure services to clients.
A core economic characteristic of infrastructure is that it involves the creation of long-lived assets with high sunk costs. The marginal cost of providing infrastructure services is thus much lower than the average cost. In the article opening Issue 2 of this volume, Dieter Helm argues that the lack of private finance in infrastructure is due to a time inconsistency problem for the government: the latter has to promise prices based on average cost for private investors to come forward; yet once the asset or network is up and running, it is tempted to break the promise and drive prices down to marginal costs to increase the number of users and hence, consumer welfare. In the view of the author, the effects on private infrastructure finance of the 2008-2009 crisis pale against this fundamental regulatory-policy failure. The crisis has merely compounded the urgency of providing a viable exit for private finance to capital expenditure on new infrastructure assets.
Regulatory policy has made some progress towards overcoming the time inconsistency problem, notably by creating Regulated Asset Bases (RABs), which comprise the initial value of the privatised assets plus the flows of annual capital expenditure not yet recovered by bill revenues. Helm calls for an extension of the RAB concept to infrastructure more generally through the creation of new RABs. New intermediary institutions such as the Green Investment Bank under discussion in the UK – or other infrastructure banks – could lend additional credibility to new RABs, enhancing the flow of finance to capital formation. The infrastructure bank would buy completed infrastructure investment projects, put a guarantee around them to create RABs and sell the assets to pension funds in a debt-financed package. As an intermediary, the infrastructure bank would require little own capital.
The UK is an interesting case to look at also in terms of the government’s role as an infrastructure planner.
James Stewart sketches the essentials of the new UK Infrastructure Plan. It is an integrated approach to infrastructure planning in that it looks at all spending ministries from a macro perspective; at all financing sources; and announces government allocations for a period of five years. The plan backs regulatory and other actions to encourage greater private-sector investment, for example the creation of the Green Investment Bank. On substance, the plan marks a break with the past decade by increasing government allocations to economic infrastructure, with new scientific research facilities receiving an explicit mention. The last two articles of this volume broaden the perspective by studying the infrastructure financing problems of developing countries. Clearly, the challenges are bigger in the developing world. As Antonio Estache argues, some financing options, e.g. the choice between user fees and tax finance, are severely constrained in low-income countries while at the same time investment needs are much bigger. Using the Millennium Development Goals as a benchmark, he shows that the equivalent of almost 7 percent of the developing world’s GDP needs to be invested in each of the coming five years, the bulk of it in electricity and transport.
Can the citizens of developing countries afford to pay for these investments? Estache shows that fully private provision of the needed infrastructure is out of reach for average – let alone poor – citizens of low-income countries. Indeed, full cost recovery would imply per capita fees equivalent to 25-35 percent of income in South-East Asia and in Sub-Saharan Africa, well above the hardship threshold of 15 percent applied by practitioners. It is therefore not surprising that the extent to which countries attempt to recover infrastructure expenditure is the lower the poorer the region. In the water sector, for example, all countries in South Asia and Sub-Saharan Africa refrain from any cost recovery. Given the low prospects for cost recovery, it is not surprising that private participation in infrastructure is comparatively low in sectors concerned with survival and health (e.g. water and sanitation or secondary rural roads) as compared to growth-enabling infrastructure such as telecommunication. All this underlines that in low-income countries, cost recovery issues need to be analyzed from an equity angle as well as the familiar efficiency angle.
Given these circumstances, private commitments in developing countries are quite substantial. Estache estimates that total private commitments represent roughly one fifth of total infrastructure capital expenditure. At less than ten percent, official development aid is a small but indispensable part of total investment.
The author describes how the early enthusiasm about the scope for private infrastructure finance has given way to a more sober assessment. In recent years, the development finance landscape has become very dynamic again as China and other emerging economies have entered the market with attractive terms. These new players increase the amount of finance available but sometimes at the cost of greater political dependence. Looking ahead, what is needed is a policy mix of better planning and construction to bring down the needs, better targeting of consumer subsidies, more competition-friendly public procurement, and speeding up the transfer of knowledge on regulatory best practice, notably with the help of international development agencies that will remain a key player.
EIB PAPERS Volume15 N°1 2010 15 Finally, to what extent is climate change exacerbating the challenge to finance infrastructure in developing
countries? This is the question that Marianne Fay, Atsushi Iimi and Baptiste Périssin-Fabert analyze in their article. It has so far been addressed from the mitigation angle: How to reduce the climate-damaging effects of infrastructure? The novelty here is to address the question also from the adaptation angle: What does it take to make infrastructure more climate-resilient? While mitigation and adaptation needs tend to increase the required capital expenditure, they offer the prospect of significant benefits to society, too. Still, the latter occur later in time than the former, requiring innovative instruments to secure private finance such as the Green Fund proposed by the IMF, green bonds, and an international agreement to incorporate the social cost of carbon in all project appraisals. The authors show that all in all, adaptation needs are relatively small compared to the overall development gap. In fact, what makes societies in developing countries so vulnerable to climate change is the lack of basic infrastructure to start with. But not all is negative. Climate change increases the returns to good management. While more regular maintenance of infrastructure assets would pay for itself in many developing countries already under normal circumstances, it is even more the case in the presence of climate change.
4. Conclusion
To recap, Europe and the world face growing infrastructure needs in the coming years against the backdrop of severely constrained government finance, calling for greater contributions from private finance. The volume presents several valuable insights into the critical issues that need to be addressed to mobilize more private finance. For one thing, improved contract design would be an important step forward. In particular, only those risks that the private sector can actually control should be allocated to it. For another, uncertainty about the return on infrastructure investment is increased by regulatory failure – in particular governments’ inability to credibly commit to allowing network owners to recoup their capital expenditure. Further policy innovation and learning is required in the area of regulation. Improving RABs as a commitment device and extending them to more infrastructure domains might be a way forward, creating intermediary institutions channelling private debt finance into new RAB-protected infrastructure projects another. On the financial-market side, the volume shows that private-equity investment in infrastructure is still an under-researched area. More systematic data collection, analysis and dissemination as well as advances in financial theory would provide the kind of public good that many hesitant investors intending to increase the share of infrastructure in their portfolios would welcome. The two pioneering studies on unlisted infrastructure funds in Issue 1 represent a significant step forward in that direction.
In developing countries, infrastructure needs are more acute and some of the standard financing tools are hardly available. What is required, among other things, is a policy mix to improve subsidy targeting, public procurement and regulation. Climate change is shown to further increase the financing need for infrastructure even though the incremental mitigation and adaptation needs are small in comparison to the overall infrastructure deficit. On the upside, climate change increases the returns to good infrastructure management.
Finally, it is worth stressing that the shrinking role of the government as a financier does not mean that infrastructure policy has become any less important. Infrastructure is a genuine public-policy issue, which requires long-term planning regardless of how it is ultimately financed. It is for society to decide what infrastructure the economy needs, when, and where.
ABSTRACT
Rien Wagenvoort (r.wagenvoort@eib.org) is a Senior Economist and
Carlo de Nicola (c.denicola@eib.org) and Andreas Kappeler (a.kappeler@ eib.org) are Economists at the European Investment Bank (EIB).
The authors would like to thank Hugh Goldsmith, Armin Riess, Hubert Strauss, and Timo Välilä for many valuable comments. The usual disclaimer applies.
This article is the first attempt to compile
comprehensive data on infrastructure finance in
Europe.
We decompose infrastructure finance by
institutional sector (i.e. public versus private) into
its main components, which consist of traditional
public procurement, project finance and finance by
the corporate sector, and analyse how the roles of the
public and private sectors in financing infrastructure
have evolved over time, especially during the
recent economic and financial crisis. In contrast
with government finance that is slightly up, private
finance, in particular project finance through
Public-Private Partnerships, has fallen substantially during
the recent crisis, reversing, at least temporarily, the
longer-term trend of more private and less public
financing of infrastructure.
EIB PAPERS Volume15 N°1 2010 17
Infrastructure finance in Europe:
Composition, evolution and
crisis impact
1. IntroductionLong-term cycles of public and private ownership and investment in infrastructure can be seen across many European countries. Concession contracts can be traced back to the ancient Greeks, and were widely used by the Romans. They were given a modern form under the Napoleonic code, allowing most 18th and 19th century infrastructure (canals, railways, water systems etc.) to be built using private capital, frequently with implicit or explicit subsidies or other forms of government support. Many infrastructures were subsequently taken into public ownership. In the second half of the 20th century, infrastructure finance entered a new phase with privatization, new regulation models and, last but not least, new ways of cooperation under innovative legal frameworks for Public-Private Partnerships (PPPs).1
But, how important is private funding of infrastructure today from a macro-economic perspective? To the best of the authors’ knowledge, a comprehensive empirical description of infrastructure finance in Europe has yet to be made.
The main objective of this article is to measure the relative importance of public and private sources of infrastructure finance in Europe. We present some concrete facts and figures on (a) the roles of public and private sectors in financing infrastructure as well as the different types of financial instruments used, and (b) how these roles have evolved over time, especially during the recent economic and financial crisis.
It is important to emphasise that this exercise should be seen as the first attempt to compile comprehensive data on infrastructure finance. As will be explained in more detail below, data availability in this area is unsatisfactory. The figures presented below can and should be further refined in a number of dimensions and should, therefore, be considered as indicative only at this stage.
The remainder of this article is organised as follows. In the next section, we first decompose infrastructure finance by institutional sector (i.e. public versus private) into its main components, including traditional public procurement, project finance, and finance by the corporate sector. Our task in Section 2 consists of detecting possible differences in this decomposition across sectors of activity (i.e. Education, Health, Transport and Utilities). We also examine the relative use of different financial instruments in project finance. Section 3 investigates the longer-term evolution of infrastructure finance, and its relative importance in the overall economy, by considering the evolution of its share in GDP. However, since GDP came down considerably in a number of EU countries in 2009, the crisis impact on infrastructure finance cannot be derived from GDP shares alone. Section 4, which zooms in on the crisis impact, therefore presents the recent evolution of the absolute volumes of infrastructure finance sources. Section 5 concludes.
1 Välilä (2005) provides an overview of the pros and cons of PPPs as compared to traditional public procurement. Riess (2005) analyses to what extent the PPP model is applicable across sectors.
Rien Wagenvoort
Carlo de Nicola
2. Composition of infrastructure finance
Infrastructure has been understood to include many different things, and a universally accepted definition has remained elusive. One well-known attempt reads (Gramlich 1994, p. 1177):
“The definition that makes the most sense from an economics standpoint consists of large capital intensive natural monopolies such as highways, other transport facilities, water and sewer lines, and communications”.
This description characterizes what is called economic infrastructure. It includes the physical structures from which goods and services are produced that enter directlyas common inputs to many industries (Chan et al. 2009). They have primarily network characteristics.
A broader definition would also cover so-called social infrastructure, most notably infrastructure in the education and health sectors (i.e. schools and hospitals). Social infrastructures produce services that enter indirectly as common inputs to many industries. As is the case with economic infrastructure, investment in social infrastructure sectors is likely to be suboptimal in the absence of government intervention due to the presence of pervasive market failures.
Data on infrastructure investment, let alone its finance sources, are not available in any ready-to-use form. Infrastructure is not separately classified in national account statistics. The closest one can get is to consider Gross Fixed Capital Formation (i.e. investment) in the activity sectors commonly labelled as “infrastructure sectors”: Education, Health, Transport, and Utilities.2 “Transport” includes transport, storage and communication. “Utilities” includes energy, water supply, sewage, and waste management. It needs to be stressed that in what is to come, we refer to total investment by infrastructure sectors. This entails two problems. The first major problem is that we overestimate true infrastructure investment, since the investment measure includes all fixed capital formation in the sectors covered, not just the creation of infrastructure assets. For example, trucks are included under transport investment. Furthermore, the definition of infrastructure sectors may be too large from a pure infrastructure services point of view. For instance, storage is included. On the other hand, the investment measure excludes some intangible assets that should arguably be included in a broad infrastructure concept. In Education, for example, we do not account for the services that lead to the creation of knowledge but only for the facilities.
The second problem with this breakdown is that the transport sector also includes storage and communication in the national accounts; no further breakdown is available. Lumping together investment in road and telecom networks makes the aggregate data obviously less useful and informative.
These caveats duly noted, let us now turn to describing the data used.
First, we use Eurostat national accounts data to get estimates of total and government infrastructure investment. Private investment follows as the residual:
Private = Total – Government (1)
2 The Congressional Budget Office follows the same approach in a recent study on public spending on transportation and water infrastructure in the US (CBO 2010).
A broad definition of infrastructure would include economic infrastructure (e.g. highways and water lines) and social infrastructure such as schools and hospitals.
EIB PAPERS Volume15 N°1 2010 19 The second data source is Projectware that allows us to distinguish between, on the one hand,
investments made through Special Purpose Vehicles (i.e. projects) and, on the other hand, investment by corporations in the infrastructure sectors. SPVs are a way for investors to ring-fence their other assets. In other words, SPVs provide funding against the cashflows of one particular project. In contrast, when investing in corporations, investors expose themselves to all business activities of the firm, including the non-infrastructure related activities. The amount of corporate investment is computed as the difference between total private and private project investment:
Corporate = Private – Private Project (2)
Investment by utilities classified as corporations is an example of what is included on the left side of Equation (2).
Finally, this article uses the same Public-Private Partnership (PPP) project data as described in a recent publication jointly produced by staff from the Economic and Financial Studies division and the European PPP Expertise Centre (EPEC) at the EIB (Kappeler and Nemoz 2010). Note that in most PPPs, finance is entirely private. The share of non-PPP projects in private project finance can thus be approximated by:
Non-PPP Project = Private Project – PPP (3)
The resulting infrastructure finance3 decomposition is summarized in Figure 1. On the upper branch, private finance consists of finance by the corporate sector, PPPs and private non-PPP project finance. Government budget finance consists of investment through traditional public procurement, and a few projects financed by public sources4. A typical example of the latter would be an SPV funded through a regional government.
When it comes to the ultimate finance instruments, government finance consists predominantly of taxes and borrowing. Private finance is made up of loans, bonds, and equity. User fees can be used to reward these financial instruments once the infrastructure is up and running, but are not available during the construction phase. Therefore, we do not consider them here.
At this point, three further caveats warrant mention. First, the breakdown between public and private finance is blurred by the accounting treatment of government-owned corporations. Investment of government-owned corporations that are financed for 50 percent or more by market sales (i.e. revenues from pricing their services) is reported in the national accounts under (private) corporate investment, which tends to exaggerate the share of private infrastructure finance. For instance, investment in electricity networks by the French utility company EDF is counted under private finance although the French government is by far the largest shareholder.
3 In the remainder of this article, the terms “investment” and “finance” are used interchangeably.
4 These public projects are excluded from the project amount on the right side of Equations (2) and (3). The item public projects is put in brackets in Figure 1 as we do not show it separately in what follows.
Private finance consists of finance by the corporate sector, PPPs and private non-PPP project finance.
Figure 1. Composition of infrastructure finance Corporate PPP Project Non-PPP Project Traditional procurement [ Project ] Infrastructure finance Private Government
Second, the classification of project finance vehicles/PPPs across institutional sectors is not harmonized across Europe, and differs between Eurostat and Projectware. De facto this means that the exact share of private project finance remains unknown. Furthermore, government finance is possibly overestimated because it may contain more of PPPs than the part which is financed by public sources. According to Eurostat’s rules, a PPP is on the government balance sheet if either the construction risk, or both the demand and the availability risk remain with the government, even when the project is financed entirely by the private sector. Almost all project finance may, however, be assumed to be private. For practical purposes, we therefore classify the full amount of all PPPs under private finance.
Third, Eurostat flow data on total and government investment show the amount of investment in a particular year, while the data on project finance/PPPs (from both Projectware and the EIB/EPEC paper) show the total capital value of the project. In order to make the data sets compatible, we convert the data on capital value (stocks) into annual investment flows by assuming that the average construction phase of a project is five years, and distribute the capital value proportionally over that period following the financial-close date.5
All these caveats imply that the breakdowns presented below need to be considered with due care. It is, however, important to notice that the way to compile the data presented above does not exclude any infrastructure finance (after all, we start from the “total” reported for the whole economy), nor do the breakdowns below contain any double-counting. Annex 1 provides further details on the construction of variables whereas Annex 2 contains a basic description of the data sources used. As regards the statistical methodology adopted in this article, the recently developed Harmonic Weighted Mass (HWM) index test (Hinloopen et al. 2008) is applied in order to determine whether differences across categories, such as groups of countries or type of projects, are statistically significant. The HWM test is briefly explained in Box 1.
5 The five-year period is suggested by EIB project experts, though the actual investment period may vary considerably across sectors and projects. For more details, see Kappeler and Nemoz (2010).
Almost all project finance may be assumed to be private.
EIB PAPERS Volume15 N°1 2010 21
Box 1. Comparing samples with the HWM test
The HWM index is a non-parametric homogeneity test that is particularly suitable for small samples with outlying observations. In all cases below, we compare samples of individual country averages. For example, one sample may consist of 15 country average values for the older EU member states whereas the other sample may consist of 12 average values for the new member states. Samples can thus be unbalanced (i.e. have a different number of observations), and have ties (i.e. have identical observations) when the variable in question, such as the amount of PPP finance, is zero for more than one country.
To determine whether samples are drawn from the same distribution, Empirical Distribution Function (EDF) tests can be used if the underlying population distributions are not known. These non-parametric tests are especially attractive when samples are small and contain outlying observations, which is the case in this article. EDF tests quantify in one way or the other percentile-percentile (p-p) plots: the scatter plot of percentile-percentiles of two distributions for all entries of their joint support. Written as a function it reads as:
p F1(F2−1(p)), 0 ≤p≤ 1, (B1)
where F1 and F2 are the empirical distribution functions of the first and second sample respectively. To illustrate, Figure B1 contains the p-p plot which compares the sample of 11 old member states’ ratios of total infrastructure investment to GDP with the sample of 7 corresponding ratios for new member states (see Table 1). In this case, the p-p plot line is above the diagonal, implying that at each domain value the cumulative density of the OMS sample on the vertical axis is larger than the cumulative density of the NMS sample on the horizontal axis. As a share of GDP, OMS thus tend to invest less in infrastructure than NMS. If, in contrast, OMS and NMS had identical investment shares, then the two cumulative distribution functions would be the same, and the p-p plot would coincide with the diagonal.
Figure B1. Comparing total infrastructure investment as a share of GDP in old and new EU member states with the p-p plot
11 10 9 8 7 6 5 4 3 2 1 1 2 3 4 5 6 7 NMS OMS
Hinloopen et al. (2008) therefore propose the area between the diagonal and the p-p plot for hypothesis testing. The associated Harmonic Weighted Mass (HWM) index test has several advantages over other EDF tests. First, the HWM test has more power than any other EDF test when samples are close over their entire domain. Second, it has the unique feature that the exact critical values can be analytically derived for any number of balanced samples free of ties (Hinloopen and Wagenvoort 2010). Third, when there are ties, the HWM test provides a more robust statistic than the L1-version of the well-known Fisz-Cramér-von Mises (FCvM) test in that the HWM statistic is invariant to the position of the tie in the sequence of order statistics. The FCvM test, which sums up over all distances between the two discrete cumulative density functions, does not possess this property.
2.1 Infrastructure finance composition by institutional sector
Let’s now turn to the results. Figure 2 shows the source decomposition of infrastructure finance by country separately for the old member states (OMS, left panels) and the new member states (NMS, right panels). The figures and tables in Section 2 are based on average values over the period 2006-2009, which reflects an average of the pre-crisis boom and the post-crisis investment slump. While there are substantial differences within each group of countries, infrastructure investment is, on average, significantly higher in the NMS than in the OMS. The average ratio of infrastructure investment to GDP in the NMS of 5.1 percent exceeds the corresponding ratio in the OMS of 3.9 percent by about one third (Table 1).
In the NMS, the public sector makes a significantly higher contribution to infrastructure finance than in the OMS. As a share of GDP, NMS governments spend more than double on infrastructure than their OMS counterparts. The same cannot be said for the private sector. The average ratio of private finance to GDP is slightly lower in the NMS (2.3 percent) than in the OMS (2.5 percent). Thus, higher total infrastructure investment ratios in the NMS are mainly explained by higher public contributions. The last column of Table 1 shows that the differences between the OMS and the NMS are significant for total and for government infrastructure finance but not significant for any of the sub-components of private finance at the 10-percent level.
The lower two panels of Figure 2 illustrate the relative importance of each funding source in total infrastructure finance for each country. In the OMS, the public sector accounts on average for about one-third of infrastructure finance. Finance by the corporate sector accounts for slightly more than half, and the remaining part of about one-tenth is distributed between PPPs (5 percent of the total) and non-PPP projects (4 percent of the total). In contrast, in the NMS, slightly more than half of all infrastructure investment is financed by the public sector. Furthermore, 38 percent is financed by the corporate sector, 3 percent by PPPs and another 3 percent by non-PPP projects. Project finance in the NMS is, however, restricted to a limited number of countries: projects are found in only five out of the eight countries for which data are available.
There are notable differences in the composition of infrastructure finance between individual member states. For example, the public sector share in Austria is only 14 percent whereas at the other end of the distribution Poland has a share of 76 percent. Some of the differences might stem from different classification systems in different European countries.
We next analyse the differences in the infrastructure finance composition across sectors of activity.
2.2 Infrastructure finance composition by sector of activity
For the EU as a whole, total infrastructure investment amounts to 3.9 percent of GDP, falling into 2.2 percent of GDP for Transport, 0.7 percent for Utilities, 0.6 percent for Health and 0.4 percent for Education.6 The investment to GDP ratio is statistically significantly higher in the NMS than in the OMS for both the transport and utilities sectors (Table 2). In contrast, the OMS and the NMS spend about an equal share of GDP on infrastructure in Education and in Health.
Economic infrastructure accounts for about three quarters of total infrastructure investment in the EU, social infrastructure for one quarter. As is known from previous research (Alegre et al. 2008), Transport is the single largest infrastructure sector by investment. We find that it accounts for more than half of total infrastructure investment in Europe (Figure 3). Utilities (i.e. energy, water, waste and sewage) come second. The NMS spend a considerably larger fraction (27 percent) of total infrastructure investment on utilities than the OMS (17 percent). As for social infrastructure, the OMS spend more in the health than in the education sector, the exceptions being Ireland and the UK. In the NMS as a group, social infrastructure investment falls into equal shares for Education and Health.
6 The ratios of total investment to GDP are lower in Table 2 than in Table 1 for both OMS and NMS because more countries are available for the sector analysis than for the institutional breakdown.
Relative to GDP, infrastructure investment is, on average, one third higher in the new member states than in the old due to a much higher government share.
EIB PAPERS Volume15 N°1 2010 23 Figure 2. Composition of infrastructure finance across institutional sectors
0 2 4 6 8 10 0 2 4 6 8 10
Non-PPP project PPP Corporate Government
2006-2009 average, in percent of GDP
Old member states (OMS) New member states (NMS)
2006-2009 average, as a share of total infrastructure finance
Old member states (OMS) New member states (NMS)
PL HU MA NMS CY SI CZ EE FR UK DE OMS EL IT FI SE AT PT ES IE 0.0 PL HU MA NMS CY SI CZ EE 0.2 0.4 0.6 0.8 1.0 0.0 0.2 0.4 0.6 0.8 1.0 FR UK DE OMS EL IT FI SE AT PT ES IE
Source: Eurostat, Projectware, EIB/EPEC
Table 1. Average infrastructure finance to GDP ratio, by funding source
2006-2009 average, in percent of GDP HWM test results for a
comparison between the OMS and the NMS
Old member states New member states
Total 3.90 5.07 0.578* Government 1.35 2.81 0.712* Private 2.55 2.25 0.528* Corporate 2.22 1.93 0.501 PPP 0.19 0.18 0.384 Non-PPP project 0.14 0.15 0.376 Number of observations 11 7
Source: Eurostat, Projectware, EIB/EPEC; own calcuations
Notes: The HWM critical value for samples with 11 (OMS) and 7 (NMS) observations is 0.512, 0.593, 0.673 and 0.766 at the 90th, 95th, 97.5 and 99th percentile, respectively (see Hinloopen et al. 2008). Differences that are significant at the
Figure 3. Composition of infrastructure finance across sectors of activity 0 2 4 6 8 10 0 2 4 6 8 10
Transport Utilities Health Education
2006-2009 average, in percent of GDP
Old member states (OMS) New member states (NMS)
2006-2009 average, as a share of total infrastructure finance
Old member states (OMS) New member states (NMS)
PL HU MA NMS LT CY LV SI CZ SK EE FR NL UK DEOMSIT EL FI SE AT BE DK PT ES LU IE FR NLUK DE OMSIT EL FI SE AT BE DK PT ES LU IE 0.0 0.2 0.4 0.6 0.8 1.0 0.0 0.2 0.4 0.6 0.8 1.0 PL HU MA NMS LT CY LV SI CZ SK EE
Source: Eurostat, Projectware, EIB/EPEC
Table 2. Average infrastructure finance to GDP ratio, by sector of activity
2006-2009 average, in percent of GDP HWM test results for a
comparison between the OMS and the NMS
Old member states New member states
Total 3.7 5.3 0.751* Education 0.4 0.5 0.460 Health 0.6 0.5 0.444 Transport 2.1 2.9 0.555* Utilities 0.6 1.4 0.836* Number of observations 15 10
Source: Eurostat, Projectware, EIB/EPEC; own calculations
Notes: The HWM critical value for samples with 15 (OMS) and 10 (NMS) observations is 0.504, 0.588, 0.653 and 0.746 at the 90th, 95th, 97.5 and 99th percentile, respectively (see Hinloopen et al. 2008). Differences that are significant at the
10-percent level are indicated with an asterisk.
Considering the sources of finance (Figure 4 and Table 3) in the EU, there are important differences between Education and the other sectors. The public sector accounts for more than 85 percent of investment in Education. In the health sector, private finance (68 percent) is more than twice the size
EIB PAPERS Volume15 N°1 2010 25 of public finance (32 percent). In the social sectors, PPP projects have a share of about 6 to 7 percent
in total finance but are found in only a relatively small number of countries. Non-PPP project finance is nearly non-existent.
As to economic infrastructure, between one fifth and one third of it is financed by governments. Corporations finance about 60 percent of economic infrastructure. There are no statistically significant differences between the transport and utility sectors in the shares of either government or corporate-sector finance. By contrast, the type of project finance differs significantly between Transport and Utilities. The share of PPP finance is significantly higher in the transport sector (5.1 percent) than in the utility sector (1.8 percent). Conversely, the share of non-PPP project finance is significantly higher in the utility sector (16.4 percent) than in the transport sector (1.1 percent).
Figure 4. Composition of infrastructure finance across sources, by sector of activity
0.0 0.5 1.0 1.5 2.0 2.5 3.0
Non-PPP project PPP Corporate Government
2006-2009 EU average, in percent of GDP 2006-2009 EU average, as a share of total
Education Health Utilities Transport 0.0
0.2 0.4 0.6 0.8 1.0
Education Health Utilities Transport
Source: Eurostat, Projectware, EIB/EPEC
Table 3. Composition of infrastructure finance in the EU across sources, by sector of activity
2006-2009 average, in percent of
total finance HWM test results for a comparison between sectors
Education Health Transport Utilities HWM (All) HWM (Education,
Health) HWM (Transport, Utilities)
Government 87.1 32.4 31.2 21.5 1.812* 1.353* 0.423 Private 12.9 67.6 68.8 78.5 1.812* 1.353* 0.423 Corporate 5.7 61.6 62.6 60.3 1.672* 1.365* 0.249 PPP 6.7 5.8 5.1 1.8 1.057* 0.096 0.700* Non-PPP 0.5 0.2 1.1 16.4 1.485* 0.204 0.708* Number of observations 24 24 20 20
Source: Eurostat, Projectware, EIB/EPEC; own calculations
Notes: The HWM critical value for 4 samples with 20 (OMS+NMS) observations is 0.84, 0.91, 0.97 and 1.05 at the 90th, 95th,
97.5 and 99th percentile, respectively. The HWM critical value for 2 samples with 20 (OMS+NMS) observations is
0.5060, 0.5850, 0.656 and 0.7518 at the 90th, 95th, 97.5 and 99th percentile respectively. The latter values can also be
used for a comparison of 2 samples with 24 observations (see Hinloopen et al. 2008). Differences that are significant at the 10-percent level are indicated with an asterisk.
Government accounts for more than 85 percent of investment in
Education and for one fifth to one third in Health, Utilities, and Transport.
2.3 Instruments of project finance
Finally, we further decompose infrastructure finance along financial instruments. This can only be done for infrastructure investment financed through project finance/PPPs.7 Figure 5 shows the composition of project finance at financial close. The lion’s share of project finance consists of loans, which are often supplied by a syndicate of lenders. On average, about 80 percent of a project (77 percent for PPPs and 83 percent for non-PPPs) is funded by loans. Bond finance contributes another 6 percent, which leaves an equity share of 14 percent. The average debt-to-equity ratio is thus approximately six, implying that overall, projects have a higher gearing ratio than corporations. There are no significant differences in capital structure between PPP and non-PPP projects (Table 4).
Projects in the education and health sectors are, on average, more highly leveraged than projects in the transport and utilities sectors. For example, the equity share is only 6 percent in the health sector while it is 19 percent in Utilities. In particular, bond finance is more important in social infrastructure than in economic infrastructure. Education and health projects are concentrated on a small number of countries. That said, the total number of social-infrastructure projects (28 percent of the total) is in line with the share of social infrastructure in total infrastructure investment.
Figure 5. Composition of project finance across financial instruments
2006-2009 EU average, as a share of total, by sector of activity PPP Non-PPP 0.0 0.2 0.4 0.6 0.8 1.0 PPP Non-PPP 0.0 0.2 0.4 0.6 0.8 1.0
2006-2009 EU average, as a share of total, by project type 0.0 0.2 0.4 0.6 0.8 1.0
Education Health Utilities Transport
Bond Loan Equity Source: Projectware
Table 4. Average capital structure of EU projects
2006-2009 average, in percent of total HWM test results for a
comparison between PPP and non-PPP projects
PPP Non-PPP Equity 12 15 0.309 Debt 88 85 0.309 Loan 77 83 0.232 Bond 10 2 0.099 Number of observations 16 16
Source: Projectware; own calculations
Notes: The HWM critical value for samples with 16 (OMS+NMS) observations is 0.5082, 0.5856, 0.6629 and 0.7513 at the 90th, 95th, 97.5 and 99th percentile, respectively (see Hinloopen et al. 2008). Differences that are significant at the
10-percent level are indicated with an asterisk.
7 No breakdown of infrastructure finance is available for the corporate sector as it is difficult to disentangle infrastructure finance from the financing of other business activity. As to government investment, it may be seen as 100 percent debt-financed in countries where governments run budget deficits in excess of their infrastructure investment, which was and still is the case for most EU member states.
On average, about 80 percent of a project is funded by loans, 6 percent by bonds and 14 percent by equity.
EIB PAPERS Volume15 N°1 2010 27
2.4 Main findings
The main findings on the decomposition of infrastructure finance presented above can be summarized as follows:
1. Total infrastructure investment in the NMS is higher than in the OMS because government investment is higher. As a share of GDP, the NMS invest more than the OMS in economic infrastructure and as much as the OMS in social infrastructure.
2. In the OMS, the government sector accounts for one third of infrastructure finance. In the NMS, governments finance half of all infrastructure.
3. The largest part of private finance consists of finance by the corporate sector. Project finance accounts for slightly less than ten percent of total finance. In both the old and new member states, slightly more than half of project finance volume is used to fund PPPs.
4. Considering the breakdown of infrastructure finance by sector of activity, the government is by far the most important source of investment finance in Education. In contrast, private finance is about twice as big as public finance in the health sector. The government sector finances about one fifth to one third of the economic infrastructure.
5. On average, 86 percent of a project is debt-financed. Projects in social infrastructure are more leveraged than projects in economic infrastructure.
To finish where we started, it needs to be re-emphasised that the breakdowns presented in this section should be considered as a first attempt with many remaining caveats. The fact that gross fixed capital formation bundles investment in narrowly defined infrastructure assets (i.e. assets with network characteristics) and other assets, such as equipment, is perhaps the biggest problem.
3. Long-term evolution
The finance source composition of the previous section reflects the situation at the end of the first decade of the 21st century. As will be demonstrated next, in the past the government sector played a more important role in the financing of infrastructure.
Total government investment as a ratio to GDP fell from almost 5 percent in the 1970s to less than 2.5 percent at the turn of the century (Figure 6). Obviously, total government investment includes more than infrastructure investment only, as it also includes public goods, such as defence and environment, and, re-distribution, such as social protection and recreation. However, we know from previous studies that the share of infrastructure in overall government investment has remained fairly stable over time, implying that government infrastructure investment fell at about the same pace as overall government investment. Infrastructure investment accounts on average for about half of total government investment (Alegre et al. 2008). By putting these two elements together, we can estimate the (smoothed) evolution of government infrastructure investment, which is depicted by the dotted line in Figure 6. Drawn-out episodes of fiscal consolidation, ultimately aimed at addressing fiscal sustainability concerns, were the key factor behind the fall in government investment (Välilä et al. 2005). The reasonably steep decline in government infrastructure investment levelled off at the end of the 1990s.
What about private finance? As said before, private finance comes in different forms. Although we cannot quantify the change in total private finance due to a lack of data, perhaps the most striking and illustrative development is the rise in Public-Private Partnerships (see right panel of Figure 6). They were introduced in the UK in the beginning of the 1990s. About ten years later, a significant number of PPPs had also been undertaken in other EU countries. In the year 2000, about 80 percent of PPPs
Project finance accounts for slightly less than ten percent of total infrastructure finance in the EU.
were realised in the UK. Today, the majority of PPPs are realised outside the UK. As demonstrated by Kappeler and Nemoz (2010), the PPP market in Europe continues to diversify across countries and sectors.
The first main finding of the long-term analysis thus is that public finance declined while private project finance increased. These two major events suggest that over the last forty years, at least qualitatively, the decline in government finance has been partly offset by an increase in the relative importance of private finance. Quantitatively, however, the increase in private finance remains relatively small because the share of project finance in infrastructure is so far relatively small. Overall, there has thus been a decline in infrastructure investment.
Figure 6. Long-term evolution of public and private finance sources
Ratio of government investment to GDP in the EU-15 Number of PPP projects in the EU-27 0 1 2 3 4 5 Total government Of which infrastructure UK 77% 41% 1970 1975 1980 1985 1990 1995 2000 2005 2010 0 20 40 60 80 100 120 Total 1990 1995 2000 2005 2010
Source: OECD, EPEC
A second finding reported in the literature relates to the cyclical component of public infrastructure investment. In general, infrastructure investment is pro-cyclical (Välilä et al. 2005). Higher levels of GDP tend to be associated with higher public infrastructure investment. However, examples exist of episodes during which government investment behaved counter-cyclically. In times of extreme economic conditions, as during the great depression of the 1930s, governments became the crutch of capital by increasing their spending on infrastructure (Margairaz 2009).
Let us dig slightly deeper into the evolution of the different finance sources in the last decade as more detailed data are available for this period. We first look at the role private and public sectors play in the evolution of infrastructure investment in the economy. This part of the analysis is based on both Eurostat and Projectware data. As before, Eurostat flow data show the amount of investment in a particular year, while the stock data on project finance show the total capital value of the project reaching financial close in that same year. As in Section 2, the two data sets are made compatible by distributing the project capital values proportionally over the five years following the financial close date. The data here thus refer to the contribution of the different finance sources to investment in a particular year. They do not necessarily reflect the moment of the finance decision, which may precede the investment flow by a number of years.
The upper two charts of Figure 7 indicate that infrastructure investment closely followed the business cycle in the last ten years. Total investment as a share of GDP fell between 2001 and 2003 after the burst of the dotcom bubble in the year 2000. It rose during the period of economic recovery between 2004 and 2007 before falling back in 2009 as a result of the crisis. There are no major differences between old and new member states in these developments. As discussed in Section 2, investment is, however, substantially higher in the NMS than in the OMS.
The increase in private infrastructure finance has partly offset the decline in public finance.
EIB PAPERS Volume15 N°1 2010 29 Figure 7. Evolution of infrastructure finance by institutional sector
0 2 4 6 8 0 2 4 6 8
Non-PPP project PPP Corporate Government
In percent of GDP
Old member states (OMS) New member states (NMS)
As a share of total infrastructure finance
Old member states (OMS) New member states (NMS)
0.0 0.2 0.4 0.6 0.8 1.0 0.0 0.2 0.4 0.6 0.8 1.0 2000 2001 PPP and non-PPP projects are not shown separately before 2004
2002 2003 2004 2005 2006 2007 2008 2009 2000 2001 2002 2003 2004 2005 2006 2007 2008 2009 PPP and non-PPP
projects are not shown separately before 2004
2000 2001 2002 2003 2004 2005 2006 2007 2008 2009 2000 2001 2002 2003 2004 2005 2006 2007 2008 2009 PPP and non-PPP
projects are not shown separately before 2004 PPP and non-PPP
projects are not shown separately before 2004
Source: Eurostat, Projectware, EIB/EPEC
The cyclicality of total infrastructure investment (as a share of GDP) in the last decade is entirely explained by business cycle fluctuations in private finance. In contrast, government infrastructure investment as a share of GDP was rather stable in the EU as a whole, and actually increased slightly in 2008 and 2009. To what extent the latter is due to a fall in GDP or the result of an increase in government investment volumes is analysed in the next section.
As a result, the share of government finance in total infrastructure finance has recently increased. The bottom two panels of Figure 7 show the relative importance of each funding source in total finance. For example, in the OMS, the share of public finance rose from 30 percent in 2007 to 41 percent in 2009. In the NMS, the government share rose from 41 percent to 44 percent over the same period for a select number of countries for which longer-term data are available.
The rise in the share of project finance, in particular PPPs, is a more structural phenomenon as it started well before the recent crisis. The share of (annual) investment financed through projects rose from 5 percent in 2004 to 11 percent in 2009 in the OMS, and from 2 to 7 percent in the NMS. Project data are not available before 2004. We need to stress, however, that Figure 7 does not reflect the timing of the project approval. As we show next, part of the rise in project finance shares in 2008 and 2009 stem from projects that were launched already before the recent crisis.
The cyclicality of total infrastructure investment in the last decade is entirely explained by business cycle fluctuations in private finance.
4. Crisis impact
4.1 Crisis impact by institutional sector
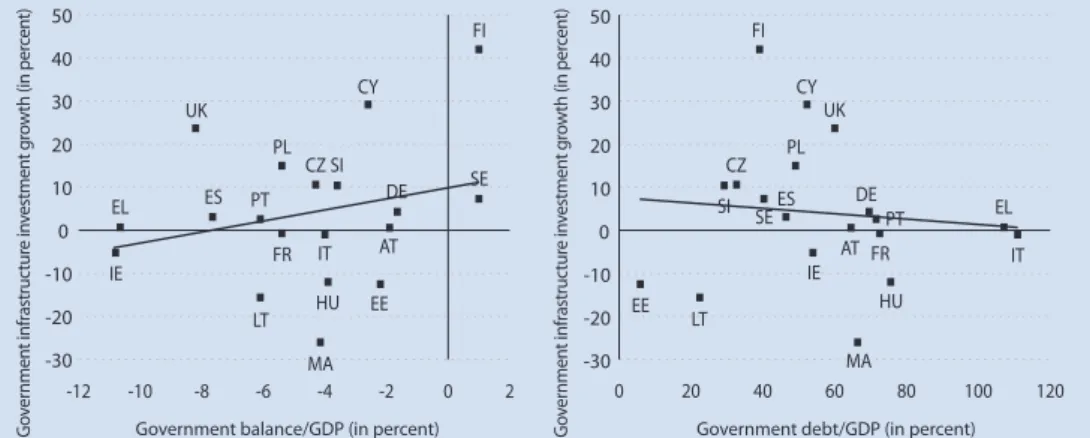
To get a clearer picture of the crisis impact, we next present the annual growth rates of inflation-adjusted absolute investment. Since infrastructure finance in general is pro-cyclical, the variance in absolute volume tends to be higher than the variance in the ratio of investment volume to GDP. Figure 8 confirms this, and shows striking differences between public and private finance sources. Since the recent crisis began, the increase in public finance, which stood at 3 percent in the OMS in 2007, has risen to 8 percent. In contrast, private finance fell by 4 percent in 2008 and another 13 percent in 2009 (Table 5). In total, private finance thus fell by more than 15 percent since the beginning of the recent crisis. On average, there are no important differences between the OMS and the NMS in this respect.
Figure 8. Crisis impact on
![Figure 1. Composition of infrastructure finance Corporate PPP Project Non-PPP Project Traditional procurement [ Project ]InfrastructurefinancePrivateGovernment](https://thumb-us.123doks.com/thumbv2/123dok_us/251170.2525517/22.892.226.793.172.497/composition-infrastructure-corporate-project-project-traditional-procurement-infrastructurefinanceprivategovernment.webp)