1
Introduction
2
Contents
Contents
Introduction 3
Chairman’s Half Year Review & Forecast 3
Goram Homes’ Mission & Values 4
Summary of Financial Projections 5
Location & Operational Area 5
Branding & Communications 6
B Corp
7
Social Value
8
Environmental
9
Building for Bristol
11
Market Analysis & Business Risk
12
UK Housing Market 12
Bristol Housing Market 13
Risk management 14
Development Activity
15
Site identification process 15
Procurement 15
Design and Quality standards 16
Development Programme 17
Financial Projections
18
Building the Financial Plan 19
Land purchase funding 19
Cash Investment in Partnerships 20
Profit & Loss 21
Operating Costs 22
Cash Flow 23
Balance Sheet 24
Stress Testing 25
Appendix A
27
Strategic Business Plan level KPI’s 27
Appendix B
28
Assessment of Key Risks 28
Appendix C
29
Goram Innovation Action Plan 29
Appendix D
31
3
Introduction
Introduction
Chairman’s Half Year Review & Forecast
Half year review
Goram Homes is uniquely positioned as a leading local housing developer with a strong land supply that can really deliver for Bristol and our shareholders.
I am proud that, despite unprecedented global events, under the leadership of our Managing Director, Stephen Baker, the new team have made significant progress. In September this year, working closely with Bristol Holding & Bristol City Council, we signed contracts on our first project to deliver 268 new, high quality homes in Lockleaze at Romney House. We responded rapidly to COVID-19 with the safety,
health and wellbeing of our employees, customers, suppliers, and partners as our top priority. An existing agile IT set up allowed our team to transfer to remote working very quickly. The team have continued to work throughout the pandemic, and it was not necessary for Goram Homes to access either of the Government’s tax deferral or job retention schemes. We have a robust balance sheet with significant financing headroom from our shareholder Bristol City Council. With the Council, Goram Homes maintains a valuable and deliverable pipeline of over 1000 homes.
Current trading and outlook
The market has made a strong start to the second half of the year supported by positive market trends. Our partners on the Romney House project, Vistry Group, reported that their sales rate, since July 1st, was up by 20% on the previous year at 0.73 (2019: 0.61). This is reflected by others operating in the Bristol region. Our market insight reports that pricing remains firm and we see minimal cost inflation. Costs may be impacted should there be a negative impact from the Brexit process, and this would likely be realised in early 2021. Goram Homes is well positioned to capitalise on these opportunities, and we are on
track to deliver a strong performance in the second half of the year.
By the end of 2020/21 we will have:
N Entered into two joint venture contracts
N Established a pipeline of 1400 homes
N Established a repeatable legal
joint venture template
N Established a fully operational business
N Made a financial contribution
to the council of £2.8m
3
4
Introduction
Goram Homes’ Mission & Values
Goram Homes works in partnership to build quality homes that create communities which are environmentally, socially and economically
sustainable. Our values, reflect who we are and who we want to be:
N We are passionate about what we do
N We build partnerships with purpose
N We innovate to succeed
For our people: This means we employ people who share our values – they are committed to working in partnership and passionate about building communities that are celebrated for their design and sustainability credentials.
For our partners: We are adaptable, fleet of
foot, we will work collaboratively and consider different approaches to achieve our goals.
For our communities: We work in
partnership with our communities to build homes where they want to live, that respect the environment, contribute to the economy and are sustainable.
Goram Homes Ltd has three primary objectives, to:
Objectives
Targets
Objective 1:
Increase the supply of new homes built each year across Bristol
N By March 2025, to have delivered at
least 500 new homes and to have an
identified pipeline of projects which, in
total, will deliver a further 2,000 homes.
Objective 2:
Build good quality homes and create communities where people wish to live
N For all projects to meet at least 10 out of
12 on the Building for Life (BfL12) score.
N To achieve and maintain a 90%
customer satisfaction score.
Objective 3:
Operate commercially and provide financial returns to Goram Homes’ sole shareholder – Bristol City Council
N Deliver a programme level 15% profit
on Gross Development Value.
N Operating costs delivered in line with
5
Introduction
Summary of Financial Projections
In this section we have set out the investment made by Bristol City Council into GoramHomes and the forecast financial returns. This year we created our first joint venture to
start development at Romney House and we will soon enter our second agreement for a development at Baltic Wharf. By the end of 2026 we plan to have generated
£19m of profit after tax and paid £67m of
cash to Bristol City Council in relation to land purchase loans created on acquisition of land from Bristol CIty Council.
The social value figures will increase as developments are firmed up with selected
partners, at which point Social Value generated will be evaluated and added to the above. The table below shows an extract of our
financial activity from 2020 to 2026 (although
developments will remain in progress beyond the timeline of the Business Plan).
The projections we make in this section will
continue to change each year as details of
our development schemes evolve. This reflects
the development process being a long-term cycle where it can take up to four years from
the start of a project to all homes being sold.
Location & Operational Area
Goram Homes functions from its officebase in Bristol and our primary focus will be to operate within Bristol, particularly
as our first developments will be on land
provided by Bristol City Council.
However, as the business grows and becomes more established in the marketplace,
development opportunities will arise which span a wider geographical area.
Financial extracts £’000 2020 2021 2022 2023 2024 2025 2026
Cumulative Retained
Profit/(Loss) after Tax (820) (1,956) (4,193) (1,683) 11,737 17,037 18,812
Cumulative Realisation of
land value paid to BCC - 2,820 8,838 19,915 36,137 53,514 67,006
Cumulative Social Value
6
Introduction
Branding & Communications
Goram Homes has a distinct model which blends a high quality, commercial offer with our commitment to delivering added social value - remaining true to
our origins. Goram Homes’ branding and communications will reflect the values
and ambitions in the business plan and be designed to build understanding and engagement with our shareholders, partners, and the communities we work with.
We will deliver:
N A brand strategy aligned to business
objectives; future-proofed and flexible enough to allow us work
with partners beyond Bristol
N A digital-first approach; innovative use
of technology wherever possible to widen our reach, respond to consumer and stakeholder behaviour and ensure we are as accessible as possible
N Mission and values which articulate
our distinct business model and social value simply and clearly
N Narrative and messaging which tells our
story, reflecting both our origins and our
business ambitions and industry expertise
N A visual identity and logo that is clean,
fresh, commercial, and appealing. A brand that looks at home next to competitors and partners
N A language and tone of voice that is
human, inclusive, and jargon-free
N Community engagement that is
open and transparent – tailored, interactive, accessible
N Content that celebrates our partners
and our city and champions innovation and local talent
N Partnerships and collaboration with
like-minded businesses, influencers and industry
leaders who are committed to investing in people, quality, and innovation
7
B Corp
B Corp
Goram Homes is a commercially run business with social values at its heart. Delivering homes that Bristol is proud of, in developments that build real communities and are celebrated for their design and sustainability credentials is what drives us. This is why, over the coming year, Goram Homes will be working towards
gaining Certified B Corporation status.
Certified B Corporations are businesses
that meet the highest standards of social and environmental performance, public transparency, and legal accountability
to balance profit and purpose. B Corp Certification is the only certification that
measures a company’s entire social and environmental performance.
B Corp Certification offers Goram Homes
an evidence-based approach that proves to our partners and stakeholders that our business is meeting the highest standards of performance.
An additional benefit is the link to Bristol City Council’s One City plan. This plan brings together a wide range of public, private, and third sector partners within Bristol with the shared goal of making Bristol a fair, healthy and sustainable city. Both B Corp and the One City plan are based on the UN’s Sustainable Development Goals and
so, by gaining certification, we will align our
business with the One City Plan’s ambitions. Artistic impression of the new neighbourhood at Baltic Wharf
8
Social Value
Social Value
As well as acting commercially, contributing positively to society and acting as a catalyst for long-term change in the places we work is a priority for Goram Homes. We will generate social value through the delivery of new homes and developments which transform buildings, environments, and communities. In partnership with
communities in which we operate, we will identify and deliver engagements
that address their specific needs and enable better business and community
wellbeing. By working collaboratively with our stakeholders, we aim to create the maximum economic, social, and environmental impact in all that we do.
We will record and measure our social value using the National Themes Outcomes and
Measures (TOMs) Framework. Goram Homes’ TOMs, developed with the Social Value Portal, are aligned to Bristol City Council’s TOMs, but focused on our activity and the National Real Estate TOM’s. Using this framework, we have challenged our partners to combine high-quality urban design with a community investment strategy that addresses local priorities,
fosters social innovation, and supports economic growth. Each of the projects we work
on will be measured on an annual basis and validated by the Social Value Portal.
We will focus on four key themes:
1.
Innovation: Promoting Social InnovationInvesting in diverse and inclusive
community networks and leveraging our skills and expertise to address local issues and facilitate social innovation.
3.
Social: Healthier, Safer, and more Resilient CommunitiesTo have a positive impact on our residents and employees’ mental and physical health and reduce inequalities.
2.
Jobs: Promote Local Skills and EmploymentContributing to local economic growth by supporting local businesses, investing in infrastructure and improving employment prospects for local people e.g. by working with the South Bristol Skills academy.
4.
Environment: Decarbonising and Safeguarding our WorldBuild a resilient community that unlocks growth in the green economy, regenerates ecosystems and enables people to
interact with the natural world.
The assessments for our first two projects are:
Project Quantified Social Value Generated
Romney House £14.2m
Baltic Wharf £10.6m
9
Environmental
Environmental
In 2018 Bristol declared an environment and climate emergency. Goram Homes believe that the climate emergency demands urgent action and leadership across
the construction industry. We must act now, ensuring that new and retrofit buildings
deliver as close to net zero whole life carbon in advance of any future regulation. We know that net zero operational carbon is possible, and we are committed to extending good practice to all our future work and leading the way. For this reason, sustainability underpins our approach to operations and business planning.
To ensure that our words are matched by actions, Goram Homes will adopt the RIBA 2030
Climate Challenge Targets for operational energy use, embodied carbon and water
use reduction. The targets are progressive yet realistic and a vital first step to ensure the construction industry has delivered significant reductions by 2030. Our project teams will aim for a percentage reduction of the current environmental baselines for future projects (after
Romney House and Baltic Wharf) by using the targets set out in the detailed tables below.
In line with Bristol City Council’s One City Climate Strategy and Ecological Emergency Strategy, Goram Homes is committed to delivering increased biodiversity and carbon neutral housing. How we achieve this will vary from site to site, but will result in additional costs ranging between
8% and 11% of existing project costs. This would lower the price payable to the Council for the
land and mean we would need to obtain additional borrowing from either the Council or a third party lender.
We will also adopt the Building with Nature Standards - a framework of standards for good
green infrastructure which encourages developers to create places that really deliver for people and wildlife.
RIBA Sustainable
Outcome Metrics Current Benchmarks Notes
kWh/m2/y 146 kWh/m
2 /y < 105 kWh/m2/y < 70 kWh/m2/y < 0 to 35 kWh/m2/y UKGBC Net Zero Framework 1. Fabric First
carbon heat
3. Maximise onsite renewables UK schemes (CCC) Embodied Carbon
2e/m2
2e/m2
(M4i benchmark) < 2e/m
2 <
2e/m2 < 2e/m2 RICS Whole Life Carbon (A-C)1. Whole Life Carbon Analysis
UK schemes (CCC) Potable Water Use
Litres/person/day 125 l/p/day < 110 l/p/day < 95 l/p/day < 75 l/p/day
CIBSE Guide G
Best Practice
Health Metrics References
25-28 °C maximum for 1% of occupied hours CIBSE TM52, CIBSE TM59
> CIBSE LG10
CO2 levels < 900 ppm CIBSE TM40
Total VOCs < 3) Approved Document F
Formaldehyde < 3) BREEAM
RIBA Sustainable
Outcome Metrics Current Benchmarks Notes
kWh/m2/y 146 kWh/m
2 /y < 105 kWh/m2/y < 70 kWh/m2/y < 0 to 35 kWh/m2/y UKGBC Net Zero Framework 1. Fabric First
carbon heat
3. Maximise onsite renewables UK schemes (CCC) Embodied Carbon
2e/m2
2e/m2
(M4i benchmark) < 2e/m
2 <
2e/m2 < 2e/m2 RICS Whole Life Carbon (A-C) 1. Whole Life Carbon Analysis
UK schemes (CCC) Potable Water Use
Litres/person/day 125 l/p/day < 110 l/p/day < 95 l/p/day < 75 l/p/day
CIBSE Guide G
Best Practice
Health Metrics References
25-28 °C maximum for 1% of occupied hours CIBSE TM52, CIBSE TM59
> CIBSE LG10
CO2 levels < 900 ppm CIBSE TM40
Total VOCs < 3) Approved Document F
10
Innovation
Innovation
Established in Bristol, for the people of Bristol, Goram Homes is dedicated to exploring new ways
of working that will benefit our city and deliver our developments most effectively. Whether that is
working with Bristol Housing Festival on Modern Methods of Construction or using new technologies to engage the public in the consultation process, we are open to adopting new tools and emerging solutions. As a small, agile company that collaborates with a range of creative businesses, we are perfectly placed to embrace innovation and embed it into our practices.
Future Cities Catapult have identified nine housing innovation concepts they believe can
help solve many of the challenges facing the housing industry. Goram Homes will focus on
five of these areas where we can integrate best practice into our business and our innovation
action plan, created with Bristol Housing Festival. For the full action plan see Appendix C.
Connected Homes
N The number of connected devices
in homes is predicted to grow rapidly from the current level of 10–20 to more than 35 by 2020, according to Intel
N With more connected devices in homes, a
more integrated and efficient approach is
required to help manage all devices and relevant apps from a variety of suppliers
N The advancements in wireless network
and automation technology are
enabling home-used devices to be better connected and controlled smartly
Low Carbon Houses
N GHG emissions are not falling at
the rate required to meet the UK’s 2050 carbon targets
N Domestic energy use contributes to
about 30% of the UK’s total energy budget and 20% of UK’s GHG
emissions, representing a key area for decarbonisation, according to the IET
N A large percentage of preventable
winter deaths are attributed to living in a cold home, according to E3G
Assisted Living
N The UK population is getting older, with
18% aged 65 and over, of which 32% are living alone, according to ONS
N Nearly one in eight older people now
live with some level of unmet need that would limit their ability to carry out vital everyday tasks, according to Age UK
N Almost one-fifth of the UK population
are disabled, and over a quarter of those experience some form of limitation of choice or control over their daily lives, according to ONS
Modern Construction Methods
N Productivity growth in the construction
sector has been low and lagged behind the UK economy since 1995, which has limited the sector’s ability to deliver more and better homes
N By 2026, the construction industry could
see a 20-25% decline in the workforce, according to Homes England
N 10% of the UK’s carbon emissions
are directly associated with
construction, according to UKGBC
Innovative Financing
N To meet the UK’s 2020 housebuilding
objectives or retrofit existing housing
stocks to meet the 2050 carbon targets, the public funds available fall far short of what is required
N Smaller house builders were
usually disadvantaged in
accessing private finance
N For home buyers and buy-to-let
investors, finding the best mortgage
11
Introduction
Building for Bristol
Ensuring that Bristol’s bestinterests are our first priority
is built into Goram Homes’ governance structure with Bristol City Council as our ultimate shareholder and Council representation on our Board. We will also be creating as many opportunties as possible to engage directly with Bristol
residents and reflect their
voices and needs in our work. Open and honest
communication is the key to effective engagement, and this will be at the heart of our approach to consultation. We know that local residents
often have an intimate knowledge of a location we are considering redeveloping and that their insight can help us deliver high-quality, mixed tenure, new homes for Bristol. We want to reach
underrepresented groups
and the often-silent majority
to ensure that as many people as possible have a chance to contribute. To do this, we will work with specialists and our partners to identify the biggest barriers to
engagement, find the most
effective solutions and, where appropriate, employ new methods and technologies,
to ensure our consultations are as representative of the community as a whole as possible.
Building homes that create strong communities is part of our commitment to investing in Bristol. Our 2021 Business Plan will include recommendations on how we could retain an interest in the management and maintenance of all schemes we deliver, to empower residents and reassure them that we will be alongside them when they buy a home from Goram Homes.
Artistic impression of the new neighbourhood at Romney House – HTA Design
11
Building for Bristol
12
Market Analysis & Business Risk
Market Analysis
& Business Risk
Goram Homes have worked with BuiltPlace who provides independent
data-led research, analysis, and reporting on the UK housing market to complete a review of both the UK housing market and the local Bristol market.
UK Housing Market
2020 has been an incredibly volatile year for the UK’s housing market with massive
uncertainty about the current, let alone future, state of the economy and housing market. There are clearly some big changes underway in terms of how we live and work, but it is not yet clear whether they are temporary
adjustments to the pandemic or the start
of longer-term trends. That volatility and uncertainty looks set to continue into 2021. The year started with some signs that the housing market was starting to bounce back following a couple of years of lower house price growth and subdued transactions. The General Election result suggested an end of the Brexit uncertainty was in sight. Activity levels including mortgage approvals for house purchase increased and Nationwide reported higher rates of house price growth. But then the pandemic and lockdown hit.
For perhaps the first time in recent history, the
housing market was not directly responsible for or implicated in the economic crash. House prices, although unaffordable to many, were at
the levels you would expect given earnings and mortgage rates. New mortgage borrowers were perhaps the least risky ever given the hurdles they needed to pass. Meanwhile, government and mortgage lender support helped many households get through lockdown. Thanks to all these factors, and despite the collapse in the economy and transactions, there was no immediate crash in house prices. The housing market reopening in England caught many by surprise but it quickly became apparent that there would be a summer boom. Interest and activity data showed there
were large numbers of people financially
unaffected by the recession. Some of those were keen to get on with their delayed move. Others had reassessed what they wanted from their home during lockdown and decided to move. To top it off, the government launched a stamp duty holiday, and the summer boom was set. Many of the sales agreed over the summer will only reach completion during the autumn and so it is likely that news stories about fast rising house prices and high activity will continue through to the end of 2020.
-100% -80% -60% -40% -20% 0% 20% 40% 60% 80% Ja n Fe b Ma r Ap r
May Jun Jul Au
g Se p D iffe re nc e to 2 01 9
Sales Subject to Contract Mortgage Approvals Transactions
13
The housing market appears likely to avoid a crash during 2020 but the prospects for 2021 are far less certain. There are already signs that the boom is slowing though the end of the stamp duty holiday in March will create a spike in transactions as buyers rush to beat the deadline. Many of those buyers would have bought in following months but chose to bring their purchase forward. Therefore, turnover will be much lower in April and the months after if the holiday is not extended. Unfortunately, low turnover increases the risk that a relatively low number of forced sales, whose impact might normally be contained, could have a bigger negative impact on the wider market. The approach of mortgage lenders will be essential in keeping forced sales to a minimum and they will be under considerable pressure to do so. Their return to lending at higher loan-to-value ratios could
also help first-time buyers return to the market
during this period. However, there will still be some parts of the housing market at risk from the rising unemployment, falling incomes, and
falling rents that appear highly possible in 2021. Next year may also be the year when we
finally find out what Brexit means and what
impact it will have on our lives and the economy. It is increasingly clear that any
benefits (if they exist) will be realised over
the long term. However, the costs could be
immediate and significant. Therefore, it is still
far from certain what impact Brexit will have on the housing market. This is yet another large uncertainty that makes predicting the future
particularly difficult if not near impossible.
There are a range of different outcomes for the UK’s housing market next year and, unfortunately, all are currently possible.
There remains the significant risk of a crash
though we could instead see stagnation with low sales and static house prices. Alternatively, there might be a boom
driven by home movers continuing to trade location for space or triggered by a Covid-19 vaccine. Whatever happens, volatility
and uncertainty look set to continue.
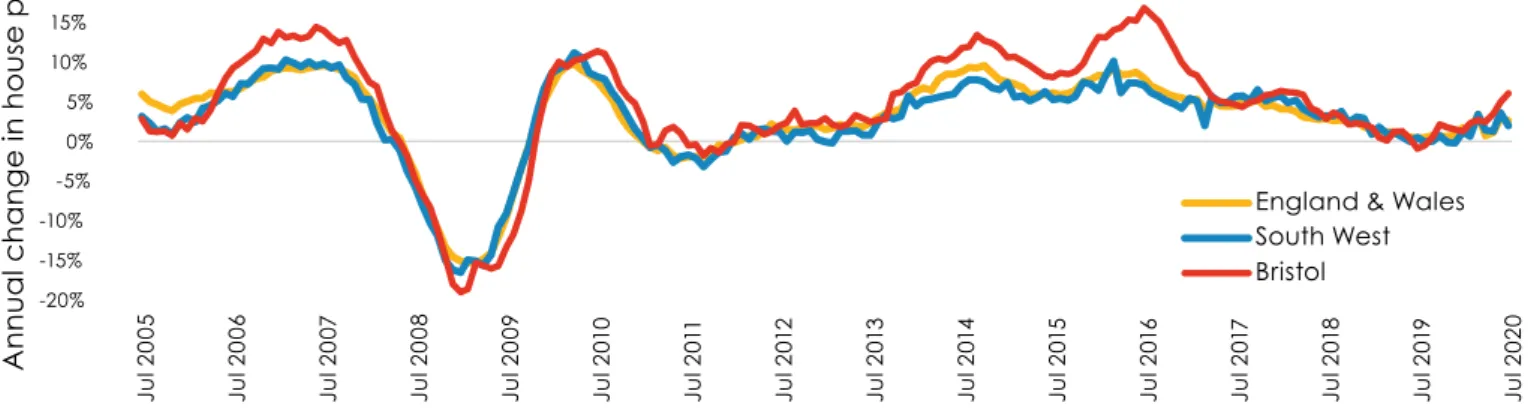
Bristol Housing Market
Bristol’s housing market has been popular during recent housing booms with house prices rising faster than the regional and national averages during periods of higher demand. Emerging data from ONS suggests that this trend is continuing with house prices rising 6% in the year to July 2020. Though many of the transactions this data is based on will be delayed transactions rather than newly agreed sales post lockdown. Less
volatile Zoopla data reported Bristol house prices rising 2.9% in the year to August 2020. Much of the local market evidence on the trends emerging post lockdown is based on anecdote or limited data. Therefore, it is still not clear which are temporary changes, and which are permanent. Despite this uncertainty, there appears a broad national trend in
stronger demand from wealthier buyers for
-20% -15% -10% -5% 0% 5% 10% 15% 20% Jul 2 00 5 Jul 2 00 6 Jul 2 00 7 Jul 2 00 8 Jul 2 00 9 Jul 2 01 0 Jul 2 01 1 Jul 2 01 2 Jul 2 01 3 Jul 2 01 4 Jul 2 01 5 Jul 2 01 6 Jul 2 01 7 Jul 2 01 8 Jul 2 01 9 Jul 2 02 0 A nn ua l c ha ng e i n h ou se p ric es
England & Wales South West Bristol
Figure 2 – Annual Change in House Prices Source: ONS UK HPI
14
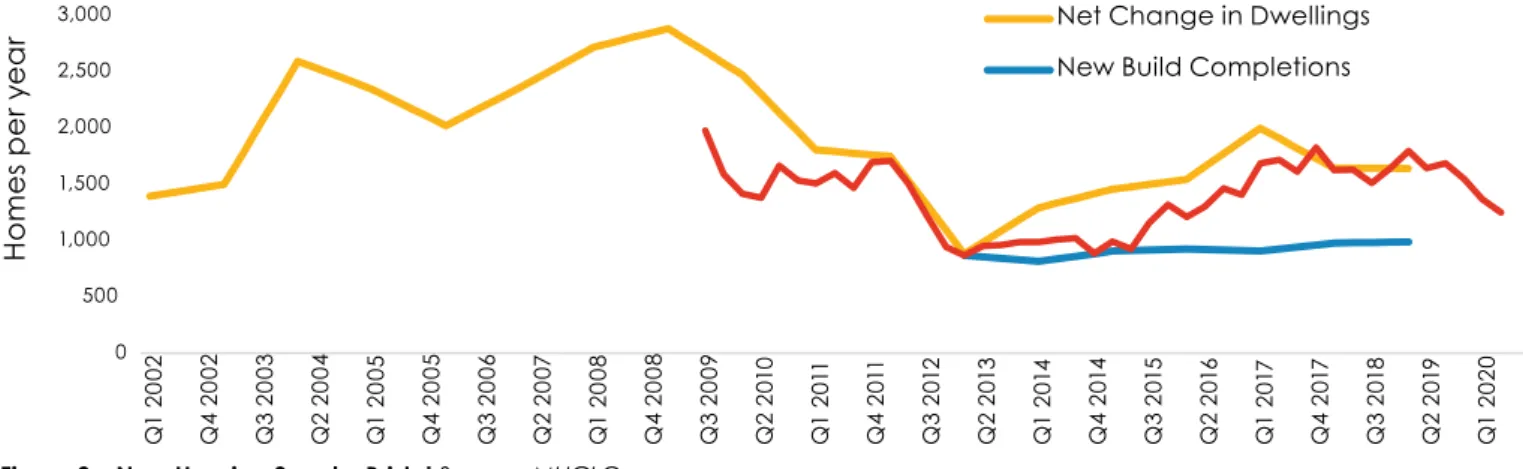
larger homes. Particularly those in more desirable locations. Those locations may not exactly match with popular areas prior to the pandemic given commuting is less of a constraint but there will be some continuation in terms of school catchments, local amenities, and other attractive features. While this trend does not cover every buyer, there does appear to be, for those that can afford it, a shift away from city centre living to less dense locations. The shift towards less dense living is a
challenge for a city like Bristol. Analysis of
Energy Performance Certificates, a useful
leading indicator for total new housing supply, shows that around 70% of Bristol’s new homes
have been flats in recent years. This reflects
the type of housing development in the city with most lower density development
occurring in surrounding districts. It also reflects
the large contribution to net housing supply
made by changes in use of exiting
non-residential properties. The Energy Performance
Certificate data also provides a guide to
the impact of the lockdown on the Bristol
new build market with 50% fewer certificates
lodged during the second quarter of 2020 when compared to the same quarter in 2019. While the need to build more homes remains high, the country faces unique challenges in coming months and years. Bristol is no different. Cities are under threat from changes in housing demand with inner London providing the starkest warning. An ongoing rental demand shock due to fewer workers, tourists, temporary residents, and students is leading to a collapse in rents. While other cities such as Bristol should not be as exposed to all these factors as the capital, it is a clear warning of the threats they face in these volatile and uncertain times.
0 500 1,000 1,500 2,000 2,500 3,000 Q1 2 00 2 Q 4 2 00 2 Q 3 20 03 Q 2 2 00 4 Q1 2 00 5 Q 4 2 00 5 Q 3 2 00 6 Q 2 2 007 Q1 2 00 8 Q 4 2 00 8 Q 3 2 00 9 Q 2 2 01 0 Q 1 2 011 Q 4 2 011 Q 3 2 012 Q 2 2 013 Q1 2 01 4 Q 4 2 014 Q 3 2 015 Q 2 2 016 Q 1 2 017 Q 4 2 017 Q 3 2 01 8 Q 2 2 019 Q 1 20 20 H om es p er y ea
r Net Change in Dwellings
New Build Completions
Risk management
Effective risk management is critical to the success of Goram Homes, so it is essential that we embrace a robust risk management and audit system across the business. Goram
Homes operates a risk register which identifies
key risks, giving each risk an inherent score without mitigating controls. Mitigations are then applied to this risk score giving the current risk score. To provide enhanced assurance these mitigations are covered in the assurance section of the risk register.
The management team review the risk register and the top risks are reviewed by the Goram Homes Board at our regular meetings. A process for materialisation of risks will be agreed with the Board so we can appropriately manage risks should they occur outside of the board cycle. For our assessment
of key Business Plan risks see Appendix B.
Figure 3 – New Housing Supply, Bristol Source: MHCLG
15
Introduction
Development Activity
Site identification process
Our primary source of sites is Bristol
City Council - a significant owner of
land – and Goram Homes is one of the Council’s key delivery vehicles
in the fight against the housing crisis,
especially for larger market facing
and mixed tenure projects. Therefore, it is critical that land flows from the
Council to Goram Homes at a scale and pace that is required to meet the operational cost commitments set out in our Business Plan.
The specific arrangements for the
transfer of land is set out on a site
by site basis and dependent on the condition and planning status of the land/property. Initially, any
new potential sites identified will be
assessed by the Goram Homes team. If the site is viable and deliverable it will be presented to the Board for early consideration (strategic
fit, social and financial returns, risks,
chances of success, etc) and to gain approval to actively pursue the site, within an agreed budget. The land purchase price is then agreed with the Council at a fair market value and unencumbered.
Procurement
Goram Homes has been established as a body with a commercial
character, not meeting needs in the general interest. We do not fall within
the definition of a body governed by
public law under the Public Contracts Regulation 2015 and do not have to adopt the procedures set out in the Public Procurement Regulations in respect of any transactions we undertake. This means Goram Homes can enter into contracts for goods, services and supplies with any contractor that it deems appropriate to do so, a considerable commercial advantage over the Councils’ procurement options. To maintain value for money within a less restricted procurement environment we have set out our general procurement principles in our procurement policy.
We will:
N Ensure that Goram Homes obtains
Value for Money whilst appointing contractors and consultants who can demonstrate the ability to deliver our demanding standards of quality and service
N Prevent corruption or
the suspicion of it
N Ensure fairness and equality
of treatment of all suppliers,
avoidance of bias, favouritism and that fairness can be demonstrated
through an audit trail; and
N Promote social value, including the
local economy and environmental sustainability, to the extent
that it is legally permitted
15
Development Activity
16
Design and Quality standards
Goram Homes wants to deliver placemaking that can provide a great place to live for those who buy and rent in the new housing on offer. As well as placemaking of the highest order we want to achieve schemes that are robust and look fantastic for many years to come. This will be achieved through a combination of good design and the use of low maintenance details and materials. The Board of Goram Homes has agreed that it will not set generic design and qualitystandards which apply to all of its projects. They recognise that each of its projects
will be unique and sit within differing local
communities and, therefore, a ‘one size fits
all’ approach would not be appropriate. We
will assess every project individually to ensure
the design is aligned to our values and ethos.
We will however be mindful of important
standards such as Nationally Described Space
Standards (NDSS). Goram Homes will always deliver tenure blind housing where both the affordable and market element provides new homes with a generous living space, suitable private amenity space and good quality design. Wheelchair units will, as a minimum,
comply with Part M of the Building Regulations
and all projects will achieve Secure by Design. We are open to considering modern
methods of construction (MMC) on our schemes. This will range from simple panelised systems through to volumetric pre-assembled structures. Any solution would be assessed on its suitability to the
proposed site. As a result, every project will
be individually appraised by the team prior to board approval, at mid-development point and at the end of the development using the quality criteria in our policies.
17
We have taken our programme and produced graphs to show how homes may be delivered,
both starts (fig 1) and completions (fig 2).
Figure 1
Development Programme
Goram Home’s development programme is our main activity. We have a strong working relationship with Bristol City Council’s Housing Delivery team and together we have
established a process to release land for sale to Goram Homes as quickly as possible. There is currently a positive land supply available and any constraints are being worked through.
The following table sets out the scale and trajectory of the development programme.
Scheme Potential Units No of AH Units % as AH JV start Year Handover years Deliverability - RAG
Complete 0 Contracted 267 Romney House 267 107 55% 20/21 21/22 25/26 Committed 165 Baltic Wharf 165 66 40% 20/21 22/23 25/26 Pipeline* 1,072 Project 1 60 24 40% 21/22 23/24 24/25 Project 2 160 48 30% 21/22 22/23 23/24 Project 3 170 51 30% 22/23 23/24 26/27 Project 4 110 44 40% 22/23 24/25 24/25 Project 5 65 26 40% 22/23 24/25 25/26 Project 6 125 38 30% 22/23 24/25 26/27 Project 7 192 77 40% 23/24 25/26 27/28 Project 8 360 108 30% 23/24 24/25 26/27 Total Programme 1,504 589 39.2%
*pipeline projects are all pre planning and liable to change. Timing and financial impact will be adjusted as schemes become firmer.
0 100 200 300 400 500 600 20/21 21/22 22/23 23/24 24/25
Homes into Contract (JV start)
0 100 200 300 400 500 600 20/21 21/22 22/23 23/24 24/25 25/26 26/27 27/28 28/29 29/30 30/31 Estimated Completions by Year
Figure 2
18
Financial Projections
Financial Projections
This Business Plan establishes acapacity to deliver, with projects
being approved on a case by case basis due to the number of variables and the embryonic
status of the pipeline. Our projects will be, in the main, joint ventures
with the value of the land forming a large proportion of the initial investment by Goram Homes. Once sites are agreed for
development by Goram Homes and Bristol City Council, we will acquire them from the Council at a fair market rate, using the most suitable funding mechanism for the site. In addition to funding for the land acquisition, the requirement for cash investment
in a joint venture will depend on the
nature of the development being built. We will look to minimise this where possible. Cash investment would only be needed if the land value does not equal at least half of the peak investment required.
For example, a flatted scheme will
require considerable initial investment before sales receipts are received, therefore increasing the likely requirement for cash investment. Should cash investment be required, this may be sourced from our JV partner, Goram Homes, Bristol City Council or third-party funders.
All borrowing will be site/project specific and subject to an individual
loan agreement. Revenue for each scheme takes the form
of sales receipts from private housing, affordable homes, and any commercial property. In
general, the profit margin hurdle
for developments is approximately
15% profit on Gross Development
Value for the scheme.
A top-level assessment of identified
and potential sites and their likely timing, outlined in our development programme feeds into the company’s
financial planning process to make projections as to the levels of planned
investments, expenditures and returns. Each element of the overall
financial projection is summarised in
the detail below. The business plan
then creates a financial envelope in
which Goram Homes can operate.
The operational and financial
performance of both Goram
Homes and the joint venture limited
liability partnerships is monitored and reviewed regularly as part of
a robust financial management
cycle in order to provide a periodic review. Actual performance on a site-by-site basis is checked against the granular elements of the
detailed financial appraisals which
are embodied into the Partnership Member Agreements. A change process is initiated in the event that
appraisals need to be adjusted as
costs and revenues crystallise, and all key variations, management actions and exceptions are reported upwards (including a periodic Board report).
19
Financial Projections
Building the Financial Plan
The forward Financial Plan of Goram Homes has been based on the programme activity outlined in our development programme. Each
project in this programme has either a latest
‘Financial Model’ (if an agreed partnership) or an estimated Development Cash Flow (if a pipeline site or pre-partnership formation). Our Financial Plan demonstrates the business plan
financial scope in which Goram Homes will
operate in the coming year. Appendix D shows
the flows of funding between the Council and
Goram Homes for the period of the plan.
All sites have been prepared as cash flows reflecting the anticipated Partnership
arrangements of a 50% share of both capital
(value in the lease being the majority of
the contribution made by Goram Homes)
and profits. Where significant additional
cash investment is required, this has been assumed to be through third party provision, with one proviso below linked to the ability
of the Partnership to have sufficient asset
backing to raise any remaining funds required from an external third party. A set of additional headline assumptions have been made that:
a)
The land cost is inclusive of ‘capital andinterest’, until negotiated specifically
b)
The lease sales value to the partnershipsis inclusive of ‘capital and interest’,
until negotiated specifically
c)
Goram Homes is able to recover VATon its purchases that incur VAT
d)
All cash generated from profits will beretained within Goram Homes pending decisions by the Council as to it’s use
Land purchase funding
The Land transaction, when conducted with the Council, is facilitated by the provision of a loan note to Goram Homes from Bristol City Council. After the land sale the Council no longer holds the land asset but holds a debtor asset being the loan note with Goram Homes. The chart below shows a forecast of the outstanding value of land purchase loan notes through the period of the Business Plan.
The peak land loan note balance owing to Bristol City Council is forecast to be £42m, should all of the developments proceed as programmed in this plan.
The total estimated value of land purchased by Goram Homes from Bristol City Council, and hence Loan Notes taken over the period of the Business Plan is forecast to total £85m. Over the same period, we are forecasting to repay £67m of the Loan Notes taken.
£’000 2020 2021 2022 2023 2024 2025 2026
Land Loan Notes
added in year - 18,172 9,325 32,562 18,280 6,944
-Land Loan Note
repayments in year - (2,820) (6,018) (11,077) (16,222) (17,377) (13,492) Net Land Loan
20
Financial Projections
Cash Investment in Partnerships
Our base assumption is that the sale of a lease into the partnership will represent our investment share, to be matched by our selected partner. However,
a)
should the land value be below theminimum required to represent our 50%
of the joint venture we have an option
to provide additional cash investment to support our 50% interest and
b)
if the land value, when matched by anequivalent investment from our partner,
is insufficient to fund the development
and also fails to exceed the minimum % of peak investment necessary to
raise external finance, we will need to
provide additional cash investment.
Where a cash investment is required it will be subject to Bristol City Council aproval.
21
Financial Projections
Profit & Loss
The trading performance of Goram Homes is assessed by considering our annual running
costs and our share of profit earned by the LLPs each year, interest receivable and payable on various loan note instruments and working capital financing from the Council.
We have forecast the profit earned by each development and recognised profit at point of sale of
the properties.
The majority of our trading activity is conducted within the joint venture limited liability partnerships
rather than by Goram Homes directly.
As shown below losses are incurred in the first three years with profits being generated from
2023 onwards.
Profit & Loss Account £’000 2020 2021 2022 2023 2024 2025 2026
LLP Participation Baltic Wharf - - (900) (1,064) 5,187 718 -Romney - (122) (137) 1,816 2,005 736 -Site 3 - - (7) 690 2,089 - -Site 4 - - - 1,425 178 - -Site 5 - - - - 4,314 1,498 -Site 6 - - - - 1,145 572 -Site 7 - - - 1,596 2,127 Site 8 - - - -Site 9 - - - - 806 1,200 188 Site 10 - - - - 206 1,169 1,169 Site 11 - - (14) 888 1,435 323 55 Share of LLP Profit /
(loss) before Tax - (122) (1,058) 3,755 17,365 7,812 3,539
Land Asset management
Purchase of land - (18,172) (9,325) (32,562) (18,280) (6,944)
-Sale of Build Leases - 18,172 9,325 32,565 18,280 6,944
-Sale of freehold - - -
-Operating Costs (£'000) (794) (906) (987) (994) (1,011) (1,029) (1,048)
Profit before Interest & Tax (EBIT) (794) (1,028) (2,045) 2,761 16,354 6,783 2,491 LLP Loan Account interest
receipts (signed LLPs) - - 441 207 - -
-BCC Land Loan interest
payments (signed LLPs) - - (441) (207) - -
-WCF Interest charges (26) (108) (192) (252) (180) (240) (300)
Profit before Tax (820) (1,136) (2,237) 2,509 16,174 6,543 2,191
Corporation Tax - - - - (2,753) (1,243) (416)
Profit After Tax (820) (1,136) (2,237) 2,509 13,421 5,300 1,775
22
Financial Projections
Operating Costs
Operating costs have been contained to approximately £1m p.a. for the Business
Plan. These project costs are incorporated
within the general overheads of operating
Goram Homes. The project specific central costs for each development project to
get to a point of partnership formation and the granting of planning permission are based on the following assumptions:
a)
At risk pre-LLP costs are carried as acontingent liability at the rate of circa
£300k per project, with a write off assuming
80% success rate, with 20% crystallising
b)
Legal & Professional costs of £50k perproject which are written off in Goram
Homes’ operating costs, with each party (partner) paying their own legal costs up to the point of LLP creation
Operating Costs 2020 2021 2022 2023 2024 2025 2026
People costs 453 471 550 561 572 584 596
Recruitment fees 64 10 15 5 5 5 5
Meals, Travel & Accommodation 3 10 10 10 11 11 11
IT Support 20 20 20 21 21 22 22 Office Expenses 15 17 27 28 28 29 29 Professional Services 155 168 172 175 179 182 185 PR & Advertising 2 40 20 20 21 21 22 Bristol Holding Ltd Management Fees 80 105 105 105 105 105 105 Contingency/Misc. 2 65 66 68 69 71 72 Operating costs (£’000) 794 906 987 994 1,011 1,029 1,048
23
Financial Projections
Cash Flow
The Business Plan shows a closing cash balance in 2026 of £25.1m.
Any distribution of profits will be decided by Bristol City Council.
Cash Flow (£'000) 2020 2021 2022 2023 2024 2025 2026
Opening Cash Balance
/(Overdraft) - 50 118 153 775 15,356 21,817
Inflow 844 1,000 1,841 2,020 18,048 10,429 5,840
Working Capital
funding received 799 1,000 1,400 1,000 1,000 1,000 1,000
Decrease in
non-cash current assets 45 - - -
-Interest received on Loan
Notes (signed LLPs) - - 441 207 - -
-LLP distribution - - - 813 17,048 9,429 4,840
Outflows (794) (932) (1,806) (1,398) (3,468) (3,968) (2,536) Operating costs of
Goram (EBIT) (794) (906) (987) (994) (1,011) (1,029) (1,048)
Interest paid on working
capital funding - (26) (108) (192) (252) (180) (240)
Interest paid on Loan
Notes (signed LLPs) - - (441) (207) - -
-Corporation Tax paid - - - - (2,753) (1,243)
Repay working capital funding - - - - (2,199) - -Increase in non-cash current assets - - (270) (5) (6) (6) (6) Dividend Distribution - - - -Operating flows 50 68 35 622 14,581 6,461 3,303 Lease Receipts - 2,820 6,018 11,077 16,222 17,377 13,492
BCC land loan repayments - (2,820) (6,018) (11,077) (16,222) (17,377) (13,492)
Closing Cash Balance
24
Financial Projections
Balance Sheet
The Balance sheet below shows Retained Reserves at the end of 2026 of £18.8m.
This Business Plan is subject to further refinement when a more detailed assessment of the development pipeline evolves and projects move forward.
Balance Sheet (£'000) 2020 2021 2022 2023 2024 2025 2026
Fixed Assets - - -
-Current Assets 189 15,348 17,902 42,956 59,917 54,333 42,850
Debtors 139 - - -
-Capitalised Pre LLP costs - - 270 275 281 287 292
LLP Leases - 15,352 18,659 40,144 42,202 31,769 18,277
Share of LLP
Retained Reserves - (122) (1,180) 1,762 2,078 461 (840)
Bank & Cash 50 118 153 775 15,356 21,817 25,121
Liabilities (1,009) (17,304) (22,095) (44,640) (48,180) (37,297) (24,038)
Corporation Tax - - - - (2,753) (1,243) (416)
Creditors & Accruals (184) (45) (45) (45) (45) (45) (45)
Working Capital
Funding Obligation (799) (1,799) (3,199) (4,199) (3,000) (4,000) (5,000)
Working Capital
Funding interest (26) (108) (192) (252) (180) (240) (300)
BCC Land Loan Notes - (15,352) (18,659) (40,144) (42,202) (31,769) (18,277)
Net Assets (820) (1,956) (4,193) (1,683) 11,737 17,037 18,812
25
Financial Projections
Stress Testing
The base financial plan has been modelled with cost and house price inflation
excluded. The following graphs show four stress tests applied to the base plan. We have run a number of sensitivities being:
G1)
Programme delays (1 and 2 years)G2)
Sales revenue reductions via house price deflation of 5%G3)
Construction cost increases at 5% p.a. increasesG4)
One-year delay and 10% revenue unit price decrease on live partnerships onlyWhen we stress test the financial plan in G1, G2, G3 we are assuming an event occurs, but all projects continue as currently profiled and no changes are made to project
assumptions. However, developments not under contract would transfer variations in cost and revenue into land value, sustaining Goram Homes 15% margin on GDV.
The exposure we would draw attention to in this financial plan is in relation to running costs of the organisation without profits from delayed partnerships
and to a reduction in values in live partnerships. This is shown in G4. As with all stress testing, interventions would be made before any of the scenarios were realised in full.
26
Financial Projections
G4)
Impact of one year delay and sales price reduction on LLPs signed by 2020/21 0 5000 (5,000) 10,000 15,000 20,000 25,000 30,000 Cash Balance £'000 2021 2022 2023 2024 2025 2026 (5,000) (10,000) 0 5000 10000 15000 25000 30000 20000 Cash Balance £'000 2021 2022 2023 2024 2025 2026G3)
Impact of increased construction costs on Cash Balance2021 2022 2023 2024 2025 2026 0% 118 153 775 15,356 21,817 25,121 5% 118 153 (344) 9,782 13,987 15,771 2021 2022 2023 2024 2025 2026 0% 118 153 755 15,356 21,817 25,121 5% 118 153 (1,038) (4,632) 8,543 11,539
G1)
Impact of Programme delays on Cash Balance 2021 2022 2023 2024 2025 2026 On time 118 153 775 15,356 21,817 25,121 1 year delay 118 153 (1,038) (4,632) 11,613 17,154 2 year delay 118 153 (1,038) (5,446) (5,667) 10,199 (5,000) (10,000) 0 5000 10000 15000 25000 30000 20000 Cash Balance £'000 2021 2022 2023 2024 2025 2026G2)
Impact of Sales Price reductions on Cash Balance 2021 2022 2023 2024 2025 2026 0% 118 153 775 15,356 21,817 25,121 5% 118 153 (461) 7,215 11,274 12,687 0 5000 (5,000) 10,000 15,000 20,000 25,000 30,000 Cash Balance £'000 2021 2022 2023 2024 2025 2026Appendix A
Strategic Business
Plan level KPI’s
Quarterly Cumulative
KPI
Code KPI Group Criteria Units
Previous
Year Target Actual PY %ACT/ Trgt %Act/ Previous Year Target Actual PY %ACT/ Trgt %Act/
People
1 People Turn over % <20 <20
2 People Days of Absence units 5 25
Projects
3 Projects BCC site release on time % 90 90 4 Projects Projects in contract on time % 90 90 5 Projects H&S – Number of RIDDOR incidents units 0 0
Finance
6 Finance Project Profits to Business plan % 90% 90%
7 Finance Goram Homes results to BP
variance % 10% 10%
Environmental
8 Environmental Carbon Reduced (Goram Homes) units 1000g 1000g
Social Value
9 Social Value Local contracts awarded % 75% 75%
Appendix B
Appendix B
Assessment of Key Risks
Risk
No. Risk Current Assessment Target Scores Comment
2 Failure to deliver growth / profit targets in line with
Business Plan assumptions
Prob. 3 Prob. 3 Market failures (e.g. house prices drop, construction costs increase, market sales rate drops, production rates reduce, delays in planning permission, interest rates rise,
insufficient land available.
Impact 4 Impact 4
Total 12 Total 12
4
Failure of board to give capable leadership, control, and strategic direction and/or inappropriate governance arrangements and structures
Prob. 3 Prob. 2
Lack of sufficient skills, knowledge
and experience on Board or SLT. Poor leadership or confused governance arrangements.
Impact 4 Impact 4
Total 12 Total 8
38 Loss of demand for property sales
Prob. 3 Prob. 2 Reduced access to (affordable)
mortgage finance.
Wider societal and cultural change to the way people want to live. Lack of suitable of properties developed for market demand.
Impact 4 Impact 4
Total 12 Total 8
40 Inability to establish sufficient development opportunities
Prob. 3 Prob. 2 Uncertainty around housing policy High level of competition for sites with / likely to secure full planning. Restrictions on opportunities to comply with development strategy e.g. mix of tenure.
Impact 5 Impact 5 Total 15 Total 10 43 Negative impact of spread of coronavirus (COVID-19) on delivery of Business Plan and viability
Prob. 2 Prob. 2
Uncontrollable spread of
COVID-19 virus without vaccine,
reducing staffing resource and
impacting the housing market.
Impact 5 Impact 5
Total 10 Total 10
21 Higher inflation (RPI/CPI) than anticipated
Prob. 2 Prob. 2 Brexit impact (a) increased
costs resulting in inflationary
impact (b) labour shortages Global events, e.g. oil shortages
Impact 4 Impact 4
Total 8 Total 8
Appendix C
Goram Innovation Action Plan
All the themes are connected to the ambition that our homes will be an enabler for improving the health and wellbeing of the residents of Bristol. Underpinning all of
the below is the recognition that its necessary to find new ways of doing community
consultation and engagement that is open, transparent and inclusive.
Connected Homes
According to the BRE, poor quality
housing costs the NHS £1.4bn per year due to building related hazards.
What we will do:
1.
Build a data framework to support theInternet of Things. Working with HACT
and/or other partners to develop and
contribute to the UK Housing Data Standards to ensure that the right data measures
and data collection is considered and captured – to support the health and independence of residents and ongoing maintenance and performance of homes.
2.
To ensure that fibre connectivity (buildingin fibre ducting as standard) is built in and
ready to enable the Internet of Things (not least supporting better independent living)
3.
To align projects with research andevaluation projects partnering with Bristol
University and UWE around improved health
and wellbeing and energy efficiency
(built around better understanding of user experience – data and connectivity).
Low Carbon Houses
In June 2019, the UK became the first major
economy in the world to pass laws to end its contribution to global warming by 2050.
The target will require the UK to bring all greenhouse gas emissions to net zero by 2050, compared with the previous target of at least 80% reduction from 1990 levels.
What we will do:
1.
Developing a JV partner selectionmethodology around low carbon/ zero
carbon housing (Bristol City Council
commitment to be carbon neutral city by 2030) so that all future projects
are future proofed and low carbon is not considered a ‘nice to have’ but a core delivery commitment.
2.
To explore lifetime costs (not just capex)as a validation for investment in homes
and to consider how BCC’s Social Value
Policy – whilst not directly relevant – can suggest a methodology to consider
and value wider scheme benefits.
Assisted Living
Disabled people were less likely to own their own home than non-disabled people, with 42.4% of disabled people owning their
own home compared with 53.2% of
non-disabled people. However, a substantial segment of homeowners and a customer group who’s needs are not ready met by standard homes built in the UK.
What we will do:
1.
Good design and well-proportioned homeswork well for both assisted living and family life. By way of example, wider doors for wheelchairs also serve young families with buggies. Goram Homes will consult
Bristol Disability Equality Forum on all its schemes to consider what proportion for accessible housing but also to explore how good design improves the accessibility of all housing and the community and
to engage with Better Lives at Home. This to complement the Connected Homes - digital to support independent living.
2.
To explore developing inter-generationalhomes on our schemes to address assisted living in the context of that wider community and address the loneliness epidemic.
www.gov.uk/government/news/ pm-launches-governments-first-loneliness-strategy
Modern Construction Methods
Based purely on existing workforce age and current levels of new entrant attraction,
we could see a 20-25% decline in the
available labour force within a decade.
What we will do:
1.
To support the regional/strategic opportunityto enable the WECA region, and the South West in general, to become the UK’s leading region in the technology and deployment of zero carbon, quality and affordable homes delivered at pace. The hypothesis to this as that MMC is part of the solution to create a new supply chain for affordable housing. Housing as part of a Local Industrial Strategy.
2.
To commit an identified site to develop its firstcat 1 (volumetric/3D) or cat 2 (penalised/2D) MMC housing partnership (part or full site).
3.
To explore a possible partnershipwith Bristol Housing Festival and YTKO as the third commercial partner for
‘Constructing Modern Methods’ – a digital optioneering tool that is being developed
as part of an Innovate UK project.
Innovative Financing
More than 8million people in England – around 1 in 7 – are living in an unaffordable, insecure, or unsuitable home. According to National Housing Federation research there are 3.6m people living in overcrowded homes, 2.5m people can’t afford their rent or mortgage and 2.5m adults are living with parents, with an ex-partner, or with friends because they can’t afford to move out.
What we will do:
1.
In partnership with others to explorenew tenure models that address the land cost issue as the key affordability challenge (to partner with organisations such as Future Cites Catapult who are developing those models but need to test them in the real world).
2.
To explore new funding opportunities tocreate more affordability and generate more capital investment where the asset is retained by a third party at low rates for 40 years and then reverts for social housing or other needs (see pension funding and other social impact funds/ green funds/pension funds who are looking for long term investment often aligned to MMC due to its manufacturing process and several funds now in
partnership with specific MMC suppliers).
30
Appendix C
Appendix D
Funding forecast between Goram Homes & the Council
Overall Fundingrelationship with BCC 2020 2021 2022 2023 2024 2025 2026
Cash Flows
Loan Note repayments
to BCC - 2,820 6,018 11,077 16,222 17,377 13,492
Working Capital Funding
(WCF) from BCC (799) (1,000) (1,400) (1,000) (1,000) (1,000) (1,000)
WCF repayment to BCC - - - - 2,199 -
Interest paid to BCC on Land
Loan Notes (signed LLPs) - - 441 207 - -
-Interest paid to BCC
on WCF Loan - 26 108 192 252 180 240
Net cash paid to /
(borrowed from) BCC (799) 1,846 5,167 10,476 17,673 16,557 12,732 Cumulative net cash
payments to BCC (799) 1,047 6,214 16,690 34,363 50,920 63,651 Net funding
Net Land Loan Note
balance (BCC) - (15,352) (18,659) (40,144) (42,202) (31,769) (18,277)
WCF balance (BCC) (799) (1,799) (3,199) (4,199) (3,000) (4,000) (5,000)
Retained cash 50 118 153 775 15,356 21,817 25,121
Total (749) (17,033) (21,705) (43,567) (29,845) (13,951) 1,844
32