Keywords:
Board of commissioners; Board of directors; Corporate
governance; Corporate life cycle; Corporate social responsibility
Corresponding Author: Permata Ayu Widyasari: Tel. +62 31 2981 297 E-mail: permataayu@staff.ubaya.ac.id Article history: Received: 2019-01-23 Revised: 2019-03-04 Accepted: 2019-06-10
This is an open access
article under the CC–BY-SA license JEL Classification: M12, M14, M41
Kata kunci:
Dewan komisaris; Dewan direksi; Tata kelola; Corporate life cycle; Corporate social responsibility
Corporate life cycle, corporate governance
structure, and corporate social responsibility
disclosure
Permata Ayu Widyasari, Christian Sutanto, Maria Eugenia Hastuti Department of Accounting, Faculty of Business and Economics, University of Surabaya Jl. Kalirungkut, Surabaya, 60294, Indonesia
Abstract
The existence of Law No. 40/2007 concerning Limited Liability Company (or UU PT) in Indonesia can be an external motivation of the companies to ensure the conduct of corporate social responsibility (CSR) activities. In addition, the internal factor of the company can both drive and inhibit the conduct of CSR activities, such as the corpo-rate life cycle. This study aims to determine the effect of the corpocorpo-rate life cycle, board of commissioners, and board of directors toward the disclosure of corporate social responsibility activities in manufacturing company listed in Indonesian Stock Exchange. The corporate life cycle is categorized into five stages, including introduc-tion, growth, maturity, decline, and shake-out. To accommodate the possibility of non-linear corporate life cycle stage, the study employed multiple linear regres-sions and ANOVA analysis. The results showed that corporate life cycle and board of commissioners have a significant effect on the disclosure of corporate social respon-sibility; while the board of directors has no effect on the disclosure of corporate social responsibility. The control variables used in this research include profitabil-ity, firm size, slack, research and development, market-to-book ratio, and firm age.
Abstrak
Keberadaan UU No.40/2007 tentang Perseroan Terbatas (atau UU PT) di Indonesia dapat menjadi motivasi eksternal perusahaan untuk memastikan pelaksanaan kegiatan tanggung jawab sosial perusahaan (CSR). Selain itu, faktor internal perusahaan dapat mendorong dan menghambat pelaksanaan kegiatan CSR, seperti siklus hidup perusahaan. Penelitian ini bertujuan untuk mengetahui pengaruh corporate life cycle, dewan komisaris dan dewan direksi terhadap pengungkapan aktivitas corporate social responsibility yang dilakukan oleh sektor manfaktur yang terdaftar pada Bursa Efek Indonesia (BEI). Corporate life cycle dibagi menjadi 5 tahap yaitu introduction, growth, mature, decline, dan shake-out. Penelitian ini menggunakan regresi linier berganda dan ANOVA untuk mengakomodasi sifat corpo-rate life cycle yang tidak linier. Hasil penelitian menunjukkan bahwa corpocorpo-rate life cycle dan dewan komisaris berpengaruh signifikan terhadap pengungkapan aktivitas corporate social responsibility sedangkan dewan direksi tidak berpengaruh terhadap pengungkapan aktivitas corporate social responsibility. Variabel kontrol yang digunakan dalam penelitian ini antara lain adalah profitabilitas, ukuran perusahaan, slack, research and development, market to book ratio, dan umur perusahaan.
How to Cite: Widyasari, P. A., Sutanto, C., & Hastuti, M. E. (2019). Corporate life cycle, corporate governance structure, and corporate social responsibility disclo-sure. Jurnal Keuangan dan Perbankan, 23(3), 385-402. https://doi.org/ 10.26905/jkdp.v23i3.2694
1.
Introduction
The president of Indonesia has issued Presi-dential Regulation No.59/2017 concerning the imple-mentation and achievement of Sustainable Devel-opment Goals (SDGs). The regulation reflects Indonesia’s commitment to supporting the achieve-ment of SDGs in 2030. In order to do so, this coun-try requires participation from various parties, in-cluding business entities. In the form of institutions or organizations, business entities can contribute to the achievement of SDGs through Corporate Social Responsibility (CSR) activities.
Based on the presidential regulation, one of the objectives of SDG in 2030 is to guarantee sus-tainable production and consumption patterns. One of the ways to achieve this goal is by encouraging companies to adopt sustainable practices and inte-grate sustainability of information in their report-ing cycles.
As concrete steps towards creating sustain-able development in 2030, Indonesia has established a 2015-2019 National Medium-Term Development Plan, targeting to increase the number of compa-nies which implement the environmental manage-ment system in order to achieve SDG, such as through SNI ISO 14001 certification. Such a step is enclosed in the appendix of the regulation.
Currently, a company does not merely de-pend on bottom-line profitability, but also triple bottom line profitability which includes financial, environmental, and social aspects (Restuti & Nathaniel, 2012). In recent years, the main objective of a business organization has shifted from its ini-tial focus on profit maximization to welfare improve-ment of the shareholders, as well as on protecting the interests of stakeholders, including environment and society (Rezaee et al., 2016).
A company’s (particularly a large one) atten-tion and orientaatten-tion to carry out its operaatten-tion does not merely focus on financial profits. Supriyono & Vita (2011) revealed that numerous corporations are now competing to offer the best business services
and improve their social responsibility to attract customer interests and improve their own long-term resources efficiency. Therefore, corporate social re-sponsibility becomes irreplaceable in running a cor-poration so that the company allocates the budget. CSR activities can benefit a company by at-tracting more consumers and investors. Corporate involvement in CSR activities can also attract socially conscious consumers and financial resources from socially responsible investors (Hillman & Keim, 2001).
The activities can also contribute positively to the company’s performance as a liaison by improv-ing company’s reputation and competitive advan-tage, while increasing customer satisfaction at the same time (Saeidi et al., 2015).
In Indonesia, the government has issued Law No. 40/2007 concerning Limited Liability Company (or UU PT). According to Article 1 No. 3 of the Law, social and environmental responsibility reflects the company’s commitment to participate in sustainable economic development in order to improve the qual-ity of life and environment, as well as to benefit various parties, including the company, local com-munity, and the general public. It is also stated that companies whose business activities centered on natural resources are required to carry out their social and environmental responsibilities. In addi-tion, there are some appropriate sanctions if the company fails to conduct CSR activities.
The existence of such regulations concerning CSR in Indonesia can motivate the external circum-stances of the companies to ensure the conduct of CSR activities which lead to sustainable develop-ment. In addition, the internal factor of the com-pany can both drive and inhibit the conduct of CSR activities.
Corporate Life Cycle (CLC) plays an impor-tant role to determine CSR investment within one company (McWilliam & Siegel, 2001). Resources and profitability of a company also can determine the company decided to engage in CSR activities.
Com-panies at different phases of CLC have their own resources which shape different CSR behaviors (Padgett & Galan, 2010).
A company at its early phase (introduction) undertakes CSR to differentiate the company from its competitors (Erhemjamts, Li, & Venkateswaran, 2013; Udayasankar, 2008). On the contrary, Withisuphakorn & Jiraporn (2016) showed that the company at its mature phase significantly invests in CSR activities. Hence, better financial performance will lead to more CSR activities, because companies at a mature phase are assumed to possess stronger financial resources. It can be said that there is a posi-tive relationship between companies in a mature phase and CSR activities.
This study does not necessarily measure the age of the company as a proxy for a company’s CLC. Instead, it categorizes CLC into 5 phases, namely introduction, growth, maturity, decline, and shake-out. These categories were divided based on cash flow which can capture a company’s profit, growth, and risk profile (Dickinson, 2011). This measurement is considered suitable, because it covers various ar-eas, including production habit, learning experi-ences, investment, market share, and patterns of a company’s entry and exit (Hasan & Habib, 2017; Faff et al., 2016; Hasan et al., 2015; Koh et al., 2015).
Recent studies show that CLC is related to company performance and decisions, such as cor-porate cash holding, net investment in plants, prop-erty, and equipment, debt and equity issues, acqui-sition and diversification decisions, corporate finan-cial disclosures, and tax planning (Arikan & Stulz, 2016; Faff et al., 2016). Based on that literature, it can be concluded that CLC can be a determining factor for a company to make any decision. CSR ac-tivities are also the results of a company’s account-ing and financial decisions. Therefore, this study proposes the hypothesis that CLC affects the company’s social responsibility.
CSR as a study topic in Indonesia is mostly associated with corporate governance, financial
per-formance, earning quality, earning management, and ownership. The authors employed CLC as the main variable because it is still rarely used in Indo-nesia to examine CSR. In addition, understanding the relationship between CSR and CLC is necessary, because it provides an early warning about a company’s timing to reduce its participation in CSR activities. Moreover, this study also aims to under-stand different levels of CSR involvement at each phase of CLC.
Social responsibility is oriented toward cor-porate stakeholders. It is in line with the main prin-ciples of good corporate governance, which includes responsibility. Good corporate governance will gen-erate a good image, as well as increase the level of investor confidence in the company. Lau, Lu, & Liang (2016) revealed that corporate governance needs to be considered in determining the disclo-sure of CSR because the reporting of CSR activities is influenced by motives, values, and choices. It in-cludes the compositions within the company board which involves an organizational decision-making process.
Sembiring (2005) and Wakidi & Siregar (2011) found that there was a positive influence between corporate governance and corporate social respon-sibility. However, research conducted by Badjuri (2011) found that there was no influence of corpo-rate governance on corpocorpo-rate social responsibilities. Most studies used the board of commission-ers as a proxy of corporate governance. However, Indonesia is a country that adopts a dual-tier sys-tem. Hence, this study uses the number of commis-sioners and directors as a proxy for corporate gov-ernance.
Understanding the internal characteristics of a company which can be either a supporting or in-hibiting factor toward the sustainability of a company’s CSR activities is highly essential. There-fore, this study employs corporate life cycle, the size of the board of commissioners, and the size of the board of directors, as well as variables like firm size,
profitability, slack, market-to-book ratio, research and development, and firm size age as control vari-ables to determine the reasons why publicly listed companies involved in CSR activities in Indonesia. This study uses annual report data of the compa-nies in the manufacturing sector, as listed in Indo-nesia Stock Exchange data between 2014 and 2016. This research focuses on the manufacturing indus-try in which the companies produce physical prod-ucts. This type of company mostly interacts with the general public and the community so that their product safety and security issues shall be consid-ered. In addition, for manufacturing companies, there will be some possibilities of incurring pollu-tion, waste, and environmental degradation dur-ing their production process (Mutia, Zuraida, & Andriani, 2011).
2.
Hypotheses Development
Corporate Life Cycle (CLC) is a determinant of organizational excellence (organizational competi-tiveness) so that it impacts a company’s manage-ment and business strategy (Habib & Hasan, 2019). The dynamic resource-based view suggests that re-sources-based and capabilities which form the basis of competitive advantages and losses arise during a certain time period and change over time. There-fore, the company’s resources and capabilities play important roles in explaining its growth, perfor-mance, and ability to spend its own cash in order to achieve its goals (Campbell, 2007). According to this view, the basis of a mature company’s resources and capabilities are very large, diverse, and rich.
Jovanovic (1982) revealed that for a company in its introduction phase of CLC has no consumer base and possesses a lower level of knowledge re-lated to potential revenue, costs, and industry dy-namics. While companies in their growth phase ex-perience some increases in product sale and subject to active market competition. Hay & Ginter (1979), as cited in Hasan & Habib (2017), revealed that com-panies in the growth phase tend to invest more in
product modification and improvement, rather than differentiating their products. Moreover, at the shake-out and decline phases, companies have lim-ited resources. At these phases, companies are more focused on survival strategies in their respective industries. It might be caused by their weak finan-cial performance so that there is a higher possibility to endanger their own shareholders if they invest in CSR activities (Campbell, 2007). Therefore, lim-ited ability and limlim-ited resources shall limit compa-nies within those late phases to use their funds for CSR activities and it indirectly reduces their involve-ment in CSR activities.
However, given the reputation and strategic value of CSR activities, there are some arguments suggesting that companies at their earliest phases tend to invest in CSR activities. During their first phases, companies need larger support from stake-holders because of their needs for external resources. Involvement in CSR activities can be beneficial in collecting support from company stakeholders. Even though the costs of running a CSR activity can be too costly, the benefits derived from it can be greater to the companies at their initial stages, com-pared to companies at the other stages. Udayasankar (2008) revealed that companies with less public vis-ibility can use CSR as a tool to obtain external re-sources because they need it more than companies at the mature stage.
Nonetheless, some existing studies show that the availability of resources dominates a company’s CSR investment decision (Campbell, 2007). Invest-ing in CSR tends to be costly and some of them are often irreversible. On the other hand, companies in mature phase have a steadier customer base and can focus more on product differentiation strategies (Hay & Ginter, 1979). As a response toward a threat from competitors, companies at the mature phase can exploit advanced strategies to create a unique reputation so that it cannot be easily copied (McWilliam & Siegel, 2001) and one way to achieve this is to invest in CSR activities (Fombrun & Shanley, 1990). Brammer & Millington (2008) stated
that companies in a mature phase, due to their abun-dant resources base and economies of scale, have the capacity to invest substantially to CSR in order to differentiate their companies from others, to in-crease their capital, to enhance company’s reputa-tion, and to produce long-term benefits. Specializa-tion in CSR activities by rearranging and reallocat-ing resources can be achieved by companies with a larger scale of operations. Such specialization en-ables companies in mature phase to actively partici-pate in CSR activities. Based on this perspective, this research proposes a hypothesis that:
H1: corporate life cycle affects the company’s in-volvement in CSR activities
Corporate governance indicates the relation-ship between corporate management, boards, share-holders, and stakeholders. It also signifies a struc-ture explaining company objective and how to achieve them, as well as supervising company per-formance. It is formulated to ensure the balance between rights and duties in order to create stable value in a long-term for the shareholders (IFC, 2018). Based on the Regulation of Financial Service Authority No.21/POJK.04/2015 concerning the guidelines for publicly listed companies, the com-panies are required to implement the regulation to encourage the application of governance practices in accordance with some exemplary international practices.
Circular Letter of Financial Services Author-ity No.32/SEOJK.4/2015 concerning the guidelines for publicly listed companies lists five aspects of corporate governance. These aspects encompass the relationship between company and shareholders in guaranteeing shareholders rights, the role, and func-tion of the board of commissioners, the role and functions of the board of directors, the participa-tion of stakeholders, and informaparticipa-tion disclosure.
In making a decision, companies have a moral responsibility which includes sensitivity in the de-cision-making process. As companies are inanimate
objects and have no conscience, the boards act as its spirit. They reflect the company characters in carry-ing out operational activities. The implications of company decisions which have some social impacts are usually packaged in a CSR mechanism (Lukviarman, 2016).
Using a sample of Spanish companies, Fuente, García-Sanchez, & Lozano (2017) analyzed that one of the board’s characteristics which can influence a company’s decision is its size. Indonesia adheres to a dual-tier system, so this study interprets the size of the Boards using two proxies, namely the size of the board of commissioners and the board of direc-tors. Both boards have different tasks, yet both have their respective interests in the implementation of company activities and their reports, including the company’s social responsibility. Frias-Aceituno, Rodriguez-Ariza, & Garcia-Sanchez (2012) found that board size has a positive relationship with integrated CSR, investment, and transparency activities.
Regulation of the Financial Services Author-ity No. 33/POJK.04/2014 concerning Directors and Board of Commissioners of the Publicly Listed Com-panies and Indonesia Corporate Governance Manual issued by IFC (2018) defined the meaning of board of commissioners. It is defined as an organ within a company whose task is to provide some guidance and advice on how to implement company strate-gies to the directors, as well as to oversee company performance.
While the Regulation of Financial Service Au-thority No.33/POJK.04/2014 concerning Directors and Board of Commissioners of the Publicly Listed Companies described that the board of directors refers to an organ within a company which is au-thorized and fully responsible for the overall man-agement of the company, day-to-day manman-agement, and represent the company, both within and out-side the court in accordance with the provisions of the articles of association. Based on Indonesia Cor-porate Governance Manual issued by IFC (2018), the board of directors is responsible for the day-to-day
operation of the company, including implementing strategy, managing human resources, devising mar-keting and sales plans, and managing assets.
The board of commissioners is one of the most important elements in implementing corporate gov-ernance mechanism. The board’s main task is to su-pervise a company’s operational activities which are conducted by the board of directors, in accordance with the Law No.3/2017. Moreover, the board can provide some advice to the directors about com-pany performance. Akhtaruddin et al. (2009) re-vealed that the bigger the board size is, the more their collective experience and competence should be; so that the management can reveal a wider range of information. Zahra & Pearce (1989) further stated that in order to conduct good management and monitoring strategy, they recommended a larger size of the board of commissioner. It is considered as a beneficial strategy for the company in order to implement and conduct CSR activities. Said, Zainuddin, & Haron (2009) disclosed that a larger board of commissioner should have been more ca-pable of directing the management to improve their CSR activities. In Indonesia, based on a study by Sembiring (2005) and Wakidi & Siregar (2011), it is concluded that the size of the board of commissioner influences CSR activities positively. Therefore, this study formulates the following hypothesis:
H2: the size of the board of commissioner posi-tively affects CSR activities
The board of directors is responsible for run-ning the company and meet the interests of the
stakeholders. It certainly should have some strate-gies to develop its operations. Kiel and Nicholson (2003) posited that the larger size of the board of commissioner should have more experience, exper-tise, awareness, and information which shall be ben-eficial when the company faces any problems in developing its operational strategy. Fomburn & Shanley (1990) stated that operation strategy can differentiate between a company and its competi-tors to create unique reputation which cannot eas-ily be imitated by other companies, including in terms of CSR activities. Ali & Atan (2013) stated that the larger the size of the board of directors, the larger the company capability to carry out CSR activities; so that they can enhance the company image and uphold the interests of the stakeholders. Therefore, this study formulates the following hypothesis: H3: the size of the board of director positively
in-fluences CSR activities
3.
Method, Data, and Analysis
The research object encompassed all business entities operating in the manufacturing sector and listed on the Indonesia Stock Exchange (IDX) be-tween 2014 and 2016. Those business entities re-ported their CSR activities in the annual report.
The total number of business entities in the manufacturing sector which were listed in IDX be-tween 2014 and 2016 was 435 entities. In order to filter the sample from the total population, some selections were made in accordance with some cri-teria. Table 1 lists the criteria used to filter the sample.
Criteria Total
Business entities in manufacturing sector listed in IDX between 2014 and 2016 435
Sampling criteria
Business entities which did not provide a complete financial statement in IDX (105) Business entities which did not disclose any CSR activities in their annual reports (18)
Total Research Sample 312
Dependent variable
The dependent variable in this research was corporate social responsibility (CSR). This study adopted items from Hackston & Milne (1996) and Sembiring (2005) who categorized CSR disclosure into several categories, namely environment, en-ergy, employees’ health and safety, employees, products, community involvement, and general items. In total, there were 78 items of CSR disclo-sure with these categories: environment (13 items), energy (7 items), employees’ health and safety, employees (8 items), employee (29 items), product (10 items), community involvement (9 items), and general (2 items).
In order to calculate CSR, basically those CSR disclosure items in the research instrument were treated as dummy variables: their given values were 1 if the activities were disclosed, and 0 if they were not disclosed. Furthermore, based on the calcula-tion results from the companies’ annual reports, a CSRD Index (CSRDI) was also calculated using the following formula (Haniffa & Cooke, 2005):
flow is more than 0 (> 0); (2) Growth. If the opera-tional cash flow was more than 0 (> 0); investment cash flow was less than 0 (< 0); financial cash flow is more than 0 (> 0); (3) Mature. If the operational cash flow was more than 0 (> 0); investment cash flow was less than 0 (< 0); financial cash flow was less than 0 (< 0); (4) Decline. If the operational cash flow was less than 0 (< 0); investment cash flow was more than 0 (> 0); financial cash flow could be either less/ more than and equal to 0 (< or >0); (5) Shake-out. The remaining age of the company was classified in the shake-out phase.
Board of commissaries
Board of commissaries is one of the indepen-dent variables in this study. In order to measure its size, we used the number of board members in a company (Said, Zainudin, & Haron, 2009). It was assumed that the larger the board size was, the more their collective experiences and competences would be; hence, the disclosed information by the com-pany management shall be wider in range. More-over, the large size of the board of commissaries depicted an effective corporate governance mecha-nism so that the company was expected to be more concerned about its surroundings. This variable was denoted as DK, signifying the number of board members within a company.
Board of directors
Board of directors is one of the independent variables in this study. The size of the board could be measured by the number of directors in a com-pany. It reflected the corporate governance mecha-nism because decision-making would also consider the suggestions from the directors in the company. The larger the size of the board of directors, the larger the ability of the company to conduct CSR activities (Ali & Atan, 2013). This variable is denoted as DD, signifying the number of directors in the company.
=∑ (1)
Where: CSRDIj = Corporate Social Responsibility Disclosure Index for j company; nj = items number for j company; Xij = dummy vari-able. The value was 1 if item i was disclosed and 0 if item i was not disclosed.
Independent variables
Corporate life cycle (CLC)
This study employed a corporate life cycle from Dickinson (2011) as the proxy to examine the dynamics of CLC. Using the identification of CLC from Dickinson (2011), CLC was categorized based on their cash flow pattern: (1) Introduction. If the operational cash flow was less than 0 (< 0); invest-ment cash flow was less than 0 (< 0); financial cash
Control variables
Firm size (SIZE)
Control variable for firm size in this study was measured by the natural log of the total asset for each company. The measurement was employed because the total assets from the sample company were varied. The larger of a company’s total assets, it was expected to positively related to corporate social responsibility (Hasan & Habib, 2017). This variable was formulated as:
Firm Size (SIZE) = Ln (total assets) (2)
Profitability (PM)
Control variable to profitability in this study was measured through operating income and di-vided with a total asset. The larger ratio of profit-ability, it was expected to positively relate to cor-porate social responsibility (Hasan & Habib, 2017). This variable was formulated as:
Profitability (PM) = (operating income)/(total asset) (3)
Slack (SLACK)
This variable control (SLACK) was measured by adding up cash and short-term investment, then divided them with the total asset. Slack signified the availability of resources or lack thereof. The larger size of slack, the more capability a company was expected to have to conduct corporate social responsibility activities (Hasan & Habib, 2017). This variable was formulated as:
Slack (SLACK) = (cash+short term investment)/
(total asset) (4)
Market-to-Book Ratio (MTB)
Control variable for the market-to-book ra-tio in this study was measured by the market value
of equity divided by the book value of equity. Mar-ket-to-book ratio was one of the financial ratios to measure the projected company growth in the fu-ture. Company growth referred to company capabil-ity to invest in the future. It was expected that a larger market-to-book ratio has a positive relationship with corporate social responsibility (Hasan dan Habib, 2017). This variable was formulated as follows: Market to book ratio (MTB) =
(market value of equity)/(book value of equity) (5)
Research and development (Rnd)
Control variable for research and develop-ment in this study was measured by research and development expenses and divided by the total as-set. If one company did no spend any expenses for research and development, then it would be denoted as 0. It was expected that research and development could have an important implication on corporate social responsibility activity (Hasan & Habib, 2017). This variable was formulated as follows:
Research and development (Rnd) =
(research and development expense)/(total asset) (6)
Firm age (AGE)
Control variable of firm age in this research was measured by the natural log of 1 + company age since it was first listed in Indonesia Stock Ex-change (IDX). The company age since it was listed in IDX signified that the research year was sub-tracted with the first year of the company listing in IDX. The longer the company has been listed, it was expected to be capable of responding more strate-gically toward the opportunity and limitation of corporate social responsibility (Hasan & Habib, 2017). This variable was formulated as follows:
Firm Age (AGE) = Ln (1+ age since it was first listed in
Data analysis
Prior to conducting the regression test, the data must pass some classical assumption tests, namely the normality test, heteroscedasticity test, autocorrelation test, and multicollinearity test. Fur-thermore, this study also added Analysis of Vari-ance (ANOVA) test. It further classified CLC into 5 phases, namely introduction, growth, mature, de-cline, and shake-out. However, CLC was not a lin-ear phase. A company’s life cycle could both progress and regress along the phase (Dickinson, 2011). Therefore, we needed an additional test tool in ANOVA. ANOVA could examine the relation-ship between categorical independent variables and dependent variable (Ghazali, 2016). To test the as-sumption in ANOVA, we employed Levene test (Test of Homogeneity Variance).
Empirical equation model
This study employed multiple linear regres-sion with two models. The first model was mea-sured without control variables and the second model was measured using control variables. In addition, the authors added the ANOVA test to analyze the data for Hypothesis 1. The test was con-ducted to test the robustness of regression results. The equation of multiple linear regression in this study was formulated as follows:
CSRDI =0 + 1 LCS + 2 DK + 3 DD + 4 SIZE + 5
PM + 6 SLACK + 7 MTB + 8 Rnd + 9
AGE + e (8)
Where: CSRDI = corporate social responsibility in-dex; SIZE = firm size; PM = profitability; SLACK= slack; MTB = market-to-book ra-tio; R&D = research and development; AGE = firm age
4.
Results
The author needs to report the results in suf-ficient detail so that the reader can see which statis-tical analysis was conducted and why, and later to justify their conclusions.
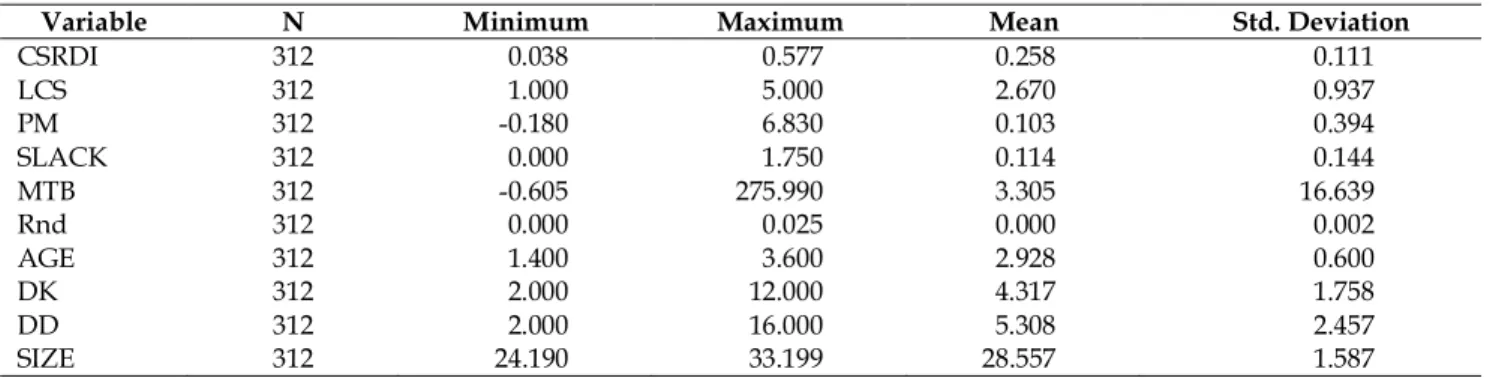
The data analysis of descriptive statistics from corporate social responsibility disclosure index (CSRDI), corporate life cycle CLC), firm size (SIZE), profitability (PM), slack (SLACK), market-to-book ratio (MTB), research and development (Rnd), firm age (AGE), the size of the board of commissaries (DK), the size of the board of directors (DD) are displayed in Table 2.
Based on the analysis results of the descrip-tive statistics above, we can see that the highest CSRDI value was 0.577. This value was recorded by PT. Astra International Tbk (ASII); while the low-est value of CSRDI was recorded by Malido Feedmill
Variable N Minimum Maximum Mean Std. Deviation
CSRDI 312 0.038 0.577 0.258 0.111 LCS 312 1.000 5.000 2.670 0.937 PM 312 -0.180 6.830 0.103 0.394 SLACK 312 0.000 1.750 0.114 0.144 MTB 312 -0.605 275.990 3.305 16.639 Rnd 312 0.000 0.025 0.000 0.002 AGE 312 1.400 3.600 2.928 0.600 DK 312 2.000 12.000 4.317 1.758 DD 312 2.000 16.000 5.308 2.457 SIZE 312 24.190 33.199 28.557 1.587
Tbk (MAIN) at 0.038. As a variable, CSRDI in manu-facture industry recorded mean values at 0.2586. This average percentage of CSRDI indicates that the awareness of business entities in the manufacturing sector in Indonesia to do CSR activities is still argu-ably low.
For corporate life cycle (CLC), the minimum value was 1, indicating that there were business entities still in their introduction phase. While the highest value was 5, indicating that there were also business entities in their shake-out phase. Introduc-tion phase had 29 business entities as the samples;
growth had 96 samples; mature had 160 samples; decline had 4 samples, and shake-out had 23 busi-ness entities as the samples.
The size of the board of commissioners (DK), as proxied by the number of board members in the company, recorded the highest value at 12, indicat-ing that the largest board of commissioners have 12 members. This value was recorded by PT. Astra International Tbk (ASII). While the lowest value was 2 and recorded by several companies, namely PT. Chitose Internasional Tbk (CINT), PT. Ekadharma Internasional Tbk (EKAD), PT. Lotte Chemical
Ti-Variable Model 1 B(t-statistics) Model 2 B(t-statistics) (Constant) .149 -.502 (8.651)*** (-4.242)*** Dintro -.047 -.051 (-2.378)** (-3.748)*** Dgrowth .017 -.026 (-1.365) (-2.166)** Ddecline -.097 -.071 (-1.958)* (-1.544)* Dshakeout -.050 -.029 (-2.26)** (-1.422)* DK .022 .015 (5.666)*** (3.778)*** DD .005 -.020 (1.913)* (-0.693) PM .013 (0.0995) SLACK .058 (1.571)* MTB .000 (1.47)* Rnd .991 (0.448) AGE -.033 (-3.748)*** SIZE .028 (6.452)*** Adj R2 .229 .347 F 16.372*** 14.786*** N 312 312 * Significant at 10% ** Significant at 5% *** Significant at 1%
tan Tbk (FPNI), PT. Kertas Basuki Rachmat Indone-sia Tbk (KBRI), PT. Langgeng Makmur Industri Tbk (LMPI), and PT. Tirta Mahakam Resources Tbk (TIRT). The average value of the board of commis-sioners in the manufacturing sector was 4. It indi-cates that the research objects have obeyed POJK No.33 /pojk.04/2014 concerning the directors and commissaries of the publicly listed company which stated that the board of commissioners should have at least 2 members.
The size of the board of directors (DD), as proxied by the number of board members, recorded its highest value at 16, indicating that the board has 16 members. This value was recorded by PT. Mandom Indonesia Tbk (TCID). While the lowest value was 2 and recorded by several companies. The average value of board members size in the manu-facturing sector was 5. It indicates that the research objects have obeyed POJK No.33 /pojk.04/2014 con-cerning the directors and commissaries of the pub-licly listed company which stated that the board of directors should have at least 2 members.
Classic assumption test
Normality test results showed that the value of asymp.sig. (2-tailed) was larger than 0.05, which was at 0.051 and indicated that the data were nor-mally distributed. Heteroscedasticity test results with Glejser Test also showed that the data were free from heteroscedasticity because the significant values of all independent variables were greater than 0.05. Moreover, the multicollinearity test also dem-onstrated that the data were free from multi-collinearity because the VIF value was less than 10 and the tolerance value was more than 0.1. In addi-tion, the autocorrelation test with Durbin-Watson (DW) also resulted in no autocorrelation (D = 1.944). Based on the results of multiple linear regres-sion tests, this formula was obtained:
CSRDI = -0.502 – 0.051 Dintro – 0.026 Dgrowth – 0.071 Ddecline – 0.029 Dshakeout + 0.015 DK – 0.020 DD + 0.013 PM + 0.058 SLACK + 0.000 MTB + 0.991 Rnd – 0.033 AGE +
0.028 SIZE (9)
The discussion of multiple linear regression results below refers to Table 3. M odel 1 refers to regression model w ithout control variables and M odel 2 signifies a regression model w ith control variables. H ypothesis 1 test results can be seen from the significance level of Dintro, Dgrow th, Ddecline, dan Dshake-out. This regression model employed corporate life cycle as dummy variable (n-1) so that there w ere a total of 4 dummy variables of
corpo-rate life cycle. We can also conclude that compared
to mature phase, the other phases of CLC recorded lower levels of CSR activities. Dintro, Ddecline, and Dshake-out particularly recorded lower CSR activi-ties than mature phase with significance level be-low 5%. It can be concluded that CLC at the mature phase has a significant influence on CSR activities; hence, H1 is supported. In order to ensure robust-ness, ANOVA test was also conducted to support non-linear CLC.
For Hypothesis 2, we can examine the signifi-cance of DK coefficient (the size of the board of com-missaries). In Model 1 and Model 2, we can see that DK recorded significant and positive coefficient; hence, H2 is supported. It exhibits that the size of the board commissaries significantly and positively influences CSR activities.
Finally, the result of H2 testing can be exam-ined from the significance level of DD coefficient (the size of the board of directors). Based on the results of t-test for multiple linear regression, the size of the board of directors did not significantly influence CSR activities.
Additional analysis - ANOVA (corporate life
cycle)
This subsection explains the results of the ANOVA test which was conducted for further analysis for Hypothesis 1. In order to conduct ANOVA test, there were some initial tests to be fulfilled, namely the Levene test. We have previ-ously explained the Levene Test above and we also aimed to obtain similar variance as the results. Table 4 describes the results of between-subject effects test. Corporate life cycle (CLC) variable was sig-nificant at 0.05; hence, it is concluded that it has a positive influence on CSR activities. The adjusted R-square was recorded at 0.064, indicating that CSRDI variable can be explained by corporate life cycle variable at 6.4%.
Meanwhile, Analysis of Variance (ANOVA) is a method to test the relationship between 1 de-pendent variable with 1 or more indede-pendent vari-ables. It is employed to determine the main effects and the interaction effect of the categorical inde-pendent variable on the metrics of the deinde-pendent variable. The main effect itself refers to the direct effect of the independent variable on the dependent variable; while the interaction effect signifies the joint influence of two or more independent variables on the dependent variables (Ghozali, 2016).
In this study, ANOVA was employed to ex-amine the relationship between CSR activities with corporate life cycle which was divided into 5 phases (1=introduction; 2=growth; 3=mature; 4=decline; 5=shake-out). The ANOVA test results are displayed in Table 5.
Source Type III Sum of Squares df Mean Square F Sig.
Corrected Model .245a 4 .061 5.246 .000 Intercept 3.556 1 3.556 304.274 .000 LCS .245 4 .061 5.246 .000 Error 3.588 307 .012 Total 24.702 312 Corrected Total 3.833 311
R Squared =.064 (Adjusted R Squared =.052) Dependent variable: CSRDI
(I) LCS Mean Difference
(I-J) Std. Error Sig.
95% Confidence Interval Lower Bound Upper Bound 1.0 2.0 -.03622 .022906 .510 -.09908 .02663 4.0 .06233 .057658 .816 -.09588 .22055 5.0 .01217 .030183 .994 -.07066 .09499 2.0 4.0 .09856 .055165 .383 -.05282 .24993 5.0 .04839 .025096 .305 -.02047 .11726 3.0 1.0 .06435* .021817 .028 .00448 .12422 2.0 .02812 .013956 .261 -.01017 .06642 4.0 .12668 .054722 .143 -.02348 .27684 5.0 .07652* .024106 .014 .01037 .14266 4.0 5.0 -.05017 .058562 .912 -.21087 .11053
Based on observed means.
The error term is Mean Square (Error) =.012. *. The mean difference is significant at the.05 level.
Table 4. Test results of between-subject effects
Table 5 displays the result of ANOVA test. It illustrates that there was a relationship between the categorical independent variable in this research (corporate life cycle) with the dependent variable (CSR activities). Based on the table above, we can see that companies at the mature phase (3) are more involved in CSR activities compared to companies in the other phases. It can be seen from mean dif-ferences which were higher for mature phase. Mean difference between introduction (1) and mature (3) phases was 0.06435 or 6.4%, indicating that the sig-nificance of the mature phase is larger than the in-troduction at the significance level of 0.028. More-over, the mean difference between growth (2) and mature (3) was 0.02812 or 2.8 percent, indicating that the significance of mature phase is larger than growth phase. The mean difference between decline
(4) and mature (3) were 0.12668 or 12.67 percent, indicating that the significance of mature phase is larger than the decline phase. Finally, the mean dif-ference between shake-out (5) and mature (3) was 0.07652 or 7.65 percent, indicating that the mature phase has larger significance than shake-out phase at the significance level of 0.014.
The results from the table above showed that companies at the mature phase are more involved in CSR activities than the other phases. Related to the significant influence of CLC phases on CSR ac-tivities, we can see from the table of ANOVA test results that companies at mature phase significantly conduct more CSR activities compared to the intro-duction and shake-out phases with significance level below 0.05. This result is in line with Hypothesis 1 which stated that CLC significantly influences CSR
Employee (t) Environment (t) Products (t) Health (t) (Constant) 0.097 (1.403) -0.670 (-2.539) -1.502 (-5.113)** -.502 (-4.242)** PM 0.003 (0.269) .024 (0.762) -0.015 (0.466) 0.013 (0.995) SLACK 0.037 (1.265) -.001 (-0.007) 0.189 (2.046)* 0.058 (1.571) MTB 0.000 (0.591) .001 (1.259) 0.000 (-0.519) 0.000 (1.470) Rnd 2.888 (1.663) -3.935 (-0.740) 8.970 (1.632) 0.991 (0.448) AGE -0.033 (-4.796)** -.067 (-3.205) -0.025 (-1.139) -.033 (-3.748)** Dintro -0.035* (-2.393) -.079 (-1.784) -0.096 (-2.087)* -0.051 (-2.758)** Dgrowth -0.007 (-0.752) -.013 (-0.464) -0.057 (-1.940) -0.026 (-2.166)* Ddecline -0.015 (-0.420) -.162 (-1.476) -0.155 (1.364) -0.071 (-1.544) Dshakeout -0.019 (-1.204) -.005 (-0.097) -0.058 (-1.151) -0.029 (-1.422) DK 0.015 (4.733)** .022 (2.266) 0.015 (1.525) .015 (3.778)** DD 0.001 (0.590) -.004 (-0.673) -0.002 (-0.235) -0.002 (-0.693) SIZE2 0.004 (1.186) .043 (4.059) 0.064 (5.901)** 0.028 (6.452)**
activities, particularly for the companies in the ma-ture stages which conduct more CSR activities than companies in the other 4 phases.
Additional analysis - board of directors
This study conducted an additional test for the relationship between the board of directors and CSR Sub-Indexes (environment, health, employee, and products). The result showed that there is no influence between the board of directors and CSR disclosure. The overall results are displayed in the Table 6.
5.
Discussion
The results of this study were supported by a previous study of Hasan & Habib (2017) which stated that a company’s life cycle in its mature phase has a positive relationship with its involvement in CSR. CLC variable in this study was also recorded as robust. The authors then conducted further analy-sis using ANOVA and obtained similar results that companies in mature phase have more involvement in CSR activities compared to companies in other phases (introduction, growth, decline, and shake-out). Such companies usually have positive operat-ing cash flow, negative investoperat-ing cash flow, and negative financing cash flow. Brammer & Millington (2008) stated that mature companies are more in-volved in CSR activities because they have abun-dant resource base and economies of scale. They also have a large capacity to invest some company substances to CSR activities in an effort to differen-tiate their companies from other companies, increase their own capitals, enhance company reputation, and generate long-term profits. McWilliam & Siegel (2001) also mentioned that companies in the mature phase can employ some strategies to create a unique reputation so they cannot be easily copied. Hay & Ginter (1979), as cited in Hasan & Habib (2017), mentioned that such companies also have certain customer base and can focus on product differen-tiation strategies to create their unique reputation.
The results of Hypothesis 2 test showed that the size of the board of commissioners had a sig-nificant, positive effect on CSR activities. The sults of this study are consistent with previous re-search conducted by Sembiring (2005) and Said, Zainuddin, & Haron (2009). The board of commis-sioner also recorded robust results with two mod-els. The greater the composition of the board, the more capable they will be to direct management in increasing company CSR disclosure. The larger the size of the board, the greater their collective expe-rience and competences will be; so that the infor-mation they convey shall be wider (Akhtaruddin et al., 2009). Zahra & Pearce (1989) suggested that for the implementation of good governance and moni-toring strategy, the larger size of the board can be a beneficial strategy for companies to implement and realize CSR activities.
Based on the results of Hypothesis 3 testing, there is no significant relationship between the num-ber of directors and CSR disclosure in a company. It might be because the directors are more focused on internal tasks and daily operations, namely implementing strategies, managing human re-sources, devising marketing and sales plans, and managing assets. They are less focused on external tasks like CSR decisions. Meanwhile, the test results for the board of commissioners showed a signifi-cant result on their influence of CSR disclosure. It indicates that the board of the commissioner still performs their role in advising directors in CSR ac-tivities well.
Furthermore, the market-to-book ratio has a significant, positive relationship on CSR activities. It is in line with research conducted by Hasan & Habib (2017). The ratio itself refers to one of the financial ratios employed to measure the projected growth of the company in the future, which indi-rectly affects the company size, as well. As the com-pany size grows bigger than before, it will get more attention from the public for its activities involving its surroundings.
Slack also has a significant and positive rela-tionship with CSR activities. It is in line with re-search conducted by Hasan & Habib (2017). It indi-cates that resource availability can influence the com-pany in the decision to carry out CSR activities. The more available resources they have, the more in-volved they are in CSR activities.
Meanwhile, firm size has a positive and sig-nificant effect on CSR activities. It is in line with research conducted by Hasan & Habib (2017) which also found similar results. Wang, Song, & Yao (2013) further stated that large companies tend to get more attention from the general public. It makes a large company gets more pressure from the public to show their social responsibilities.
Finally, firm age has a negative, yet the sig-nificant relationship with CSR activities. It is not in line with previous research conducted by Hasan & Habib (2017). It is allegedly because of the existing legislative regulation in Indonesia, namely Company Performance Appraisal Program (PROPER) and In-donesia Sustainability Award (SRA). The programs are formulated by the Indonesian government in collaboration with the community and have been responded by previously listed and newly listed companies. Company of all ages responds to the programs by increasing their social and environmen-tal activities, which were then revealed through sev-eral communication media, including company an-nual report.
6.
Conclusion, Limitations, and Suggestions
Conclusion
This study examined that corporate life cycle (CLC) variable positively influenced corporate so-cial responsibility (CSR) activities. It was concluded that a company in its mature phase is more involved in CSR activities, compared to a company in the other phases of the cycle (introduction, growth, decline, and shake-out). It was because, at its ma-ture phase, a company has more abundant resource base and economies of scale, compared to the other
phases. Moreover, the board of the commissionaire variable also positively influence CSR activities. It indicates that the larger the size of the board, the easier it is for them to monitor the board of direc-tors whose task is to conduct CSR activities. This variable also recorded a robust result, as indicated by similar results in two models. While board of director variable was found to have no influence on CSR activities. It might be because the board tends to be more focused on its day-to-day operational tasks.
Limitation and suggestions
Due to some limitations of this study, we of-fer some suggestions for future research. This study employed the CSR Index adopted from Hackston & Milne (1996) and Sembiring (2005); hence, the fu-ture study shall follow new development in CSR disclosure by following a more contemporary CSR Index. Besides, the item scale in this study can be improved by using another scoring system besides 0 and 1 for each item. Future studies can employ the scales from Prado-Lorenzo, Gallego-Alvarez, & Garcia-Sanchez (2009) who categorized scoring into 1 to 3 scale based on quantitative, qualitative, and monetary information.
Second, future researchers can employ a more accurate method of measuring CSR by minimizing subjectivisms and judgment. It can be done by in-volving an independent party to conduct the scor-ing, instead of doing it personally.
Third, future studies can use other measure-ment scales besides the size of the board of com-missioners and board of directors to examine the direct influence of corporate governance on CSR. The other measurement scale can include the num-ber of commissioners having accountancy education, and/or the number of boards’ meetings discussing CSR activities.
Fourth, future studies can use a more suitable sample by distinguishing between the high profile and low-profile industry, based on Hackston & Milne’s (1996) classification.
References
Akhtaruddin, M., Hossain, M. A., Hossain, M., & Yao, L. (2009). Corporate governance and voluntary disclosure in corporate annual reports of Malaysian listed firms. Journal of Applied Management Accounting Research, 7(1), 1.
Ali, M. A. M., & Atan, R. (2013). The relationship between corporate governance and corporate social responsibility disclosure: a case of high Malaysian sustainability companies and global sustainability companies. Southeast Asia
Journal of Contemporary Business. Economics and law, 3(1), 39-48.
Arikan, A. M., & Stulz, R. M. (2016). Corporate acquisitions, diversification, and the firm’s life cycle. The Journal of
Finance, 71(1), 139-194. https://doi.org/10.1111/jofi.12362
Badjuri, A. (2011). Faktor-faktor fundamental, mekanisme corporate governance, pengungkapan corporate social responsibility (CSR) perusahaan manufaktur dan sumber daya alam di Indonesia. Dinamika Keuangan &
Perbankan, 3(1).
Brammer, S., & Millington, A. (2008). Does it pay to be different? An analysis of the relationship between corporate social and financial performance. Strategic Management Journal, 29(12), 1325-1343. https://doi.org/10.1002/smj.714
Campbell, J. L. (2007). Why would corporations behave in socially responsible ways? An institutional theory of corporate social responsibility. Academy of Management Review, 32(3), 947-967. https://doi.org/10.5465/ amr.2007.25275684
Dickinson, V. (2011). Cash flow patterns as a proxy for firm life cycle. The Accounting Review, 86(6), 1969-1994. https:/ /doi.org/10.2308/accr-10130
Erhemjamts, O., Li, Q., & Venkateswaran, A. (2013). Corporate social responsibility and its impact on firms’ investment policy, organizational structure, and performance. Journal of Business Ethics, 118(2), 395-412. https://doi.org/ 10.1007/s10551-012-1594-x
Faff, R., Kwok, W. C., Podolski, E. J., & Wong, G. (2016). Do corporate policies follow a life-cycle? Journal of Banking
& Finance, 69, 95-107. https://doi.org/10.1016/j.jbankfin.2016.04.009
Fombrun, C., & Shanley, M. (1990). What’s in a name? Reputation building and corporate strategy. Academy of
Management Journal, 33(2), 233-258. https://doi.org/10.5465/256324
Frias-Aceituno, J. V., Rodriguez-Ariza, L., & Garcia-Sanchez, I. M. (2012). The role of the board in the dissemination of integrated corporate social reporting. Corporate Social Responsibility and Environmental Management, 20(4), 219-233. https://doi.org/10.1002/csr.1294
Fuente, J. A., García-Sanchez, I. M., & Lozano, M. B. (2017). The role of the board of directors in the adoption of GRI guidelines for the disclosure of CSR information. Journal of Cleaner Production, 141, 737-750. https://doi.org/ 10.1016/j.jclepro.2016.09.155
Ghozali, I. (2016). Aplikasi Analisis Multivariete Dengan Program IBM SPSS 23. Semarang: Undip Press.
Habib, A., & Hasan, M. M. (2019). Corporate life cycle research in accounting, finance, and corporate governance: A survey, and directions for future research. International Review of Financial Analysis, 61, 188-201. https:// doi.org/10.1016/j.irfa.2018.12.004
Hackston, D., & Milne, M. J. (1996). Some determinants of social and environmental disclosures in New Zealand companies. Accounting, Auditing & Accountability Journal, 9(1), 77-108. https://doi.org/10.1108/ 09513579610109987
Haniffa, R. M., & Cooke, T. E. (2005). The impact of culture and governance on corporate social reporting. Journal
Hasan, M. M., & Habib, A. (2017). Corporate life cycle, organizational financial resources, and corporate social responsibility. Journal of Contemporary Accounting & Economics, 13(1), 20-36. https://doi.org/10.1016/ j.jcae.2017.01.002
Hasan, M. M., Hossain, M., Cheung, A., & Habib, A. (2015). Corporate life cycle and cost of equity capital. Journal of
Contemporary Accounting & Economics, 11(1), 46-60. https://doi.org/10.1016/j.jcae.2014.12.002
Hay, R., & Ginter, P. (1979). Strategies for maintaining a share of the market. Paper presented at the annual meeting of
the Southern Academy of Management, Atlanta.
Hillman, A. J., & Keim, G. D. (2001). Shareholder value, stakeholder management, and social issues: what’s the bottom line? Strategic Management Journal, 22(2), 125-139. https://doi.org/10.1002/1097-0266(200101)22:2<125::AID-SMJ150>3.0.CO;2-H
IFC. (2018). Indonesia Corporate Governance Manual. 2nd Ed. Washington D.C.
Jovanovic, B. (1982). Selection and the evolution of industry. Econometrica, 50(3), 649–670. https://doi.org/10.2307/ 1912606
Kiel, G. C., & Nicholson, G. J. (2003). Board composition and corporate performance: how the Australian experience informs contrasting theories of corporate governance. Corporate Governance: An International Review, 11(3), 189-205. https://doi.org/10.1111/1467-8683.00318
Koh, S., Durand, R. B., Dai, L., & Chang, M. (2015). Financial distress: Lifecycle and corporate restructuring. Journal
of Corporate Finance, 33, 19-33. https://doi.org/10.1016/j.jcorpfin.2015.04.004
Lau, C., Lu, Y., & Liang, Q. (2016). Corporate social responsibility in China: A corporate governance approach.
Journal of Business Ethics, 136(1), 73-87.
Lukviarman, N. (2016). Corporate Governance: Menuju Penguatan Konseptual dan Implementasi di Indonesia. Solo: PT Era Adicitra Intermedia.
McWilliam, A., & Siegel, D. (2001). Corporate social responsibility: A theory of the firm perspective. Academy of
Management Review, 26(1), 117-127. https://doi.org/10.5465/amr.2001.4011987
Mutia, E., Zuraida, & Andriani, D. (2011). Pengaruh ukuran perusahaan, profitabilitas dan ukuran dewan komisaris terhadap pengungkapan corporate social responsibility pada perusahaan manufaktur yang terdaftar di Bursa Efek Indonesia. Jurnal Telaah & Riset Akuntansi, 4(2), 187-201.
Padgett, R. C., & Galan, J. I. (2010). The effect of R&D intensity on corporate social responsibility. Journal of Business
Ethics, 93(3), 407-418.
Prado-Lorenzo, J.-M., Gallego-Alvarez, I., & Garcia-Sanchez, I. M. (2009). Stakeholder engagement and corporate social responsibility reporting: The ownership structure effect. Corporate Social Responsibility and
Environmen-tal Management, 16(2), 94-107. https://doi.org/10.1002/csr.189
Peraturan Otoritas Jasa Keuangan Nomor 21 /pojk.04/2015 tentang Penerapan Pedoman Tata Kelola Perusahaan
Terbuka.
Peraturan Otoritas Jasa Keuangan Nomor 33 /pojk.04/2014 tentang Direksi dan Dewan Komisaris Emiten atau Perusahaan
Public.
Peraturan Presiden Republik Indonesia Nomor 59 tahun 2017 tentang Pelaksanaan Pencapaian Tujuan Pembangunan
Berkelanjutan.
Restuti, M. M. D., & Nathaniel, C. (2012). Pengaruh pengungkapan corporate social responsibility terhadap earning response coefficient. Jurnal Dinamika Manajemen, 3(1), 40-48.
Rezaee, Z., Zhang, H., Dou, H., & Gao, M. (2016). Does corporate governance matter? Evidence from New Chinese corporate governance disclosures. International Journal of Accounting Research, 5(1). https://doi.org/10.4172/ 2472-114x.1000140
Saeidi, S. P., Soûan, S., Saeidi, P., Saeidi, S. P., & Saaeidi, S. A. (2015). How does corporate social responsibility contribute to ûrm ûnancial performance? The mediating role of competitive advantage, reputation, and customer satis-faction. Journal of Business Research, 68(2), 341-350. https://doi.org/10.1016/j.jbusres.2014.06.024
Said, R., Hj Zainuddin, Y., & Haron, H. (2009). The relationship between corporate social responsibility disclosure and corporate governance characteristics in Malaysian public listed companies. Social Responsibility Journal, 5(2), 212-226. https://doi.org/10.1108/17471110910964496
Sembiring, E. R. (2005). Karakteristik perusahaan dan pengungkapan tanggung jawab sosial: studi empiris pada perusahaan yang tercatat di Bursa Efek Jakarta. Paper presented at the Simposium Nasional Akuntansi. Solo. Supriyono & Vita. (2011). Hubungan antara persepsi dan sikap terhadap pelaksanaan corporate social responsibility.
Jurnal Dinamika Manajemen, 2(2), 139-152.
Udayasankar, K. (2008). Corporate social responsibility and firm Size. Journal of Business Ethics, 83(2), 167-175. Wakidi, R. H., & Siregar, H. S. (2011). Pengaruh sisi internal dan eksternal perusahaan terhadap pengungkapan
tanggung jawab sosial pada perusahaan manufaktur yang terdaftar di BEI. Jurnal Ekonomi, 14(4).
Wang, J., Song, L., & Yao, S. (2013). The determinants of corporate social responsibility disclosure: Evidence from China. Journal of Applied Business Research (JABR), 29(6), 1833-1848. https://doi.org/10.19030/jabr.v29i6.8220
Withisuphakorn, P., & Jiraporn, P. (2016). The effect of firm maturity on corporate social responsibility (CSR): do older firms invest more in CSR? Applied Economics Letters, 23(4), 298-301. https://doi.org/10.1080/ 13504851.2015.1071464
Zahra, S. A., & Pearce, J. A. (1989). Boards of directors and corporate financial performance: A review and integrative model. Journal of Management, 15(2), 291-334. https://doi.org/10.1177/014920638901500208