C E N T E R O N J A P A N E S E E C O N O M Y A N D B U S I N E S S
Working Paper Series
August 2012, No. 304Nice To Be On The A-List
Yasushi Hamao, Kenji Kutsuna and Joe Peek
This paper is available online at www.gsb.columbia.edu/cjeb/research
Nice to be on the A-List
Yasushi Hamao, University of Southern California Kenji Kutsuna, Kobe University
Joe Peek, Federal Reserve Bank of Boston This Version: June 12, 2012
We thank Hidenori Takahashi and Kazuo Yamada for outstanding research assistance, and Shinichi Hirota, Douglas Joines, Hideaki Miyajima, Aris Protopapadakis, Douglas Skinner, Hirofumi Uchida, and seminar participants at University of Southern California and Waseda University for helpful comments. This research project received financial support from the Ministry of Education, Culture, Sports, Science and Technology, Japan (Grant No.19330069), and Kobe University. The views presented here do not necessarily represent the views of the Federal Reserve Bank of Boston or the Federal Reserve System.
1
Nice to be on the A-List
Abstract:
This study addresses an important shortcoming of most of the existing literature on credit availability by including a set of unlisted firms (which are the firms most likely to be bank dependent) in the analysis, and by investigating differences between the treatment of listed and unlisted firms by their lenders. We find evidence consistent with evergreening behavior by banks toward listed firms, consistent with prior studies. However, the more striking result is that banks appear to treat the smaller, unlisted firms differently, being much less willing to engage in evergreening behavior for these borrowers. The difference in treatment of unlisted firms relative to listed firms does not appear to be related to systematic differences in size between the two groups of firms. Thus, it appears that the distinguishing characteristic that determines whether a bank might evergreen loans to a firm is whether or not the firm is listed. Furthermore, this effect appears to be stronger for those firms listed on the more prestigious Tokyo Stock Exchange compared to firms listed on other exchanges; that is, being on the list (being listed) matters, and being on the A-list matters even more. Moreover, among listed firms, for which data on ownership by banks are available, a higher concentration of ownership of the firm by either the main bank or the firm’s top three lenders increases the likelihood of the firm obtaining increased loans, suggesting that bank ownership of the firm stimulates evergreening behavior to a greater degree.
JEL classification: E44, E51, G21, G28
2 1. Introduction
It is well established that Japanese banks provided support to listed firms during the extended period of economic malaise in Japan following the bursting of the stock market and real estate bubbles (for example, Peek and Rosengren 2005; Caballero, Hoshi, and Kashap 2008). In particular, the weaker was a bank’s health, the more likely it was to increase lending to the weakest Japanese firms, in large part due to the perverse incentives banks faced to avoid having to recognize an even greater quantity of problem loans. While keeping these zombie firms alive through evergreening loans, as well as through debt forgiveness and debt-for-equity swaps, may have avoided the mutually assured destruction of the banks and their borrowers, such behavior likely contributed to lengthening the period of economic malaise in Japan, commonly referred to as the “Lost Decade.” Bank regulators were complicit in allowing such bank behavior, permitting banks to overstate their capital and understate their problem loans, in part to avoid the high costs that would be associated with widespread bank failures and a massive increase in unemployment if many large firms were pushed into bankruptcy.
While the existing literature does provide strong evidence of evergreening behavior by banks, this evidence has been produced primarily for listed firms, omitting precisely the set of smaller, unlisted firms most likely to be “bank dependent,” and thus most affected by credit availability during a banking crisis. This study investigates the extent to which banks treated unlisted firms differently than listed firms in terms of their willingness to make credit available, and whether the loans supplied were based on the fundamentals of healthy firms or on evergreening loans to unhealthy firms. A number of possible explanations exist for differential treatment of listed and unlisted firms. For example, banks may have been more willing to provide credit to unhealthy listed firms due to government pressure to support large troubled
3
firms to avoid a massive increase in unemployment, pressure from the government and the Tokyo Stock Exchange to avoid the embarrassment of large numbers of listed firm failures,
same-keiretsu affiliations between the main bank and the firm, or simply that the banks had a
larger exposure to the large firms so that the failure of a large firm would have adversely impacted the reported problem loans and capital of the banks by more than the failure of a number of small firms. Thus, pressure or incentives to treat listed firms differently than smaller firms may have been based on external factors or on factors internal to the banks.
In fact, given the persistent weak economic performance experienced in Japan following the bursting of the stock market and real estate bubbles, the relatively few bankruptcies of listed Japanese firms is quite striking (Hoshi and Kashyap 2001; Hamao, Mei, and Xu 2004). However, such a pattern would be consistent with banks supporting the largest firms. In sharp contrast, large numbers of bankruptcies of small and mid-sized Japanese firms (SMEs) occurred throughout the period of economic malaise, even in the face of exhortations by the government for banks to increase lending to SMEs. For example, based on data reported by the Small and Medium Enterprise Agency (2003) and the Ministry of Internal Affairs and Communications (2010), the bankruptcy rate for firms with paid-in capital of less than 100 million yen was 1.77 percent in 1996, compared to only 0.09 percent for listed firms. Although bankruptcy rates were higher in 2001, the relative comparison is similar: 2.33 percent for firms with paid-in capital of less than 100 million yen compared to only 0.32 percent for listed firms.
Thus, an important question concerns why the bankruptcy experience of SMEs contrasted so sharply with that of listed firms during this period. To what extent can the disparity be attributed to differences in the fundamentals of the two groups of firms, and to what extent can it be attributed to a difference in the treatment of the firms by their lenders? Was the evergreening
4
of loans limited to the largest firms to which the banks had the largest exposure? And, if so, were lending decisions for SMEs based on their fundamentals, or were SMEs subjected to a credit crunch as banks used their limited lending capacity to meet the loan demand from listed firms?
The extended period of economic malaise, in combination with the banking crisis, that followed the bursting of the stock market and real estate bubbles in Japan at the beginning of the 1990s is particularly relevant for a study of bank credit availability that attempts to distinguish between the experiences and treatment of unlisted firms compared to listed firms. Moreover, the general conclusions from previous studies that the evergreening of loans to unhealthy Japanese listed firms was widespread and that some relatively healthy Japanese firms may have faced a credit crunch suggest that including the smaller unlisted, and primarily bank-dependent, firms is essential for obtaining a better understanding of how, and to whom, bank credit was provided during this troubled period.
We find evidence consistent with evergreening behavior by banks toward listed firms, consistent with prior studies. However, the more striking result is that banks appear to treat the smaller, unlisted firms differently, being much less willing to engage in evergreening behavior toward these borrowers. And, it is not simply a matter of firm size: these results remain even after controlling for differences in firm size. Thus, it appears that being a listed firm matters. Yet even among listed firms, banks appear to show even more favoritism toward firms listed on the premier stock exchange, the Tokyo Stock Exchange, than to those listed on other exchanges; that is, being on the list matters, and being on the A-list matters even more. Moreover, among listed firms, for which data on ownership by banks are available, a higher concentration of ownership of the firm by either the main bank or the firm’s top three lenders increases the likelihood of the firm obtaining increased loans.
5
The paper is organized as follows. In the next section, we provide some background and summarize previous studies. Section 3 describes the data and sample characteristics, and Section 4 discusses the empirical specification. Sections 5 and 6 present empirical results, and Section 7 concludes.
2. Background
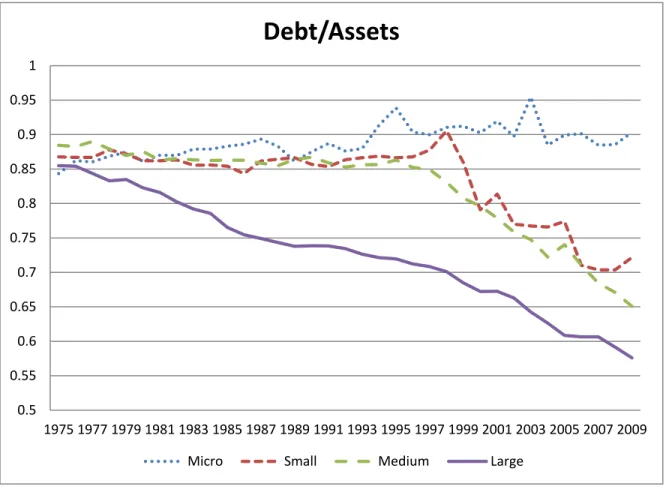
Most firms rely on credit in order to finance their operations. As Figure 1 shows, Japanese firms fit this pattern, although the degree of reliance on debt has varied across size classes of firms and over time. While all four size classes of firms (Micro, Small, Medium, and Large) had debt-to-asset ratios in the range of 85 to 90 percent in the mid-1970s, large firms have
steadily delevered since that time.1
While many larger firms have direct access to credit markets, most firms are too small, or too opaque, to directly access credit markets (e.g., bond and commercial paper markets). Such firms tend to rely more heavily on intermediated credit, with most of that credit being provided by banks. Because these firms rely on banks for their borrowing, they are often deemed to be On the other hand, medium-sized firms began to delever only in the mid-1990s, although at a faster rate than was the case for large firms. After a brief surge in the late 1990s, small firms similarly began to delever, following a path close to that of medium-sized firms. In contrast, not only did micro firms resist this pattern of declining leverage, they actually increased the level of their debt-to-asset ratio in the mid-1990s and have essentially maintained that higher leverage ratio.
1
The data are from the Policy Research Institute of the Ministry of Finance. The four size classes are defined by the size of the paid-in capital of the firm. Micro firms are defined as firms with less than 10 million yen of paid-in capital; small firms are defined as firms with 10-100 million yen of paid-in capital; medium firms are defined as firms with 100 million-1 billion yen of paid-in capital; large firms are defined as firms with more than 1 billion yen of paid-in capital.
6
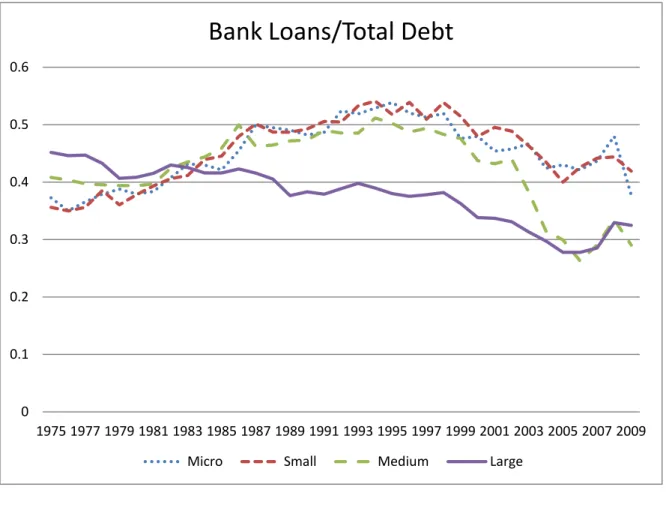
“bank dependent.” Moreover, the relative reliance on bank loans should be particularly important in a country such as Japan that is typically considered to have a bank-centered, rather than market-centered, economy.
Figure 2 shows the ratios of borrowings from financial institutions (bank loans) to total debt for the same four size classes of Japanese firms. As would be expected, smaller firms tend to rely more heavily on bank loans than do large firms. Interestingly, the bank loans-to-debt ratio for large firms is actually higher than for other firms until the early 1980s when the Japanese bond market began to be deregulated. Strikingly, the large firm relative reliance on bank loans declines even as these firms steadily delever (as shown in Figure 1) until the recent rebound in this ratio. While these large firms were reducing their reliance on bank loans, the other three size classes of firms were increasing their relative reliance on bank loans into the mid-1990s, after which the relative importance of bank loans in total debt declined. However, the decline in the bank loans-to-debt ratio for medium-sized firms was much sharper, with the ratio eventually falling to the level of that for large firms and then mirroring the rebound in the ratio for large firms in the last half of the 2000s. Although the bank loans-to-debt ratio for small and micro firms did not decline to the same degree as that for medium firms, the ratios similarly exhibit a temporary rebound at the end of the sample period.
Because bank credit is such an important source of credit for most firms in Japan, it is important to understand under what criteria, and to whom, bank credit is provided. Figures 1 and 2 show that the relative importance of bank loans, both across firm size classes and over time, has changed substantially, suggesting that meaningful changes in either the demand for bank loans or the willingness of banks to make credit available to different classes of firms has
7
occurred. Our primary focus will be on the relative willingness of banks to provide credit to listed firms compared to unlisted firms, controlling for loan demand.
Most firm-level studies that investigate the provision of bank credit rely on databases that include only listed firms, omitting precisely those firms most likely to be bank dependent. This occurs because balance sheet and income data for listed firms are widely available, while the availability of those data for unlisted firms is quite limited. While we can improve our understanding of the allocation of credit through studies of listed firms, we do not know that the supply of credit to, or the demand for credit by, smaller, unlisted firms follows the same patterns as those for the larger, listed firms that are more transparent and have better access to nonbank sources of credit through national or international markets. Moreover, any differences may be magnified in times of financial stress, when credit markets may not function as well as in more normal times, the willingness to take on risk exposure may be reduced, bank and/or firm health deteriorates, and market signals become less clear as opacity increases.
For listed Japanese firms, substantial evidence exists that Japanese banks continued to lend to unhealthy firms during the crisis period. For example, Peek and Rosengren (2005), Caballero et al. (2008), Ahearne and Shinada (2005), and Sekine, Kobayashi, and Saita (2003) each find that bank credit was allocated to relatively unhealthy firms, suggesting that the banking system misallocated credit, and that this misallocation likely extended the length of the period of economic malaise experienced by the Japanese economy. Peek and Rosengren (2005) emphasize the perverse incentives faced by troubled banks to continue allocating credit to many of their weakest borrowers in order to avoid “mutually assured destruction.” Because troubled banks needed to continue the fiction that they were adequately capitalized, they wanted to avoid reporting further increases in nonperforming loans that would require them to charge off existing
8
loans and add to their loan loss reserves, actions that would reduce their reported capital ratios. In order to do so, they tried to prevent or delay their troubled borrowers from being declared bankrupt, which would force the banks to recognize their loans to those firms as problem loans.
One mechanism for doing so is “evergreening” loans, whereby a bank makes additional loans to a troubled firm that can be used to repay interest on the firm’s existing loans. By providing the funds to the firm needed for interest payments, the already outstanding loans would not go into default, and thus the lender would not be forced to recognize them as nonperforming loans. Of course, bank regulators would have to be complicit in perpetuating the fiction that such loans were current and that the banks did not need to charge off at least part of the loans and add to their loan loss reserves. In fact, using aggregate data, Hosono and Sakuragawa (2003) argue that the discretionary enforcement of minimum capital requirements by bank supervisors was a key determinant of forbearance lending by Japanese banks.
Using detailed data on loans from individual banks to individual listed firms, Peek and Rosengren (2005) show that troubled banks with reported capital ratios close to the required minimum value were more likely to increase loans to their weakest borrowers. Moreover, they find that this misallocation of credit was enhanced by corporate affiliations; that is, if a bank was
in the same keiretsu as the firm, it was more likely to increase loans to a weak firm. On the other
hand, the misallocation of credit was less prevalent for nonbank lenders compared to banks. Focusing on the debt-to-asset ratio, Sekine et al. (2003) find similar evidence of forbearance lending to nonmanufacturing firms, especially in particularly troubled industries such as real estate and construction, adversely impacting bank profitability. While the extensive misallocation of credit may have prevented widespread bankruptcies of listed firms, it also likely impaired the creative destruction that would have contributed to the restructuring of troubled
9
firms and the reallocation of resources to more productive uses necessary for the Japanese economy to have a sustained recovery.
In fact, Caballero et al. (2008) focus on how this forbearance lending to otherwise insolvent borrowers interfered with the restructuring of troubled firms necessary for the recovery of the Japanese economy. Moreover, not only did this forbearance lending allow “zombie” firms to continue to operate, but their continued operations had an adverse effect on healthier firms by distorting competition. The reduced profitability of firms forced to compete with these zombie firms discouraged the non-zombie firms from investing, as well as deterring entry of new competitors, further weakening any potential recovery of the Japanese economy. In fact, Ahearne and Shinada (2005) find similar evidence that industries with a concentration of zombie firms tended to have lower productivity growth rates, in part because forbearance lending aided weak firms at the expense of the more productive firms in those industries, restraining the ability of the more productive firms to gain market share at the expense of the least productive firms.
A small number of studies have provided similar evidence of the inefficient allocation of credit for smaller, unlisted firms during the crisis period. For example, Nishimura, Nakajima, and Kiyota (2005) find that relatively inefficient firms, based on total factor productivity, tended to survive during the crisis, while relatively efficient firms were exiting. This pattern was particularly apparent for recent entrants. Such evidence strongly suggests that Japanese banks were not allocating credit efficiently during the crisis. Uesugi (2008) finds a similar pattern among manufacturing firms for voluntary exits not necessarily related to financial problems, insofar as relatively efficient firms voluntarily exited while relatively inefficient firms continued to operate. However, Uesugi (2008) finds that bank lending to SMEs, unlike that to large firms, appears to operate efficiently rather than being based on forbearance lending, perhaps because
10
loans to distressed small firms are too small to be renegotiated. Of course, to the extent that the loans to distressed SMEs have been guaranteed by the government, banks have no incentive to pursue forbearance policies, instead simply collecting on the distressed loans from the government guarantor. This suggests that bank behavior toward unlisted firms may be quite different from that toward listed firms.
3. Data
Our database covers the period from 1993 to 2005, and contains annual data for both unlisted and listed firms in Japan. The unlisted firm data are primarily from Teikoku Databank, a credit research firm. The original Teikoku database contains over 500,000 unlisted firms, from large firms to small proprietorship businesses. From this extensive database, we obtained annual balance sheet and income statement data for firms with paid-in capital exceeding 80 million yen after 1993. We excluded 100 percent parent-owned subsidiaries, cooperatives, public utilities and financial firms. We also required that the firm report data for at least five consecutive years during our sample period.
We supplement these data with data for unlisted firms contained in Nikkei Financial
QUEST, although if an unlisted firm appears in both databases, we use the Teikoku data.2
2
The Nikkei database includes unlisted firms that are required to file with the Ministry of Finance. Firms having more than 1,000 shareholders (except for firms with less than 500 million yen of paid-in capital) are required to file. Both balance sheet and income statement data items are comparable to those for listed firms that are required to file with the Ministry of Finance. We cross-checked the data for these firms across the two databases for accuracy and found no significant differences.
Although the statements of the unlisted firms that do not file with the Ministry of Finance are not audited, the integrity of reporting is assured by being members of the Teikoku credit research universe of firms. Teikoku's research is widely used by banks and other financial institutions for
11
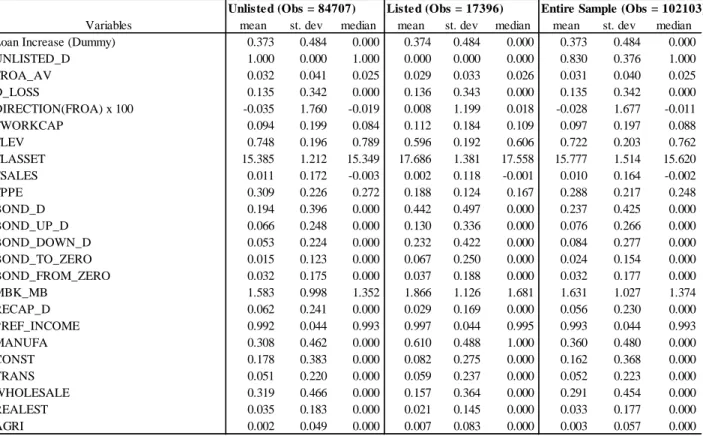
their credit assessment, and the fact that a firm belongs to this database (and obtained a Teikoku Company Code) is considered to be passing a milestone. For listed firms, we obtained annual financial and attribute data for 1993 to 2005 from Nikkei Financial QUEST, which includes all listed firms on the Tokyo and regional exchanges (including newly established exchanges for new and emerging firms), and JASDAQ. As with unlisted firms, we excluded public utilities and financial firms. Table 1 shows the number of firms of specific types included in our regression sample. We divided firms into the following three categories: (1) listed on the Tokyo Stock Exchange first section (TSE-1) or second section (TSE-2), (2) listed on other exchanges (regional exchanges, TSE MOTHERS, and JASDAQ), and (3) unlisted. The TSE, which has stricter listing standards than other exchanges, generally had a steady number of listed firms during the period, approximately 1,200 firms in a given year. The number of listed firms on other exchanges was also steady, at around 500. The number of firms in our unlisted firm sample was around 8,500 firms. The table also includes the number of firms that had IPOs.
Table 2 contains descriptive statistics for our sample of listed and unlisted firms separately. The table is based on the useable sample for the regression analysis, which begins only in 1996 because the earlier available data are used in constructing the lagged values for the explanatory variables. As shown in Table 2, the mean (median) paid-in capital for listed firms is 13.0 billion yen (4.4 billion yen) in 1996. In contrast, the mean (median) paid-in capital for unlisted firms is, as expected, much smaller, at only 423 million yen (105 million yen) in 1996. Similarly, the mean (median) for total assets for listed firms is 158 billion yen (43.8 billion yen) in 1996, but only 14.7 billion yen (5.5 billion yen) for unlisted firms. After 1996, paid-in capital rose and total assets declined on average for listed firms. For unlisted firms, the pattern is similar, with paid-in capital rising and total assets declining.
12
Table 3 contains the industry distributions for the listed and unlisted firm samples separately. Manufacturing firms account for 61 percent of the listed firms in 1996, but only 32 percent of unlisted firms. In sharp contrast, the percentages of Construction and Wholesale Trade, Retail Trade, and Eating and Drinking Places for unlisted firms are high (18 and 33 percent) compared to those for listed firms (only 8 and 16 percent) in 1996. Comparing 2005 to 1996, the listed firm shares remain relatively stable, while the unlisted firm shares fluctuate somewhat, with the 4 percentage point growth in the Services share being notable.
A main bank is designated for each firm for each year. For unlisted firms, the main bank
is the first-named bank in the firm attributes file of the Teikoku Databank.3
3
The set of main banks is limited to publicly traded banks for which we can calculate a market-to-book value, one of the control variables used in our regression analysis.
Because we have access to the identities of lenders to each listed firm from the Nikkei NEEDS loan database, we are able to identify the main banks for listed firms with more precision, designating the main bank as the lender with the largest volume of loans outstanding to the firm in each year. The main bank list is then smoothed to avoid instances in which a specific firm’s largest lender switches back and forth temporarily as new loans are made or existing loans mature. Table 4 shows the sharp contrast between listed firms and unlisted firms in the distribution of main banks by bank type. For listed firms, City Banks dominate as main banks, with Long-Term Credit Banks initially being in second place until their importance dissipates with their failures and nationalizations. Regional Banks then move into second place, well ahead of Trust Banks. Regional Banks 2 maintain a share of 1 percent or less. For unlisted firms, City Banks also are the dominant bank type, although representing a much smaller share than for listed firms. Regional Banks represent a much larger share than for listed firms, while Regional Banks 2, Long-Term Credit Banks and Trust Banks maintain very small shares.
13
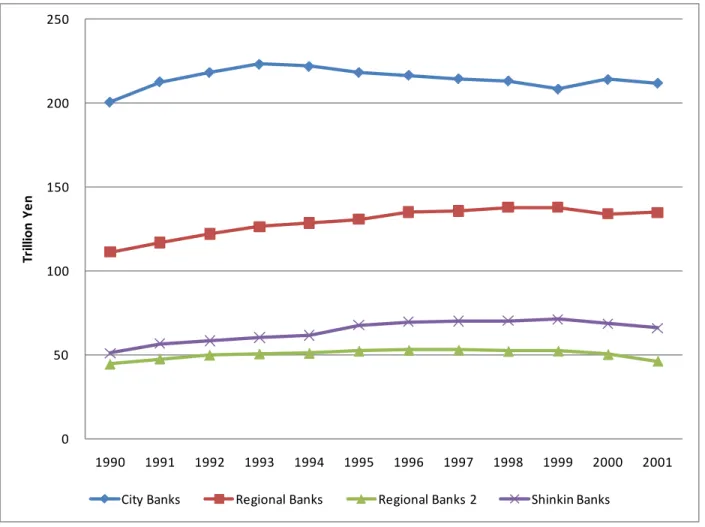
Figure 3 shows the patterns of bank lending during the 1990 to 2001 period for four different categories of banks: City Banks, Regional Banks, Regional Banks 2, and Shinkin Banks. The data for each year indicate total outstanding loans and discounts (including bills discounted, loans on bills, loans on deeds, and overdrafts) at the end of March for each fiscal year. While City Banks have decreased loans generally since 1993, the other three bank categories have tended to continue to gradually increase loans until near the end of the period shown. Unfortunately, the Bank of Japan provides data only for years prior to 2002.
4. Empirical Specification
While we do not have individual bank loan data for each unlisted firm, we do have total bank loans to the firm and can identify the main bank of the firm (as the first-named bank in the firm attributes file). Following Peek and Rosengren (2005) who examined listed firms to investigate the extent to which banks evergreened loans to firms, we specify an equation that explains the probability of a firm receiving increased loans using variables intended to measure firm health, other firm characteristics, main bank health, and main bank type, as well as additional controls for loan demand and general macroeconomic activity. However, by extending our sample to include unlisted firms as well as listed firms, we are able to investigate whether differences exist between the determinants of bank lending to unlisted firms compared to listed firms.
The dependent variable used in our regression models is a (0, 1) dummy variable that takes on a value of one if loans to the firm increase from the prior period. This directly follows the Peek and Rosengren (2005) specification, recognizing that a decrease in loans or no change in loans provides an ambiguous signal. Loans could remain unchanged either because the firm
14
did not request additional loans or because, even though the firm did request additional loans, the bank denied the request. Similarly, a firm’s loans could decline through simple amortization of existing loans, because firms did not desire to rollover maturing loans, because banks refused to rollover maturing loans to the firm, or because of debt forgiveness by the banks, each of which has different implications for the availability of credit to the firm. We use a random effects probit specification rather than a fixed (firm) effects specification because a fixed effects specification would not allow the firm characteristics in which we are most interested, such as being unlisted, to be included in the regression specification.
The basic specification is:
PR(LOANi, t) = a0 + a1FIRMi, t-1 + a2BONDi, t-1 + a3BANKi, t-1 + a4YEARi, t + a5REGIONi, t-1
+ a6INDUSTRYi, t-1 + ui, t-1
The dependent variable has a value of one if total loans to firm i from financial
institutions increased from year t-1 to year t, and zero if total loans to the firm were unchanged
or decreased from year t-1 to year t. The first vector of variables, FIRM, is intended to capture
firm health and other characteristics of the firm, and we use a one-year lag for each measure in the regressions. UNLISTED_D, a (0, 1) dummy variable, is equal to one if the firm is unlisted, and equal to zero if the firm is listed. The firm’s return on assets, FROA, is measured as the firm’s operating income as a share of its total assets for the prior year. FROA_AV is measured as the average of the firm’s ROA for the current and prior year. We also consider non-continuous measures of FROA_AV to allow for a nonlinear effect. FROA_LOW, a (0, 1) dummy variable, is equal to one if the firm’s FROA_AV is in the lowest quartile among the sample firms, and FROA_HIGH is a (0, 1) dummy variable indicating that the firm’s FROA_AV is in the highest quartile. The estimated coefficients then indicate differential effects compared to the middle 50
15
percent, which serves as the benchmark. In addition, we consider dummy variables that indicate to which quintile the firm’s ROA belongs. These are FROA_QUI1, FROA_QUI2, FROA_QUI4, and FROA_QUI5. The estimated coefficients then indicate differential effects compared to the third quintile, which serves as the benchmark.
In addition to these dummy variable measures for ROA, we also allow for a specific nonlinearity that permits a differential response when FROA_AV takes on negative values. The idea is that firms will try hard to avoid reporting negative earnings so that doing so may be particularly informative about the firm’s deteriorating health. For this specification, we add two variables in addition to including FROA_AV. The first is D_LOSS, a (0, 1) dummy variable that takes on a value of one if FROA_AV is negative and zero otherwise. The second variable is then the interaction term of D_LOSS with FROA_AV that allows the estimated effect of FROA_AV to differ when FROA_AV has a negative value from that when FROA_AV has a positive value. Finally, in addition to measures of ROA, we also include DIRECTION(FROA) to account for whether FROA is rising or falling. This variable is measured as the difference between FROA and FROA_AV.
The firm’s working capital, FWORKCAP, is measured as the firm’s current (having a life of less than one year) assets less current liabilities, as a share of total assets. To control for capital structure, we consider a measure of leverage, FLEV, calculated as the value of the ratio of the firm’s total liabilities to the firm’s total assets. Firm size, FLASSET, is measured as the logarithm of the firm’s total real assets, using the Consumer Price Index as the deflator. The change in the firm’s real sales (using the Consumer Price Index as the price deflator) from period (t-1) to period t, scaled by period (t-1) real sales, FSALES, is used to control for shifts in the firm’s loan demand. A firm’s tangible assets, FPPE, are measured as property, plant and
16
equipment, as a share of the firm’s total assets. We interact each of these firm variables with the unlisted firm dummy variable to allow the effects to differ between listed firms and unlisted firms.
The second set of explanatory variables, BOND, is a vector of variables intended to
capture the bond issuing behavior of firms. Five bond issue-related (0, 1) dummy variables are included. BOND_D is equal to one if the firm has bonds outstanding during the prior period, and is equal to zero otherwise. BOND_UP_D is equal to one if the firm increased bonds outstanding during the prior year, and is equal to zero otherwise. BOND_DOWN_D is equal to one if the firm decreased bonds outstanding during the prior year, and is equal to zero otherwise. We also allow for differential effects when bonds outstanding increase from zero or decline all the way to zero. BOND_TO_ZERO is equal to one if the firm’s bonds outstanding decline to zero during the prior period, and is equal to zero otherwise. BOND_FROM_ZERO is equal to one if the firm’s bonds outstanding increase from zero during the prior period, and is equal to zero otherwise. Again, each of these explanatory variables is entered separately and interacted with the unlisted firm dummy variable to allow for differential effects on listed and unlisted firms.
The third set of explanatory variables, BANK, is a vector of variables intended to capture
main bank health. The primary measure of main bank health, MBK_MB, is measured as the main bank’s market-to-book ratio at the end of the prior period. In addition, RECAP_D is a (0, 1) dummy variable, with a value of one indicating that the main bank was recapitalized during the prior year. Again, each of these variables is interacted with the unlisted firm dummy variable to allow for differential effects on listed and unlisted firms.
The fourth set of explanatory variables, YEAR, contains a set of annual (0, 1) dummy
17
of macroeconomic conditions in each year relative to the base year of 1996. These variables also are interacted with the unlisted firm dummy variable to allow differential effects.
The fifth set of explanatory variables, REGION, contains PREF_INCOME to capture the
average effect of regional economic conditions in each year. PREF_INCOME is measured as the average growth rate of real income per capita during the past three years in the prefecture in which the firm is headquartered. We also interact this term with the unlisted dummy variable to allow for local economic conditions to impact lending to unlisted firms differently than to listed firms.
The sixth set of explanatory variables, INDUSTRY, contains six industry dummy
variables in order to control for any systematic differences across industries. We use a set of (0, 1) dummy variables indicating whether a firm belongs to agriculture, forestry, fishery and mining (AGRI), manufacturing (MANUFA), construction (CONST), transport and communications (TRANS), wholesale trade, retail trade, and eating and drinking places (WHOLESALE), and real estate (REALEST). The base group is the service industry. These variables also are interacted with the unlisted firm dummy variable.
We also estimate the equations for some subsets of firms or sample periods, for example based on main bank type or firm size, allowing the slope coefficients on the explanatory variables to differ across subsamples. By considering specific subsets of observations, we may be better able to identify the extent of, and the reasons for, differences in the bank treatment of listed compared to unlisted firms during the crisis period.
18 5. Results
The dependent variable in the regression equations is a (0, 1) dummy variable that takes on a value of one if total loans to the firm were increased between time period (t-1) and period t, and zero otherwise. The equations are estimated using random effects probit techniques. While we have data for the 1993 to 2005 period, the regressions can be estimated only over the 1996 to 2005 period because the prior observations are required to calculate the lagged changes in the set of explanatory variables. We have removed outliers, defined as those observations outside the 1 percent tails of the distributions, for the explanatory variables measuring firm health and firm characteristics other than size. In removing outliers, we have considered the unlisted and listed firm observations as separate databases to avoid disproportionately removing either listed observations or unlisted observations at either extreme, given that the distribution of characteristics of unlisted firms may differ systematically from those of listed firms. Similarly, we have removed the 1 percent tails year by year rather than from the aggregated set of observations to avoid disproportionately removing observations from the years with the very best and very worst firm performances. Table 5 contains the descriptive statistics for the variables used in the regression analysis.
5.1 Sample of Firms Always Listed or Always Unlisted
Table 6 contains the results for the firms in our sample that appear only as listed firms or only as unlisted firms. In later specifications, we also include IPO firms in our sample that switch
from being unlisted to being listed.4
4
We do not include delisted firms because of the few such observations present.
The first column indicates that, for listed firms, the return on assets has a negative effect, suggesting that worse performing firms were more likely to obtain
19
an increase in loans, consistent with banks evergreening loans to the weakest firms. Moreover, the negative estimated coefficient on the direction of the change in firm ROA indicates that listed firms with declining ROA performance were even more likely to obtain increased bank loans, again consistent with evergreening behavior by banks toward listed firms. Firms with more working capital were less likely to obtain an increase in loans, perhaps reflecting less need for additional loans, and thus a lower demand for loans by these firms. The negative estimated effect for firm leverage indicates that the heavier was a firm’s existing debt load, the less likely was the firm to obtain increased loans. The estimated coefficients also indicate that larger listed firms were less likely to obtain an increase in bank loans, perhaps reflecting their better access to alternative sources of funds through the bond market, or perhaps reflecting less loan demand to the extent that these tend to be more mature firms. Listed firms with faster sales growth were more likely to obtain increased loans, consistent with such firms having a stronger demand for credit in order to increase capacity to meet the growing demand for their goods and services. Listed firms with a larger share of their assets in the form of property, plant and equipment were less likely to obtain increased loans.
Each of the differential effects for unlisted firms compared to listed firms associated with firm characteristics, with the exception of sales growth and FPPE, also has a statistically significant effect, with the effect being of opposite sign with the exception of firm size. Moreover, the total effects for unlisted firms (the sum of the effect for listed firms and the differential effect for unlisted firms) differ significantly from zero at the 1 percent level for each of the unlisted firm characteristics (indicated by the “b” designation). The positive differential effect of ROA more than offsets the negative effect for listed firms, indicating that the total effect for unlisted firms is positive and, as indicated, differs significantly from zero. Thus, in
20
contrast to the results for listed firms consistent with banks evergreening loans, higher ROA increases the probability that an unlisted firm will obtain increased loans. The positive differential effect on the direction of the change in ROA for unlisted firms offsets most of the negative effect for listed firms, although the net effect remains negative. The positive differential effect on working capital partially offsets the negative effect estimated for listed firms, indicating that the net effect for unlisted firms remains negative, but is only about half as large (in absolute value). The positive differential effect on leverage more than offsets the negative effect for listed firms, indicating that the net effect for unlisted firms is positive. Thus, unlisted firms with greater leverage are more likely to obtain increased loans. The negative differential effect on firm size reinforces the negative effect for listed firms, indicating that smaller unlisted firms are even more likely to obtain increased loans. Finally, while the differential effects for both sales growth and FPPE provide a slight offset to the effects for listed firms, neither differential effect is statistically significant.
With respect to the bond variables, BOND_D has a statistically significant positive effect for listed firms, indicating that firms with bonds outstanding are more likely to obtain an increase in bank loans. Listed firms that decreased bonds outstanding over the prior year were more likely to experience an increase in bank loans, and if outstanding loans decreased all the way to zero, the firm was even more likely to obtain increased bank loans. These two effects are consistent with banks replacing the credit to the firms as their outstanding bonds mature. Moreover, these effects are consistent with banks aiding weakened firms that are no longer able to access the bond market, insofar as firms squeezed completely out of the bond market are more likely to obtain increased bank loans than firms that merely experience a decline in their bonds outstanding. That is, listed firms no longer able to pass the market test enabling them to roll over
21
their maturing bonds return to their bank lenders that may not hold the firms to the same high standard as the arms-length bond market. On the other hand, when listed firms enter the bond market, with bonds outstanding increasing from zero, the bond issuance appears to replace the need for bank loans, reducing the probability of the firm obtaining increased loans.
For unlisted firms, four of the differential effects are statistically significant, while three of the total effects for unlisted firms are statistically different from zero. Unlisted firms with bonds outstanding are more likely to obtain increased loans, although the effect does not differ significantly from that for listed firms. An increase in bonds outstanding by unlisted firms decreases the probability of the firm obtaining increased loans even more than for listed firms. The negative differential effect of a decrease in bonds outstanding offsets most of the positive effect for listed firms, although the total effect if bonds outstanding fall all the way to zero is stronger for unlisted firms than for listed firms. Similarly, the differential effect when unlisted firms enter the bond market offsets almost the entire effect for listed firms.
The control for local economic conditions, the three-year average growth rate of real per capita income in the prefecture in which the firm is headquartered, has a negative and statistically significant effect for listed firms, indicating that a firm headquartered in a prefecture with a smaller value of PREF_INCOME is more likely to obtain increased bank loans. This is consistent with loans being directed to listed firms in the worst performing geographical areas. In contrast, for unlisted firms the positive estimated differential coefficient almost precisely offsets that for listed firms, indicating that local economic conditions had no net effect on the probability of an unlisted firm obtaining increased loans, once the firm’s own health and characteristics are taken into account.
22
Among the industry effects for listed firms, two of the industry dummy variables, CONST and TRANS, have estimated coefficients that are positive and statistically significant, indicating that listed firms in these industries are more likely (compared to the services industry which serves as the benchmark) to obtain increased loans. Only one of the differential effects for unlisted firms, that for TRANS, is statistically significant. The total effects for unlisted firms differ significantly from zero for three industries (manufacturing, wholesale and real estate), with the total effect being positive in each case.
The remaining three columns contain alternative specifications that allow for the possibility of nonlinear effects emanating from ROA. In column 2, the continuous ROA measure is replaced by two (0, 1) dummy variables for observations in the highest quartile and the lowest quartile that indicate differential effects compared to the middle 50 percent of the observations. In column 3, the continuous ROA measure is replaced by (0, 1) dummy variables for observations in the top two and bottom two quintiles, with the estimated coefficients indicating differential effects compared to the effects emanating from the middle quintile. These specifications provide evidence consistent with the column 1 results and have no meaningful impacts on the estimated coefficients of the other explanatory variables.
The column 4 specification allows the ROA effect to have a differential effect when FROA_AV is negative. The negative and statistically significant estimated coefficient on D_LOSS indicates that listed firms reporting negative earnings are less likely to obtain an increase in loans, providing a partial offset to the FROA_AV effect. However, the negative estimated coefficient on the interaction term of D_LOSS with FROA_AV reinforces the FROA_AV effect, although this differential effect is not statistically significant. For unlisted firms, the differential ROA effect is slightly larger compared to the column 1 estimate, but
23
neither D_LOSS nor its interaction with FROA_AV have statistically significant differential effects. The remaining coefficients, including that for DIRECTION, are essentially unaffected compared to those in column 1.
5.2 Subperiods
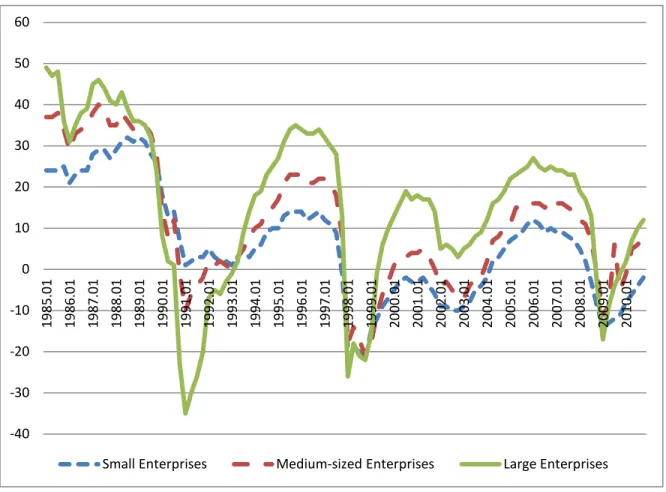
The acute phase of the credit crisis (1998-1999) when several financial institutions failed, including the nationalization of two large long-term credit banks, may have caused banks to behave differently. In fact, the Bank Lending Attitude Diffusion Indices compiled by the Bank of Japan, containing responses separately from small, medium, and large firms, show a rapid worsening of banks’ lending attitudes in this period, as shown in Figure 4. An interesting characteristic of this episode of credit tightening is that all three types of firms experienced difficulties of a similar magnitude, whereas both prior to this phase of the crisis and subsequent to this episode the spread of the indices across small, medium and large firms was much larger. After major banks were recapitalized by two government capital infusions, the indices show sharp improvement, although small firms’ sentiment recovered more slowly than did that for medium firms, and much more slowly than for large firms.
Table 7 contains the results, using the continuous measure of firm ROA corresponding to column 4 of Table 6, for three subperiods: 1996-1997, 1998-1999 and 2000-2005. The first column of Table 7 contains the results for the 1996 to 1997 subperiod. Focusing on the set of firm characteristics, for this subperiod six of the seven firm characteristics for listed firms are statistically significant, with the lone exception being firm leverage. In addition, each of the significant coefficients is larger (in absolute value) than the corresponding estimate in Table 6. However, D_LOSS no longer has a statistically significant effect as in Table 6. Still, lower
24
ROAs and declining ROAs are even more strongly associated with an increase in bank loans, suggesting even stronger evergreening behavior by banks toward listed firms for this subperiod compared to the full sample estimates. Four of the differential effects for unlisted firms are statistically significant. As is the case for the entire sample, the positive differential effect of ROA for unlisted firms more than offsets the negative effect for listed firms.
The second column of Table 7 contains the results for the 1998-99 crisis subperiod. Again focusing on the measures of firm characteristics, all but the leverage ratio and FPPE have statistically significant effects for listed firms. While the FROA_AV effect is now larger (in absolute value) compared to the 1996-97 subperiod, the partially offsetting effect of D_LOSS is now statistically significant. Only two of the seven differential effects for unlisted firms are significant, those for ROA and the change in ROA, with the differential effect indicating a more than offsetting effect for listed firm ROA.
The third column of Table 7 contains the results for the longer 2000-2005 subperiod. Again focusing on the firm characteristics, five of the seven effects for listed firm characteristics are significant, although those for both ROA and the change in ROA are now much smaller. The D_LOSS effect is significant and also is smaller than for the 1998-99 subperiod. Thus, while the evidence remains consistent with evergreening for listed firms, the magnitude of this effect appears to be much smaller subsequent to the 1998-99 crisis. Moreover, increased leverage now has a negative and significant coefficient, indicating that listed firms with a higher debt load have a reduced likelihood of obtaining increased loans. With respect to the differential effects for unlisted firms, four of the seven effects are significant, with those for both FROA_AV and LEV more than offsetting the listed firm effects.
25 5.3 Main Bank Type Subsamples
Table 8 contains the results for two subsets of firms based on their main bank type. The first regression in Table 8 contains results for the firms with a City Bank as their main bank, while the second regression contains the results for the firms with a Regional 1 or Regional 2 Bank as their main bank. For the explanatory variables of particular interest, the firm characteristics, the general pattern of the signs and significance of the estimated coefficients for the firms with a city bank as their main bank is similar to that for the combined sample (Table 6, Column 4). In contrast, some differences from the Table 6 results for the set of banks with Regional Banks as their main banks are apparent. However, the evergreening story remains essentially unchanged. While the ROA effect is somewhat larger (in absolute value) compared to that for City Banks, the offsetting effect emanating from the negative D_LOSS effect is larger, and the change in ROA effect also is smaller (in absolute value). Still, the unlisted firm differential effect for ROA is significant and more than offsets that for listed firms.
5.4 Does firm size matter?
One systematic difference between listed and unlisted firms is that listed firms tend to be larger, on average, than unlisted firms. To address the concern that the results in the earlier tables might be related to differences in firm size, even though the log of real assets of the firm is included as an explanatory variable, the base regression from column 4 of Table 6 has been re-estimated for three subsamples selected based on firm size. The three dimensions of firm size considered are total assets, total loans and the number of employees. The subsamples were chosen to include the range for which a major size overlap occurs for listed and unlisted firms, omitting both extremely large (predominately listed) firms and extremely small (predominately
26
unlisted) firms. For the log of total assets, the overlapping range is 15 to 18. For the log of total loans, the overlapping range is 13 to 17. For the number of employees, the overlapping range is
100 to 1,000.5
The first column in Table 9 reproduces the results from column 4 of Table 6 for ease of comparison. While the point estimates for the explanatory variables vary somewhat, the main story remains. For each of the subsamples, both firm ROA and the change in ROA for listed firms have negative and statistically significant coefficients, while the differential effects for unlisted firms are both positive and statistically significant, with that for the unlisted firm ROA differential effect more than offsetting the negative coefficient on ROA for listed firms in each instance. Thus, even when the extremes for any of the three alternative indicators of size are eliminated, the results suggesting differential treatment of unlisted firms with respect to evergreening bank behavior remain.
5.5 Including IPO firms
An alternative approach is to include IPO firm observations in our analysis. The pre-IPO observations would be included with the unlisted firm observations, while the post-IPO observations would be included with the listed firm observations. A comparison could then be made between the pre-IPO observations and the post-IPO observations, as well as (1) between the listed firm observations for firms that are always listed and the newly listed post-IPO observations, and (2) between the unlisted firm observations for firms that are always unlisted and the unlisted observations for IPO firms prior to their listing.
5These cut-off points were chosen to cover from approximately the 25th percentile of unlisted firms to
27
The Table 10 specifications allow such comparisons. The first regression shown uses the listed post-IPO observations as the base and allows a comparison with both the pre-IPO unlisted observations and the observations from the always listed firms. For the post-IPO observations, six of the seven firm characteristics have statistically significant effects, with the lone exception being firm leverage. Of particular interest, both firm ROA and the change in ROA have negative estimated effects, consistent with listed firms more generally. However, the estimated effects are smaller (in absolute value) than those for listed firms in the earlier tables. Reinforcing this weaker effect, the offsetting effect of D_LOSS is now larger (in absolute value). Still, four of the pre-IPO unlisted firm differential effects are statistically significant, and all but firm leverage are of the opposite sign. However, the offsetting differential effect of ROA for pre-IPO firms is now only half as large as that for the post-IPO observations and not statistically significant. For the always listed observations, the differential effects for both ROA and the change in ROA are of the same sign and are statistically significant. Thus, it appears that the treatment by banks of newly listed post-IPO firms lies somewhere between that of their pre-IPO selves and the always listed firms.
The second regression shown uses the unlisted pre-IPO observations as the base and allows a comparison with both the post-IPO listed observations and the observations from the always unlisted firms. For the base pre-IPO observations, neither firm ROA nor the change in ROA has a statistically significant effect on the likelihood of receiving increased loans. Consistent with the first regression in the table, the post-IPO listed observations have firm ROA and the change in ROA estimated differential effects of the opposite sign, with that for the change in ROA being statistically significant. On the other hand, neither firm ROA nor the change in ROA have differential effects for the always unlisted firms that are statistically
28
significant. Thus, it does not appear that banks treat the pre-IPO unlisted firms differently than they treat unlisted firms generally with respect to evergreening behavior based on firm performance as measured by a firm’s ROA.
6. Further Analysis of Listed Firms
It has now been established that unlisted firms have been treated differently by banks compared to listed firms. In particular, the evidence is consistent with banks being more likely to undertake evergreening behavior toward listed firms than toward unlisted firms. Moreover, even when we consider samples of listed and unlisted firms in the same size range, this difference remains. Thus, being a listed firm appears to matter. Now we turn to better understanding what might underlie this bank behavior toward listed firms.
6.1 TSE vs. Non-TSE Listings
The Tokyo Stock Exchange (TSE) is the premier stock exchange in Japan. An interesting question concerns the extent to which the favoritism shown toward listed firms by Japanese banks is reserved for TSE firms (essentially the A list), or also extends to firms listed on other stock exchanges. Table 11 contains the results from estimating the basic equation for the set of listed firms, making a distinction between firms listed on the Tokyo Stock Exchange (First and Second sections) and non-TSE listed firms. The first column contains results for the observations for the always listed firms, while the second column adds the post-IPO listed observations. The base group of observations is for the TSE listed firms.
For the always listed firms, shown in column 1, the TSE firms have estimated coefficients for the firm characteristics that are similar to those for the full set of listed firms
29
shown in column 4 of Table 6. The difference is that for all but sales growth, the estimated effects for the TSE firms are slightly stronger. Consistent with this comparison, the differential effects for the non-TSE observations are of the opposite sign from those for the TSE observations for each firm characteristic, with the exception of sales growth. However, the differential effect for ROA is significant only at the 10 percent level. Moreover, the negative and statistically significant effect emanating from the main bank market-to-book ratio also suggests the presence of evergreening by the weaker banks for TSE firms, although the offsetting differential effect for non-TSE firms suggests that this effect does not carry over to firms listed on minor exchanges. Thus, the evidence suggests that banks are less likely to engage in evergreening behavior with non-TSE listed firms compared to TSE firms.
When the listed firm observations are supplemented with the post-IPO observations from the IPO firms, shown in column 2, both the ROA and the change in ROA effects for TSE firms weaken somewhat, although they retain their significance. At the same time, five of the seven differential effects for non-TSE firms are now statistically significant. In particular, both ROA and the change in ROA have offsetting differential effects, with that for ROA almost fully offsetting the effect for TSE-listed firms. This evidence is consistent with banks being somewhat less likely to engage in evergreening behavior towards the IPO firms that list on the TSE, and even less willing to evergreen loans for firms listed on a non-TSE exchange. Finally, main bank health effects have a similar pattern as in column 1.
6.2 Concentration of Bank Ownership of Listed Firms
The extent to which ownership by banks of a firm is concentrated may provide an incentive for those bank owners to undertake evergreening behavior toward that firm. Such
30
relationships indicate strong bank-firm ties, as well as providing lenders with an incentive to delay or prevent the bankruptcy of a troubled firm because such an event would impact the
lender’s own reported financial health. Thus, lenders with a substantial exposure to a firm, even
if the lender is aware of the firm’s precarious health, may continue lending to the firm to avoid having to recognize any losses that would impact its own balance sheet were the firm to default on its loans or enter bankruptcy. Unfortunately, data on ownership and lender concentrations are available only for listed firms. Thus, we are able to supplement our basic specifications with ownership concentration measures only for the listed firms in our sample.
Table 12 reports the descriptive statistics (mean, median, minimum, and maximum values) for the concentration of bank lending to, and bank ownership of, the listed firms in our sample. The number of lending banks, the Main Bank’s loan share, and the Top 3 lending banks’ loan share are from the Nikkei NEEDS loan database. The mean (median) number of lending banks is 8.61 (7), ranging from zero to 88 banks. The Main Bank and Top 3 loan shares are measured relative to the firm’s total loans outstanding. The Main Bank and Top 3 lender loan concentrations are, on average, 31 and 59 percent of a firm’s total loans outstanding, respectively. The shareholding data are from Toyo Keizai Shimpo Sha. The mean (median) number of shareholding banks reported for the sample of listed firms is 4.73 (4), ranging from zero to 15 banks. On average, Main Banks own 3 percent of the outstanding shares of listed firms, with the ownership by the Top 3 lender banks accounting for 7 percent of outstanding shares. All banks as a group hold, on average, 11 percent of the outstanding shares of a listed firm. While bank regulations limit a bank’s ownership to 5 percent of a firm’s shares, the table does show a maximum of 10 percent for Main Bank ownership. Due to bank mergers and acquisitions, bank ownership shares can exceed the 5 percent limit temporarily.
31
Table 13 contains the results for our sample of listed firms for the basic specification in column 4 of Table 6 supplemented with the ownership concentration measures for main banks and the top three lender banks. The bank ownership concentration measures are entered separately, as well as interacted with the four ROA-related measures, FROA_AV, D_LOSS, D_LOSS*FROA_AV and DIRECTION(FROA). The interaction terms are included because these measures of firm health have the greatest potential for indicating the extent to which banks are evergreening loans to the weakest firms. If banks are responding to the incentive to evergreen loans the more concentrated is bank ownership among the primary lenders to the firm, the ownership measure would be expected to have a positive estimated coefficient, and the interactive terms, other than for D_LOSS, would be expected to have negative estimated coefficients. That is, the more concentrated is bank ownership of the firm by the primary lenders to the firm, the more likely are banks to increase loans to the firm, and that likelihood should increase the weaker is the performance of the firm.
The results in Table 13 confirm that greater bank ownership concentration, either by the main bank alone (column 1) or by the top three lenders to the firm (column 2), increases the likelihood of the firm obtaining increased loans. While none of the interaction terms for either the main bank or the top three lenders’ ownership concentration are statistically significant, that for D_LOSS*FROA_AV*Top3 Lenders’ Ownership is significant at the 10 percent level and indicates that the ownership effect is strengthened the lower is the firm’s ROA for firms with a negative ROA. Even with the addition of these interaction terms, both FROA_AV and DIRECTION retain their significant negative effects. Moreover, the market-to-book ratio of the firm’s main bank has a significant negative estimated coefficient in both specifications, indicating that the weaker is the firm’s main bank, the more likely the firms obtains an increase
32
in loans, consistent with evergreening behavior. Thus, bank ownership of unhealthy listed firms contributes to the incentive for banks to evergreen loans in Japan during the banking crisis.
7. Conclusion
Because SMEs are more likely than large firms to be bank dependent, it is important to better understand the determinants of credit availability to SMEs. Moreover, because most studies draw conclusions based on evidence for only the larger, listed firms due to the unavailability of data for unlisted firms, those conclusions may be unwarranted for the great mass of firms that are most reliant on bank credit. This study addresses this important shortcoming of most of the existing literature, both by including a set of unlisted firms in the analysis and by investigating differences between the treatment of listed and unlisted firms by their lenders.
Our evidence is consistent with Japanese banks’ evergreening loans to listed firms, consistent with previous studies. However, we find significant differences in the way that Japanese banks have treated unlisted firms. In particular, the differential effects for unlisted firms for both ROA and the direction of the change in ROA tend to offset the evergreening effect found for listed firms. In fact, the total ROA effect for unlisted firms is positive in contrast to the negative effect found for listed firms; that is, banks are more likely to increase loans to unlisted firms the larger is their ROA.
While listed firms are, on average, larger than unlisted firms, size differences do not appear to be the source of the differential treatment. In addition to controlling for firm asset size, subsamples of listed and unlisted firms are considered with overlapping sizes of assets, loans and employees. Yet the evidence of differential treatment remains, suggesting that the special
33
treatment by banks may be attributable to a firm achieving listed status. Moreover, the evergreening behavior by banks toward listed firms appears to be stronger for those firms listed on the Tokyo Stock Exchange, the premier exchange in Japan, compared to other, less prestigious stock exchanges.
Interestingly, for the set of listed firms, we find that a higher concentration of ownership of a firm by either the firm’s main bank or the firm’s top three lenders increases the likelihood of the firm obtaining increased loans. Thus, it appears that lenders respond to increased equity exposure by making additional loans available to a firm.
34 References
Ahearne, Alan G., and Naoki Shinada, 2005, “Zombie Firms and Economic Stagnation in Japan,” International Economics and Economic Policy 2(4): 363–81.
Caballero, Ricardo J., Takeo Hoshi, and Anil K. Kashyap, 2008, “Zombie Lending and
Depressed Restructuring in Japan,” American Economic Review 98(5): 1943-1977.
Hamao, Yasushi, Jianping Mei, and Yexiao Xu, 2007, “Unique Symptoms of Japanese
Stagnation: An Equity Market Perspective,” Journal of Money, Credit, and Banking 39(4): 901–
23.
Hoshi, Takeo, and Anil K. Kashyap, 2001, Corporate Financing and Governance in Japan.
Cambridge, MA: MIT Press.
Hosono, Kaoru, and Masaya Sakuragawa, 2003, “Soft Budget Problems in the Japanese Credit Market,” Nagoya City University Discussion Papers in Economics 345.
Nishimura, Kiyohiko, Takanobu Nakajima, and Kozo Kiyota, 2005, “Does the Natural Selection Mechanism Still Work in Severe Recessions? Examination of the Japanese Economy in the
1990s,” Journal of Economic Behavior and Organization 58(1): 53–78.
Peek, Joe, and Eric S. Rosengren, 2005, “Unnatural Selection: Perverse Incentives and the
Misallocation of Credit in Japan,” American Economic Review 95(4): 1144–66.
Sakai, Koji, Iichiro Uesugi, and Tsutomu Watanabe, 2005, “Firm Age and the Evolution of Borrowing Costs: Evidence from Japanese Small Firms,” Research Institute of Economy, Trade and Industry Discussion Paper 05-E-026.
Sekine, Toshitaka, Keiichiro Kobayashi, and Yumi Saita, 2003, “Forbearance Lending: The Case
of Japanese Firms,” Monetary and Economic Studies 21(2): 69–92.
The Ministry of Internal Affairs and Communications, 2010, Nihon Tôkei Nenkan (Japan
35
The Small and Medium Enterprise Agency, 2003, Chusho Kigyo Hakusho (The White Paper on
Small and Medium Enterprises)
Uesugi, Iichiro, 2008, “Chûshô Kigyô ni okeru Tôta wa Seijyô ka?” (Is the Selection in Small
Firms Natural?), in Kenshô Chûshô Kigyô Kin-yu (Examination of Small Business Financing),
36
Figure 1. Ratio of Total Debt to Total Assets for Japanese Firms (1975 - 2009) This figure presents the ratio of total debt to total assets for four different size categories of Japanese firms during the 1975-2009 period. The data source is the Ministry of Finance, Policy Research Institute. Micro firms, small firms, medium firms, and large firms are defined by the size of their paid-in capital. Micro firms are defined as firms with paid-in capital of less than 10 million yen. Small firms are defined as firms with paid-in capital of more than 10 million yen and less than 100 million yen. Medium firms are defined as firms with paid-in capital of more than 100 million yen and less than 1 billion yen. Large firms are defined as firms with paid-in capital of more than 1 billion yen.
0.5 0.55 0.6 0.65 0.7 0.75 0.8 0.85 0.9 0.95 1 1975 1977 1979 1981 1983 1985 1987 1989 1991 1993 1995 1997 1999 2001 2003 2005 2007 2009
Debt/Assets
37
Figure 2. Bank Loans to Total Debt Ratio (1975 - 2009)
This figure presents the ratio of bank loans to total debt for four different size categories of Japanese firms during the 1975-2009 period. The data source is the Ministry of Finance, Policy Research Institute. Micro firms, small firms, medium firms, and large firms are defined by the size of their paid-in capital. Micro firms are defined as firms with paid-in capital of less than 10 million yen. Small firms are defined as firms with paid-in capital of more than 10 million yen and less than 100 million yen. Medium firms are defined as firms with paid-in capital of more than 100 million yen and less than 1 billion yen. Large firms are defined as firms with paid-in capital of more than 1 billion yen.
0 0.1 0.2 0.3 0.4 0.5 0.6 1975 1977 1979 1981 1983 1985 1987 1989 1991 1993 1995 1997 1999 2001 2003 2005 2007 2009
Bank Loans/Total Debt
38
Figure 3. Bank Lending in Japan (1990 - 2001)
This figure presents the trend of bank loans outstanding in Japan for four major bank categories (City Banks, Regional Banks, Regional Banks 2, and Shinkin Banks) during the 1990-2001 period. Bank loans for each year include total outstanding loans and discounts (including bills discounted, loans on bills, loans on deeds, and overdrafts) at the end of March. The Bank of Japan is the data source, where bank loans by type of bank are available only for years prior to 2002.
0 50 100 150 200 250 1990 1991 1992 1993 1994 1995 1996 1997 1998 1999 2000 2001 Tr illio n Y en
39
Figure 4. Bank Lending Attitude Diffusion Index
This figure presents the Bank Lending Attitude Diffusion Index during the period of 1985-2010 based on a quarterly survey by the Bank of Japan for all industries. Firms are asked whether bank lending attitudes are moderate, not so severe, or severe in a questionnaire survey. The Diffusion Index is calculated as the percentage of firms that described bank lending attitudes as being moderate minus the percentage of firms that described bank lending attitudes as being severe. Until 2003:Q4, the size of firms was based on the number of permanent employees (small: 50 - 299, medium: 300 - 999, large: over 1,000). From 2004:Q1, the size is based on the amount of paid-in capital (small: 20 million - 100 million yen, medium: 100 million - 1 billion yen, large: over 1 billion yen).
-40 -30 -20 -10 0 10 20 30 40 50 60 1985. 01 1986. 01 1987. 01 1988. 01 1989. 01 1990. 01 1991. 01 1992. 01 1993. 01 1994. 01 1995. 01 1996. 01 1997. 01 1998. 01 1999. 01 2000. 01 2001. 01 2002. 01 2003. 01 2004. 01 2005. 01 2006. 01 2007. 01 2008. 01 2009. 01 2010. 01
40
Table 1. Number of Firms in the Regression Sample
This table shows the number of each category of firms in our regression sample. TSE I (II) indicates being listed on the Tokyo Stock Exchange Section I (II). Non-TSE includes regional exchanges, TSE MOTHERS, and JASDAQ markets.
Year Always TSE I listed Always TSE II listed Always Non-TSE listed IPO to TSE I excl. upgraders IPO to TSE II excl. upgraders IPO to others Always unlisted 1996 907 344 637 0 13 162 7,692 1997 915 349 625 2 10 114 8,126 1998 946 328 614 2 3 100 8,317 1999 934 333 585 4 10 67 8,563 2000 938 333 497 4 16 93 8,699 2001 954 328 472 13 16 148 8,813 2002 946 315 455 6 21 109 8,598 2003 901 285 430 6 9 112 8,880 2004 874 269 393 9 11 98 8,828 2005 882 245 362 12 14 141 8,191 Average 920 313 507 6 12 114 8,471