Predicting Customer Preference of Mobile Service using Neural
Network
Mensah Kwabena Patrick
1and Suleman Nasiru
21University for Development Studies, Faculty of Mathematical Sciences
Department of Computer Science, P. O. Box 24 Navrongo, Ghana West Africa
2University for Development Studies, Faculty of Mathematical Sciences
Department of Statistics, P. O. Box 24 Navrongo, Ghana West Africa
Abstract
In countries where several Mobile Communication Service providers operate, it is imperative on the service providers to recognize the aspects of their services that will attract new customers in order to help them stay on top of the competition. This is known to be expensive in terms of money and time. To address this problem, we present a Feed-forward Back-propagation Neural Network (FBNN) that is aimed at learning potential customers’ “would-be” pattern of choosing a Mobile Service based on selected criteria. The Neural Network is tested on sample data and predictions made to the same effect as already mentioned. The results show that the Neural Network is adequate for predicting customer preference of a mobile service. This research concentrates on predicting new customer preferences as opposed to the popular notion of models predicting (existing) customer churn.
Keywords: Feed-forward Back-propagation, Mobile Service Provider, Neural Network, Prediction.
1 Introduction
It is known to be more expensive for Mobile Communication service providers (MCSP) to attract new customers than to maintain existing ones [1]. However, when a MCS is being set up for the first time in a country, there is no doubt they must attract new customers whatever the cost may be. In order to reduce this cost, it is prudent to tap the experience(s) of well-established MCSPs in the same locality than trying to “cross virgin terrains”. In this paper, therefore, data is collected from customers of MTN; a well-established MCSP in Africa, and used to train a FBNN for purposes of making predictions as to what would attract potential customers to a new MCSP. Accurate prediction tools such as the FBNN applied in this paper can help reduce further the cost of acquiring new customers for both newly established MCSPs and existing ones.
MCSPs in developing countries face major challenges in term of choosing the type of services that will earn them new customers. Some of them introduce new services without prior research to determine either the newly-introduced service will be profitable to them or not. In other words, potential customer preferences are not studied or considered before new services are introduced. Most services are introduced with the aim of preventing existing customers from churning; little attention is given to potential new customers since that process is assumed to be expensive. One of the reasons for the high cost is the fact that it is not easy to identify potential customers and to even get data on them. To help solve this problem, this study uses data collected from existing customers of a well-established MCSP (MTN), divides it into training, validation and test sets to run on a FBNN for predicting the combination of services that are likely to interest a customer to choose a MCSP as their service provider. The results obtained can be used as a starting point for potential MCSPs who want to target the same market.
Neural Network is the preferred choice for this study since they are known to be valid, efficient, robust, and reliable, and outperform traditional mathematical approaches [2].
The rest of this paper is organized as follows: Section two reviews some existing literature on Artificial Neural Networks especially on Feed-forward Back-propagation NNs. It concludes with a short acknowledgement of related work. Section three considers the methodology employed in this paper relating to how data was collected, how the network was created, and trained. Section four discusses the results and their implications. Section five then concludes the work and suggests areas for further research.
2 Literature Review 2.1 Artificial Neural Networks
networks (a network of neurons) in terms of how they learn and adapt. The neuron is the building block of the human brain [3], and how they work is exactly what ANNs aim at simulating. The structure of the neural cell of the Human brain is shown in Fig. 1. Like the network of neurons in the human brain, ANNs have the ability to learn through experience, and also make basic decisions. This learning process can be accomplished through training. ANNs are good in recognizing patterns. Pattern recognition is a property that can be used to predict future patterns in data. A comprehensive introduction to ANNs can be found in [4].
2.2 Feed-forward Back-propagation Neural Network
In a “Feed-forward” Neural Network, each neuron in a given layer is connected to all other neurons in the next layer. No connections are allowed in the backward direction. This type of ANN is made up of a series of layers including input layer, optional hidden layer(s) and an output layer.
To present a pattern to the NN, the input layer is used as the channel. Each input to the NN represents a variable that has influence on the output of the Network in one way or the other. The number of input neurons is dependent on the task at hand.
The number of hidden layers will be determined by the complexity of the task that is to be carried out by the ANN. In practice, using one hidden layer and a reasonable number of neurons should be able to estimate the problem at hand. For continuous functions, two hidden layers may be sufficient, but apart from slowing down the training process, it also has the potential to worsen the problem of local minima [6]. Using few hidden neurons than required will result in under-fitting; a situation where it becomes difficult to accurately detect the signals in a complicated data set. On the other hand, using more hidden neurons than required will result in over- fitting and prolong training time. Researchers have proposed a compromise; the number of hidden neurons must be as specified in [7]:
• 2/3 the size of the input layer plus the size of the output layer,
• Less than twice the size of the input layer.
The output layer presents a pattern to the external environment. Its value(s) is/are dependent on factors such as the inputs, weights, thresholds and the error value. The number of output neurons is determined by what it is intended to be used for. For the Feed-forward process, an activation function is used to scale the output of the NN to the desired ranges.
“Back-propagation” is one of the methods that can be used to train this type of ANN. Training involves providing the NN with initial data to enable it to establish a pattern as it executes this data. Establishing a pattern during execution of the training set is referred to as learning by the Neural Network. Learning involves adjusting the weights and biases of the neurons, these weights are randomly generated and in most cases lies between -1 and 1.
There are two main methods of training; supervised and unsupervised training. In supervised training, the NN is provided with training data (training set) and the anticipated outputs (target values). This permits the NN to adjust the values in the weight matrix with respect to the differences between the anticipated output and the actual output. The difference between the actual NN output and the anticipated output forms the output error. It is then used to calculate the Root Mean Square (RMS) error which acts as the global rate of error for the entire neural network. Back-propagation is a form of supervised training. One advantage of Back-propagation is that, it can be used with any Feed-forward network that uses an activation function that is differentiable.
In unsupervised training, anticipated outputs are not provided to the NN during training, but the NN is allowed to train on the test data and learn the necessary pattern that is required. To generate errors for this type of training, consideration is made of the degree to which each output neuron fires for the input data.
Learning rate and momentum values are required for FBNNs. They are usually percent values and practically lie around a value of one. The Learning rate determines how fast the NN is expected to learn with the momentum specifying how much the current training iteration must depend on the previous iteration.
2.3 Related Work
[8], [9], [10] and [11] have a comprehensive review on factors leading to customer preference of a given mobile service. Most of them used statistical analysis to determine the accuracy of their study. On the other hand, [12], [13], and [14] used Neural Networks to predict customer churn based on given factors. This study however, seeks to predict potential customer’s preference for a mobile service using Feed-forward Back-propagation neural network architecture.
3 Methodology 3.1 Data Collection
A questionnaire was used to collect data from two hundred and forty people in the Brong-Ahafo Region of Ghana. A convenience sampling technique was employed to administer the questionnaires to the respondents. This was necessary because we were dealing with a mobile population. Respondents were to select the factor(s) that led to their use of a given MCSP as their Service Provider; numerous literatures exist on likely factors that determine customer preference for mobile service providers [13], [15], and [16]. These include;
• Moderate Tariff/Billing for calling (Per second or per minute) or SMS.
• Terms of Payment (Prepaid or Postpaid).
• Promotions (e.g. Bonus on recharge, etc.).
• Reliability (Guarantee that a call in progress will not terminate).
• Clarity of Network calls (no interference or crosstalk).
• Other people (relatives and friends) on the same Network.
• Demography (Network Coverage).
• Operator services either 2G or 3G.
• Familiarity of operator services (Brand Image).
• Activation of Operator services (How Easy).
• Good Customer Care (How operators treat their customers).
• Easy Access to Recharge Credit.
• Easy SIM card replacement procedure.
• Unlimited Internet, Data, and Multimedia usage.
• Availability of Money Transfer services.
• Ability to Pay Bills e.g. Electricity, Health Insurance, Water, etc.
• Ability to port mobile number.
• Ability to Roam.
• Availability of Security (call blocking, call tracking) and Help line services.
• Price of SIM card.
3.2 Creating the Network
A Feed-forward Back-propagation Neural Network implemented in MATLAB was used to train, validate and test the data. The NN structure consists of input layer, hidden layer and an output layer.
Input Layer: The input layer has 20 neurons, representing the twenty factors listed in section 3.1. Each of these
factors is considered as independent variables that has influence over the output of the NN.
Hidden Layer: There are guidelines to selecting the number of hidden layers and neurons per layer [17], [18].
Selecting a given number of layers depends on the function or decisions the NN is expected to execute/make, but in most situations one hidden layer will suffice. For purposes this study wants to achieve, one hidden layer with 13 neurons was used. This was arrived at upon trial and error, until the best result was obtained.
Output Layer: One output layer with one neuron was used corresponding with either the respondent uses MTN
or a
different network. A 1 output implies that the respondent uses MTN as his/her mobile service provider (MSP) and a 0 output imply the respondent uses a different network.
Fig. 2. shows the architecture of the Feed-forward Back-propagation Neural Network used in this paper.
3.3 Training the Network
Weights of connections between the neurons are randomly generated and lies between -1 and 1. These weights are continuously adjusted during training until the overall error falls within an acceptable limit. Supervised training was used with the Levenberg-Marquardt algorithm [19] for Back-propagation during training. This
algorithm is fast and efficient although it has memory limitations. The sigmoid activation function was used since it is differentiable as required by Back-propagation. Since it is supervised training, the network is supplied with the outputs
for the test data to enable it learn and calculate the error. A total of 240 values were used in this problem. The data (both input and target/ideal) was randomly divided into three sets as follows:
• 60% for training,
• 20% for validating the network result during generalization and to stop training before over-fitting occurs.
• 20% used as independent test to the quality of the network’s generalization.
4 Results and Discussion
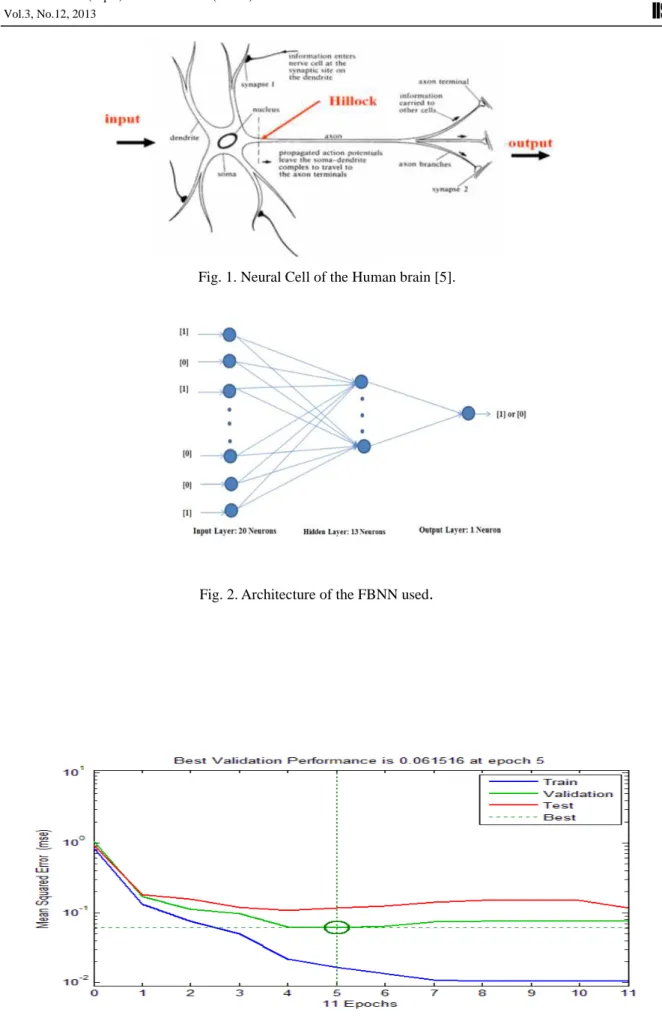
Training started on the data and stopped when the validation error increased for six iterations, which occurred at iteration 11.
Fig. 3 shows a plot of the training, validation, and test errors. The test and validation set errors have similar characteristics. No significant over-fitting occurred and at the same time, the final mean square error was small. Fig. 4.a. depicts a final low value of gradient plot indicating that the network is learning effectively; hence adjustments in the weights and biases are done in a more efficient way. This prevents the network from the likelihood of making false predictions.
Fig. 4.b. depicts the value of µ at the 11th epoch. µ is a parameter in the Levenberg-Marquardt algorithm for Back-propagation training. The aim is to decrease µ at every step since when µ reaches zero, it is just Newton’s method which is faster and accurate near an error minimum. The validation plot (Fig. 4.c.) shows the region where the network learned enough and passed validation effectively. The region where the failures cross the specified boundary is the stopping point for training and shows the beginning of the scenario called over-fitting of the data.
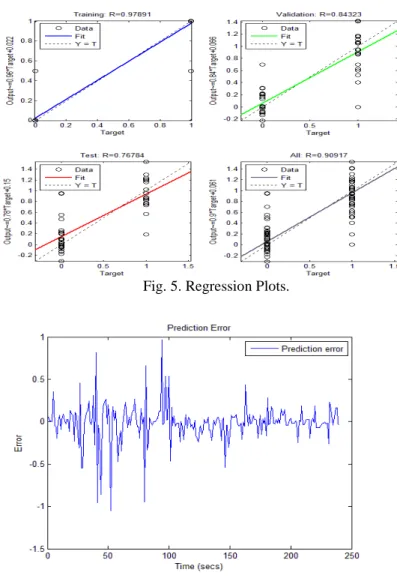
Fig. 5 shows the regression plots for training, validation, and testing phases as well as for the entire process. In other words, the regression plots are used to show the network’s output with respect to training targets. A perfect fit would mean that network output values are exactly equal to target values, and in such cases, the data would fall perfectly along the 45 degrees line with a regression value of 1. For this study, an overall fit of 0.9017 for the entire network was achieved, although individual fits for each dataset were slightly below that of the entire network. The network was retrained severally in trying to reach results that are desirable as much as possible. After changing the initial weights and biases through retraining, an improved network results was obtained as depicted in Fig. 5.
Finally, Fig. 6 shows the error that occurred during prediction. It can be seen that this error decays with time, hence increasing the probability that the NN’s predictions will be accurate. The fluctuation of the residuals about a fixed point justifies how well the residuals of the network behave.
The FBNN was simulated and outputs obtained were an approximation of the target values in all the datasets. These simulated network outputs are shown in Appendix A. It can be seen that these values are not very different from the target values, an indication that the neural network performed creditably well in predicting the validation and test outputs.
5 Conclusion and Future Work
In this paper, it has been put in evidence the ability and applicability of FBNN to predict customer’s preference to a mobile service. We have successfully used customer data on existing service provider to predict the parameter mentioned for new service providers, thus dispelling the myth of cost surrounding the acquisition of new customers for mobile service providers. This study will help both new and old service providers to recognize the aspects of their services that will attract new customers in order to help them stay in business. As future direction, we intend to use FBNN to predict customer choice among 5 MCSPs based on available service packages.
References
[1] Anuj Sharma and Prabin Kumar Panigrahi,2011: A Neural Network based Approach for Predicting
in Cellular Network Services, International Journal of Computer Applications, Volume 27– No.11, Information Systems Area, Indian Institute of Management, Indore, India., pp. 26-31.
[2] Baesens, B., Viaene, S., Van den Poel, D., Vanthienen, J., & Dedene, G.,2002: Bayesian neural network
learning for repeat purchase modeling in direct marketing. European Journal of Operational Research, 138(1), pp. 191–211.
[3] Shepherd, G.M. and Koch, C.,1990: Introduction to synaptic circuits, The Synaptic Organisation of the
Brain, G.M. Shepherd, Oxford University Press, New York, pp. 3 – 31.
[4] Ben Krose and Patrick van der Smagt, 1996: An Introduction to Neural Networks, Eighth edition, University of Amsterdam, pp. 13-131.
[5] Chakraborty R.C., 2010: Fundamentals of Neural Networks, AI Course Lecture 37-38.
Website:http://www.myreaders.info/html/artificial_intelligence.html. Date accessed: 15th July 2013.
[6] Daniel Svozil, Vladimir KvasniEka , JiE Pospichal, 1997: Introduction to multi-layer feed-forward neural networks, Chemometrics and Intelligent Laboratory Systems,Vol. 39,pp. 43-62.
[7] Jeff Heaton, 2008: Introduction to Neural Networks with C#, Second Edition, Heaton Research, Inc.St.
Louis, pp. 153.
[8] Rajkumar Paulrajan and Harish Rajkumar, 2011:Service Quality and Customers Preference of Cellular
Mobile Service Providers, J. Technol. Manag. Innov., Volume 6, Issue 1, pp. 38-45.
[9] Sabbir Rahman, Ahasanul Haque, Mohd Ismail Sayyed Ahmad, 2011:Choice Criteria for Mobile
Telecom Operator: Empirical Investigation among Malaysian Customers, International Management Review, Vol. 7 No.1, pp. 50-57.
[10] Charles Ofwona, 2007: Factors Which Determine Individual Consumer Choice Of Mobile Telephone
Service Providers In The City Of Nairobi, Project submitted forMaster of Business Administration, School of Business, University of Nairobi, pp. 29-42.
[11] Sabbir Rahman, Ahasanul Haque and Mohd Ismail Sayyed Ahmad, 2010: Exploring influencing factors
for the selection of mobile phone service providers: A structural equational modeling (SEM) approach on Malaysian consumers, African Journal of Business Management Vol.4 (13), pp. 2885-2898.
[12] Mehdi Fasanghari and Abbas Keramati, 2011: Customer Churn Prediction Using Local Linear Model Tree for Iranian Telecommunication Companies, Journal of Industrial Engineering, University of Tehran, Special Issue, 2011, PP. 25-37.
[13] Anuj Sharma, Prabin Kumar Panigrahi, August 2011: A Neural Network based Approach for Predicting
Customer Churn in Cellular Network Services, International Journal of Computer Applications, Volume 27– No.11, pp. 26-31.
[14] Ali Tamaddoni Jahromi, 2009: Predicting Customer Churn in Telecommunications Service Providers, Master Thesis Department of Business Administration, Lulea University of Technology, pp. 1-81.
[15] Charles Ofwona, September 2007: Factors Which Determine Individual Consumer Choice Of Mobile
Telephone Service Providers In The City Of Nairobi, School of Business, University of Nairobi, pp. 40-42.
[16] Sabbir Rahman, Ahasanul Haque, Mohd Ismail Sayyed Ahmad, 2011: Choice Criteria for Mobile
Telecom Operator: Empirical Investigation among Malaysian Customers, International Management Review, Vol. 7 No. 1, pp. 50-57.
[17] Jeff Heaton, 2008: Introduction to Neural Networks with Java, Second Edition, Heaton Research, Inc.St. Louis, pp. 159.
[18] Makinde F. A., Ako C. T., Orodu O. D. and Asuquo I. U., 2012: Prediction Of Crude Oil Viscosity Using Feed-Forward Back-Propagation Neural Network (FFBPNN), Petroleum & Coal 54 (2) 120-131, pp.120-131. www.vurup.sk/petroleum-coal. Date accessed 17th July 2013.
[19] MathWorks 2013: Neural Network Toolbox, Function Approximation and Nonlinear Regression,
Levenberg-Marquardt Back-propagation. http://www.mathworks.com/help/nnet/ref/trainlm.html. Date accessed 20th July 2013.
Fig. 3. Training, Validation, Test errors.
Fig. 2. Architecture of the FBNN used
.
Fig. 1. Neural Cell of the Human brain [5].Fig. 4. Training and Validation statistics.
Fig. 5. Regression Plots.
APPENDIX
:
FBNN SIMULATED RESULTS COMPARED WITH TARGET OUTPUTSTarget Actual Target Actual Target Actual Target Actual Target Actual
1 0.9486 0 -0.0169 1 1.2400 1 0.5694 0 0.0068 0 -0.0089 1 0.8720 1 1.0007 1 0.8774 1 0.9582 0 0.0005 0 0.0574 0 0.0528 1 1.0483 1 1.0110 0 0.0005 0 0.4723 1 1.2125 1 1.0483 1 0.8146 1 0.6445 0 0.2092 0 -0.0077 0 0.0267 0 0.0690 0 0.0519 0 0.1096 1 0.9191 1 1.0175 0 0.0690 0 0.0612 0 0.3486 1 1.0748 1 0.9264 0 0.0690 1 1.1924 0 0.0411 1 0.9452 0 -0.0240 0 0.0681 1 1.0004 1 0.8917 0 -0.0222 0 -0.0240 1 1.0437 1 0.9265 1 0.7697 0 0.0638 1 0.9834 0 0.0171 0 0.0951 1 0.8686 0 0.0360 0 0.1923 1 1.0169 0 -0.0240 1 1.0710 0 0.0936 1 1.0050 1 1.0077 1 0.9069 0 -0.0504 1 0.9830 0 -0.0723 1 1.0256 0 -0.0079 0 0.0432 0 0.1568 1 1.1485 1 1.0200 0 0.0301 0 -0.0509 0 0.1931 1 0.9656 0 0.2624 0 -0.0256 1 0.8720 0 0.2373 1 1.0306 1 0.7734 0 -0.0269 1 0.8679 1 1.0762 1 0.9530 1 0.8536 1 1.1121 1 0.7313 1 1.0514 0 0.1676 0 -0.0173 0 -0.1327 1 0.9531 1 1.1505 1 0.7169 1 1.0440 0 -0.0874 1 1.0607 0 0.0826 0 0.0359 0 -0.0455 1 0.9279 0 0.0610 0 -0.0262 1 1.0282 0 -0.1615 0 0.2349 1 1.1986 1 1.0108 1 0.8196 0 -0.1615 1 0.8869 1 0.8430 1 1.0108 0 -0.1304 1 1.0236 1 0.9303 0 0.0287 1 0.9491 1 1.0232 0 0.0420 1 1.1537 1 0.9448 0 0.0976 1 1.0297 0 0.3092 0 0.9448 0 0.0976 0 -0.0219 1 0.5465 1 0.3372 1 1.2252 0 0.0208 0 0.5465 0 0.3372 1 1.0545 1 0.9634 0 0.5465 0 0.3372 1 0.9860 0 0.0204 0 0.0125 1 0.9509 0 0.0452 1 0.8509 0 -0.0125 0 0.0027 1 0.9700 0 -0.0744 1 0.9057 1 1.0451 0 -0.0513 0 -0.0744 0 -0.1303 0 0.0014 1 0.9641 1 0.8626 1 0.7572 0 0.0014 1 1.0325 0 0.0440 0 -0.0084 0 0.0014 0 0.2264 0 0.0440 0 0.0367 1 0.9577 1 0.9905 0 0.0440 0 -0.0604 0 -0.0367 1 0.9553 1 0.9781 0 -0.3098 1 0.8730 1 1.5361 1 0.9599 0 0.2736 1 0.8737 0 0.0448 0 0.0173 1 0.1862 1 0.0351 0 0.0448 0 0.0173 0 0.9544 0 0.0351 1 1.3032 0 0.0173 0 0.0417 1 1.0232 0 0.1431 1 0.9915 0 0.1561 1 0.4618 1 0.9223 1 1.0034 0 0.8636 1 0.9858 0 -0.0549 0 0.2445 0 -0.0234 1 0.9762 0 -0.0549 1 0.9811 0 -0.1783 1 0.4640 0 -0.0549 0 -0.0020 1 0.7734 0 0.4640 1 0.9186 1 0.8155 1 0.7368 1 0.8315 1 0.9891 0 0.0338 1 1.0234 1 1.0463 0 0.0511 0 0.0338 1 0.7995 0 -0.0689 0 0.0511 1 0.9920 0 -0.0254 1 1.0571 1 1.0232 0 -0.0225 0 1.0486 0 0.0184 0 0.2133 0 -0.0225 0 -0.0433 0 0.0184 1 1.0024 0 -0.0225 0 -0.1794 0 0.0184 0 0.0599 0 0.1962