Digital Commons@Georgia Southern
Electronic Theses and Dissertations Graduate Studies, Jack N. Averitt College of
Spring 2017
Asymmetric Membranes for High Capacity Lithium-Ion
Battery Electrodes
Ian Byrd
Follow this and additional works at: https://digitalcommons.georgiasouthern.edu/etd
Part of the Materials Chemistry Commons, and the Polymer Chemistry Commons
Recommended Citation
Byrd, Ian. Asymmetric Membranes for High Capacity Lithium-Ion Battery Electrodes. Georgia Southern University, Statesboro, Georgia, 2017.
This thesis (open access) is brought to you for free and open access by the Graduate Studies, Jack N. Averitt College of at Digital Commons@Georgia Southern. It has been accepted for inclusion in Electronic Theses and Dissertations by an authorized administrator of Digital Commons@Georgia Southern. For more information, please contact digitalcommons@georgiasouthern.edu.
ASYMMETRIC MEMBRANES FOR HIGH CAPACITY LITHIUM-ION BATTERY ELECTRODES
by
IAN C. BYRD
(Under the Direction of Ji Wu)
ABSTRACT
Lithium-Ion Batteries (LIBs) have broad applications such as portable electronic devices, electric vehicles, and for green energy storage from intermittent sources. Current LIBs are limited by their low capacity materials at both the anode and cathode. At the anode, graphite suffers from a low
capacity of only 372 mAh g-1. The most commonly used cathode material is LiCoO2 which has a
meager capacity of 140 mAh g-1. Thereby the broader applications of LIBs are limited due to these
low capacities. It is imperative to develop higher capacity materials to further improve the performance of LIBs. Silicon is an ideal candidate to replace commercial anode materials due to
its high theoretical capacity of 4200 mAh g-1 and vanadium pentoxide (V
2O5) is a leading candidate
for cathodes with an impressive capacity of 294 mAh g-1when two lithium ions are inserted per
V2O5 unit. Unfortunately, silicon suffers from an extreme volume expansion of ~300% upon
charging. This causes the material to crack leading to permanent capacity loss. V2O5 also suffers
from some volume expansion issues, but the biggest obstacle to overcome is its low electrical conductivity and ion diffusivity. Herein, we report the fabrication of composite single, double, and triple-layer asymmetric membranes containing micron size silicon as anode materials and
single-layer asymmetric membranes containing V2O5 as cathode materials. Anodes fabricated with an
88% capacity retention at 0.5 C. Cathodes demonstrate a capacity of over 160 mAh g-1 with ~100% capacity retention at 0.5 C in 380 cycles. It is found that the choice of conductive additives and
annealing temperature can have a significant effect on V2O5 particle morphology and cycling
performance. Lower annealing temperatures and the addition of conductive graphene are shown to be beneficial to improving cycling performance. This scalable method may provide a universal answer for other anode and cathode materials with volume expansion issues.
KEY WORDS: Lithium-ion batteries, Silicon, Vanadium pentoxide, Asymmetric membranes, High capacity
ASYMMETRIC MEMBRANES FOR HIGH CAPACITY LITHIUM-ION BATTERY ELECTRODES
by
IAN C. BYRD
B.S., Georgia Southern University, 2011
A Thesis Submitted to the Graduate Faculty of Georgia Southern University in Partial Fulfillment of the Requirements for the Degree
MASTER OF SCIENCE
© 2017
IAN C. BYRD
ASYMMETRIC MEMBRANES FOR HIGH CAPACITY LITHIUM-ION BATTERY ELECTRODES
by
IAN C. BYRD
Major Professor: Ji Wu
Committee: Donald McLemore Rafael Quirino
Electronic Version Approved: May 2017
DEDICATION
This thesis is dedicated to my parents, Jeffrey P. Byrd and Lisa A. Byrd, for their unwavering support and showing me the importance of hard work and dedication;
To all of my mentors for challenging me to make the most out of myself at all times;
To my girlfriend, Jade Boykin, who has been with me every step of the way and has supported me throughout this whole project,
ACKNOWLEDGEMENTS
I would like to acknowledge Georgia Southern University and the Chemistry Department for allowing the use of their facilities. I would also like to acknowledge the Master of Science in Applied Physical Science program within the College of Graduate Studies at Georgia Southern University for their tuition waiver and graduate teaching assistantship funding. In addition, I would like to recognize both the Graduate Student Organization and the College of Science and Mathematics at Georgia Southern University for their support of my research through research grants I received. I want to thank the Student Government Association and the Graduate Student organization for the funding I received to support travel to conferences to present my research. I want to thank Dr. Ji Wu for all his guidance as I progressed through this master’s program. I would also like to thank other students who have helped me in the lab throughout my project including: Ryan Bujol, Tyler Camp, Theron Webber, and Shavonne Lovelace. I want to recognize Kathleen McCormac for all her help when I was an undergraduate getting started in my research journey. Also, I want to thank the faculty at Georgia Southern for their help including Dr. Hao Chen for his help with the SEM-EDS, Dr. Nathan Takas for help with various instruments, and Dr. Don McLemore for help with the TGA. I acknowledge help I received from Dr. Clifford Padgett at Armstrong State University for his assistance with Powder X-Ray Diffraction. Lastly, I would like to acknowledge my collaborators at other institutions such as: Jianlin Li at Oak Ridge National Laboratory and Congrui Jin, Anju Sharma, and Hanlei Zhang at Binghampton University.
TABLE OF CONTENTS
Acknowledgements ...3
List of Tables ...6
List of Figures ...7
Chapter 1: Introduction ...9
1.1Brief History of Lithium-Ion Batteries ...9
1.2Applications of Lithium-Ion Batteries ...10
1.3How Does a Lithium-Ion Battery Function? ...11
1.4Advantages and Limitations of Current Rechargeable Lithium-Ion Batteries ...13
1.5Silicon as Anode Material for Second-Generation High Capacity Lithium-Ion Batteries ...15
1.6Vanadium Pentoxide as a High Capacity Cathode for Lithium-Ion Batteries ...21
1.7Vanadium Pentoxide Lithium-Ion Kinetics ...22
1.8Current Research Status of Vanadium Pentoxide Lithium-Ion Battery Cathode...24
1.9Brief History of Asymmetric Membranes and Their Formation Mechanisms ...26
1.10Our Proposed Hypothesis and General Experimental Design ...28
Chapter 2: Asymmetric Membranes Containing Micron Size Silicon as Anode Material for High Capacity Lithium Ion Batteries ...30
2.1Introduction ...30
2.2Experimental ...31
2.2.1Synthesis of single-layer asymmetric membranes containing micron-size silicon ...31
2.2.2Synthesis of double-layer asymmetric membranes containing micron-size silicon ...32
2.2.3Synthesis of triple-layer sandwich asymmetric membranes containing micron-size silicon ...32
2.2.4Synthesis of asymmetric membranes without silicon for control ...32
2.2.5Characterization ...33
2.2.6Electrode preparation and electrochemical analysis ...34
2.3.1Characterization ...35
2.3.2Electrochemical Analysis ...42
2.4Conclusion ...48
Chapter 3: Reinvigorating Reverse Osmosis Membrane Technology to Stabilize V2O5 Lithium-Ion Battery Cathode ...49
3.1Introduction ...49
3.2Experimental ...50
3.2.1Synthesis of V2O5 asymmetric membranes using a phase inversion method combined with sol-gel chemistry ...50
3.2.2Characterization of V2O5 asymmetric membranes ...51
3.2.3Electrochemical evaluation of asymmetric membranes as LIB Cathodes ...52
3.3Results and Discussion ...53
3.3.1Fabrication of V2O5 asymmetric membranes ...53
3.3.2Characterization of V2O5 asymmetric membranes ...54
3.3.3Electrochemical properties of V2O5 asymmetric membranes as LIB cathodes ...60
3.4Conclusion ...64
Chapter 4: Concluding Remarks and Future Outlook...65
LIST OF TABLES
Table 1: BET surface area of carbonized asymmetric membranes ...41
Table 2:Irreversible capacity loss (ICL) of carbonized asymmetric membranes ...45
Table 3:Simulated results of Nyquist plots using an equivalent circuit ...48
LIST OF FIGURES
Figure 1: Comparison of energy density of different batteries ...9
Figure 2: Pie charts comparing the current methods for grid energy storage ...11
Figure 3: Charging and discharging process schematic ...12
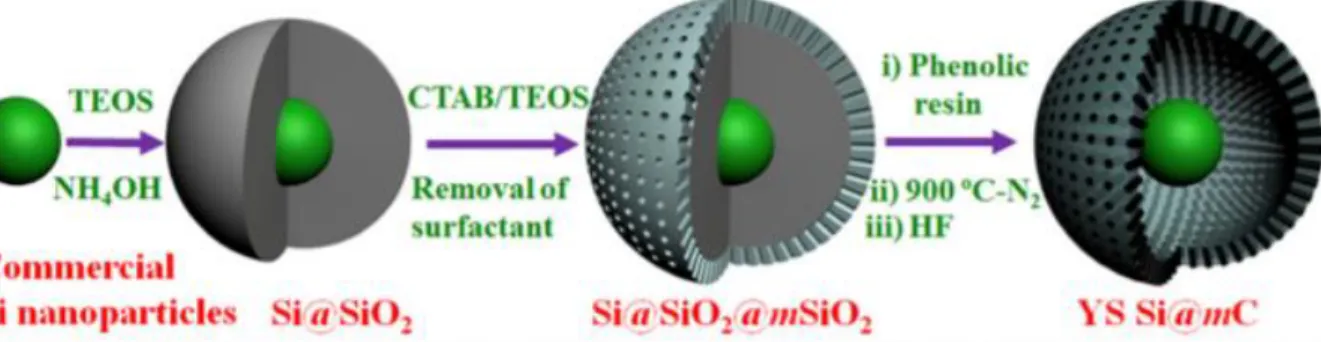
Figure 4: Synthesis of yolk-shell silicon encapsulated in mesoporous carbon coatings ...18
Figure 5: Comparison of traditional polymer binders to self-healing binders ...19
Figure 6: Schematic diagram for the fabrication of Si MPs via the mechanical pressing of nano-Si@SiO2 clusters ...20
Figure 7: Layered structure of V2O5 ...24
Figure 8: Cycling performance of different mass loadings of V2O5 ...26
Figure 9: Ternary phase diagram for the phase inversion process ...27
Figure 10: SEM cross section of different types of asymmetric membranes ...28
Figure 11: General experimental design for the synthesis of CA/PAN/Si/CA asymmetric membranes ...33
Figure 12: Equivalent circuit used to fit EIS measurements...35
Figure 13: Electron Microscope characterizations and size distribution of SiMPs ...36
Figure 14: SEM cross sections of all PAN/Si asymmetric membranes ...37
Figure 15: High resolution scanning electron microscope image of the interface in double-layer asymmetric membrane containing Si MPs. ...38
Figure 16: Raman spectra and PXRD patterns of carbonized membranes ...39
Figure 17: Thermogravimetric analysis of carbonized membranes ...40
Figure 18: BET surface area and BJH pore size anaysis ...41
Figure 19: a) Cycling performance of CA/PAN/Si/CA membrane and b) cycling performance of all batteries assembled ...44
Figure 20: SEM images of a) as-prepared and b) carbonized single-layer asymmetric membrane containing Si MPs ...45
Figure 21: Various electrochemical analysis of batteries assembled with asymmetric membranes ...47
Figure 23: a) Photo of V2O5 asymmetric membrane prior to carbonization;
b) cross-sectional SEM image of the uncarbonized V2O5 asymmetric membrane ...54
Figure 24: SEM images of all V2O5 asymmetric membranes...55
Figure 25: SEM image of V2O5 micron-particles ...56
Figure 26: High-Resolution TEM images of carbonized V2O5 membranes ...56
Figure 27: a) Raman spectra and b) Powder X-Ray Diffraction of all membranes ...57
Figure 28: X-ray photoelectron spectroscopy spectra of various V2O5 membranes ...58
Figure 29: Thermogravimetric analysis of various V2O5 membranes ...59
Figure 30: a) cycling performance of V2O5 cathodes and b) C-rate performance of V2O5 cathodes with standard error bars. ...61
Figure 31: Voltage profiles of: a) V2O5 EO-300 CB and b) V2O5 EO-300 GH ...62
Figure 32: Cyclic voltammetry of a) V2O5 EO-300 CB and b) V2O5 EO-300 GH ...63
CHAPTER 1: Introduction
1.1. Brief History of Lithium-Ion Batteries
Lithium-Ion Batteries (LIBs) were first commercialized by Sony in 1991. The first LIBs
consisted of a graphite anode (negative electrode) and a LiCoO2 cathode (positive electrode) with
a membrane separator to keep the anode and cathode from touching, as well as a lithium ion conducting electrolyte. This configuration in commercial rechargeable lithium ion batteries has
remained largely unchanged since its invention.1 During charging, lithium ions are inserted into
the anode while simultaneously being extracted from the cathode without causing any permanent structural changes. LIBs possess many advantages over other traditional types of batteries such as lead acid or alkaline batteries. One leading advantage is its higher energy density over most other
types of batteries. Commercial LIBs can have a specific energy of up to 120-150 W h kg-1, which
is much greater than that of lead acid batteries (20-40 W h kg-1).2 This much improved energy
density allows for a battery to supply the same amount of energy with a significantly smaller mass. Likewise, a battery of the same mass will deliver a much greater amount of energy (Figure 1).
Figure 1: Comparison of energy density per kg and per L of different types of battery systems.
1.2. Applications of Lithium-Ion Batteries
LIBs have a wide range of applications from electric vehicles to portable electronic devices and even large scale energy storage from intermittent energy sources such as solar and wind
power.3 Currently, the largest market for LIBs is the portable electronics sector. However, in the
future the electric vehicle market is expected to experience the biggest expansion by the year
2020.4 The demand for electric vehicles will likely continue to increase as fossil fuels are
non-renewable and may cause many social, health, environmental and climate detriments, thus forcing society to look for a greener alternative to the internal combustion engine in automobiles.
Consequently, the total market for LIBs is projected to reach $46.21 billion by 2022.4 Another use
for LIBs is in energy storage for intermittent power sources such as solar and wind power.5 In
these applications, batteries are used to store the energy generated so that it can be used at a later time. It is reported by the Department of Energy (DOE) that the pumped hydroelectricity accounts for 95% (23.4 GW) of this energy storage (Figure 2). The other 5% is stored via thermal storage (36%, 431 MW), compressed air (35%, 423 MW), batteries (26%, 304 MW), and flywheels (3%,
40 MW).6 If LIB capacity and performance can be improved significantly without cost increase,
there is a great potential to store large amounts of energy in a small area, thus giving them an advantage over the currently dominating hydroelectric energy storage.
Figure 2: Pie charts comparing the current methods for grid energy storage.6
1.3. How Does a Lithium Ion Battery Function?
A rechargeable (secondary) LIB has three main components: an anode (negative electrode), a cathode (positive electrode), and a separator membrane to keep the battery from short circuiting. There is also a Li-ion conducting electrolyte dissolved in organic solvents such as ethylene carbonate, diethyl carbonate, and dimethyl carbonate. The most common lithium salt used as the electrolyte is LiPF6. The anode and cathode materials are cast onto a current collector. At the
anode, the current collector is usually made of copper thin film while aluminum foil is commonly employed as the cathode current collector. In a full cell battery, the lithium source is at the cathode. When a battery is being charged, the Li-ions migrate from the cathode to the anode. At this point, the cathode is being oxidized and undergoes the following electrochemical reaction:
𝐿𝑖𝐶𝑜𝑂2 → 𝐿𝑖1−𝑥𝐶𝑜𝑂2+ 𝑥𝐿𝑖++ 𝑥𝑒−(half-cell potential: 1 V)7
When the cathode is being oxidized, the anode is simultaneously undergoing a reduction as shown by the following reaction:
Both of these reactions combined gives the overall redox reaction in a LIB8: 𝐿𝑖𝐶𝑜𝑂2+ 𝐶6 ↔ 𝐶6𝐿𝑖 + 𝐶𝑜𝑂2 (full-cell potential: 4 V)7
It is notable that all the half-cell potentials shown above are relative to standard hydrogen electrode
(SHE). The general schematic for the function of a LIB is seen in Figure 3.9 This figure shows
LiFePO4 as the cathode material, but the general function is still the same as a LiCoO2cathode.1
When Li-ions are released from the solid matrix of the cathode, the electrons flow through an external circuit creating a current flow to the anode. When the Li-ions reach the anode, they can be inserted between graphite sheets which have an interlayer spacing of 3.35 Å. It takes six carbon
atoms to hold one Li-ion which corresponds to a capacity of 372 mAh g-1.10 Upon discharging the
reactions are flipped. Oxidation occurs at the anode and results in the release of lithium ions. These lithium ions can migrate towards the cathode under the internal electrical field and are eventually intercalated into the crystal structure of the cathode material.
Figure 3: A general schematic demonstrating the charging and discharging processes in a typical
LIB cell. Reprinted with permission from reference 9. Copyright 2014, Royal Society of Chemistry.
1.4. Advantages and Limitations of Current Rechargeable Lithium Ion Batteries
LIBs are superior to other types of rechargeable batteries in a few ways. The major advantage is energy density. Energy density can be defined as the amount of energy stored per unit
volume or per unit mass. LIBs have a specific energy of 120-150 W h kg-1 which is roughly two
to three times greater than Nickel-Cadmium batteries.2 This higher specific energy allows for more
energy to be stored in a smaller area which is especially desirable for electric vehicles and portable electronic devices. Another major benefit of LIBs is their high operating voltage. The operating voltage of a full cell LIB is equal to the electrode potential of the cathode minus the electrode
potential of the anode.11 A typical LIB has an operating voltage of up to 4.0 V. Compared to the
voltage of Nickel-Metal Hydride and Nickel-Metal Cadmium batteries (1.2 V), LIBs deliver a
voltage over three times greater.12 This means it would take three Nickel-Metal Hydride batteries
connected together to deliver the same voltage as only one LIB does. In other words, LIBs have a much higher power output than their Nickel counterparts.
There are also a few drawbacks to using LIBs. The major concern regarding the use of
LIBs is safety. Flammability of the LiPF6 electrolyte dissolved in an organic solvent is one of the
main concerns for LIB safety.13 Aside from the flammable solvent, LIBs are also very sensitive to
high temperatures. They are not very efficient at dissipating heat. The potential range of 4 V in LIBs is much greater than the thermodynamic stability window for both anode and cathode
materials.14 When a battery is being charged and discharged, there are some exothermic side
reactions that occur between the anode, cathode, and electrolyte. These reactions result in a temperature increase inside the cell. This increase in temperature then causes the reaction rates to increase and thus creating an even higher temperature. This phenomenon is known as thermal
temperature of a cell is determined by the heat balance between the amount of heat lost and the amount of heat dissipated. If a cell cannot effectively dissipate heat, then thermal runaway is set
to occur.16 Thermal runaway is especially dangerous in electric vehicles and plug in hybrids
because they utilize large amount of smaller cells connected together in circuit. Thermal runaway in one battery cell can release enough heat to cause neighboring cells to reach a temperature at
which thermal runaway can occur.17
In addition to safety concerns, current LIBs suffer from a relatively low capacity. In order for electric vehicles to replace traditional internal combustion engine vehicles, the range of electric vehicles needs to be vastly improved. As mentioned above, most commercial LIBs use graphite
anode and LiCoO2 cathode. Although graphite is a very stable material that can be cycled
thousands of times with minimal capacity fade, it suffers from an intrinsically low capacity of 372
mAh g-1 that is not enough to meet the demand of future all-electric vehicles as reported by DOE.3,
18-20 Graphite is ideal because Li-ions can insert into graphite’s layered structure with little volume
expansion and minimum internal stress. To satisfy the requirements for use in electric vehicles, other materials with much higher capacities need to be investigated for use in LIBs.
In addition to improving the capacity of the anode material, the cathode side cannot be overlooked. In order for a LIB to function properly the ratio between the capacity of the anode and the capacity of the cathode must be properly balanced. For LIBs the ideal capacity ratio of cathode
to anode is 1.1 to 1 to prevent lithium plating at the anode.21 The relatively low cathode capacity
will become a much bigger issue if the anode material is increased well above the current capacity in commercial LIBs, i.e., the adoption of high capacity silicon anodes. In order to balance the capacity, a much larger mass of cathode material must be added to match the anode. This can be done by increasing the thickness of the active material loading on cathode current collector sheets
or making the cathode current collector much larger in area. Both designs have negative outcomes in the overall electrochemical performance of the cell. If the electrode area is increased, the overall size of the battery will not be any smaller, thus lowering the overall areal energy density of the entire cell. If the thickness is too large, there will be a huge detrimental effect on the overall rate
capability, lithium ion diffusion, and the overall lifespan of the cell itself.22 It has been shown that
thicker electrodes show lower power density as well as a faster capacity fade.22-23 Jie Liu and his
collaborators conducted an experiment in which they compared the performance of full cell LIBs using two different cells, one cell with thick electrodes and another with thin electrodes. Their results back up their hypothesis and show that in cells with thick electrodes the temperature of the cell is much higher than that of the cell with thin electrodes. They attribute the higher temperature to the increased internal resistance of the cell as the result of the increased electrode thickness. As previously mentioned, the temperature increase may cause a battery to reach thermal runaway and
greatly decrease the overall safety of the cell.23
1.5. Silicon as Anode Material for Second-Generation High Capacity Lithium-Ion Batteries
There are a few other alternatives to using graphite as the anode material in LIBs. One of those is to use germanium powder. Germanium is attractive because of its high theoretical capacity
(1600 mAh g-1).18, 24 It also is much higher in conductivity than silicon and has a greater mechanical
strength. However, there are still extreme volume expansion issues to overcome and germanium
is much more expensive than silicon.18 Another promising alternative is tin dioxide (SnO
2). SnO2
has a theoretical capacity of 790 mAh g-1 but suffers from similar volume expansion issues.25 In
addition to volume expansion, SnO2 also has a huge irreversible capacity loss in the first cycle due
non-recyclable compound in LIBs. This consumes large amounts of lithium, further limiting its
practical use in LIBs.26
Silicon (Si) is a leading candidate to replace traditional graphite anodes due to its
theoretical capacity of 4200 mAh g-1 based on the fully lithiated form of Si
5Li22.3, 20, 27-29 However,
even though Si has a capacity over eleven times higher than graphite, it suffers from a massive
volume change of roughly 300% upon lithiation/de-lithiation.30 This volume expansion causes Si
particles to crack because it will generate extremely large electrode stress and Si has a poor mechanical strength. As a result, the electrode may peel away from the current collector leading
to a permanent capacity loss in only a few cycles.31 In order for Si to replace graphite, the extreme
volume expansion needs to be tamed. One of the most common methods to alleviating the trouble of volume expansion is to use nanoscale composite materials. The majority of research in literature on Si involves some sort of nanostructuring to allow Si to expand without losing capacity. These nanostructures include nanoparticles (NPs), nanowires (NWs), nanotubes (NTs), nano-thin films,
as well as mesoporous and macroporous materials.3, 21, 32-33 Nanomaterials are widely used due to
their unique physical and chemical properties. In the case of Si, nanoparticles are much more resistant to cracking because at small enough dimensions the mechanical strength of Si is improved
to the point where cracking will no longer occur upon lithiation/de-lithiation.27 In addition,
nano-sized Si particles are much more conductive than their micron-size counterparts due in large part to the decreased lithium-ion diffusion length and diffusion barrier. This is especially important
considering lithium ions have a much smaller diffusion coefficient in silicon than in graphite (~10
-10 vs. 10-6 cm2 s-1).3, 31
Wang et al. fabricated a binder-free three-dimensional silicon/carbon nanowire networks for high performance lithium-ion battery anodes via a wet etching method and chemical vapor
deposition (CVD) of carbon on the surface of the Si NWs. Once the Si NWs were fabricated, they were immersed in an ethanol solution and sonicated to adequately disperse them in solution. Si NWs were then allowed to precipitate into a thin film of Si NWs. The ethanol was evaporated and carbon was coated on the Si NWs via CVD. This creates the free-standing Si NW/C film used directly as a binder free anode material. The group was able to achieve an initial capacity of nearly
2500 mAh g-1, but the capacity is reduced to below 1500 mAh g-1 in 30 cycles. Even though the
capacity retention is poor, they are able to show that longer Si NWs can retain their capacity much better in 30 cycles. The group also milled some of their wires into shorter lengths. The results show that shorter wires have poorer electrochemical performance which is attributed to the lack of
continuous electron transport pathways.34
Yang et al. designed a creative yolk-shell silicon-mesoporous anode material. This yolk shell structure was formed by a multistep fabrication process that allows for a single Si NP to be encapsulated inside a mesoporous carbon shell with free space inside for Si to expand and contract without being leached out into the electrolyte. They were able to create 50 nm of free space between the outer shell and the Si NP embedded within. This unique structure leads to an impressive cycling performance (Figure 4). These yolk-shell structures were able to maintain a
capacity of around 1000 mAh g-1 for 400 cycles with little capacity loss. Though the capacity is
much lower than the theoretical value of 4200 mAh g-1, the stability is impressive. Although the
stability is impressive, creating the free space needed requires dangerous chemicals and difficult
Figure 4: Outline of the synthesis of yolk-shell silicon encapsulated in mesoporous carbon coatings. Reprinted with permission from reference 32. Copyright 2015, Elsevier.
There is significantly less research being conducted in the realm of micron-size Si than for nano-Si. One of the main benefits for using Si micron particles (Si MPs) is cost. In order to commercialize Si electrodes, the cost must be comparable to current LIB anodes. Currently, Si
NPs are around one order of magnitude more expensive than Si MPs.3, 35 This low cost makes Si
MPs much more economically feasible if the drawbacks in their performance can be overcome. Along with cost, there are other benefits of using Si MPs over Si NPs such as these larger particles
having a much higher tap density.29, 36
Yi Cui’s group at Stanford is one of few groups attempting to tackle the challenges that come with using Si MPs. His group has fabricated self-healing conductive polymers with low glass
transition temperatures (Tg) to replace traditional polymer binders used in commercial LIBs. Their
self-healing polymer allows for Si to expand and contract while still being held in good contact
with conductive additives as well as the current collector (Figure 5). The low Tg of the polymer
allows it to have elastomeric properties at room temperatures. Electrodes fabricated from these
self-healing polymers and Si MPs have an impressive initial capacity of around 2500 mAh g-1 as
is superior to current commercial binders, however their capacity is steadily decreasing over the
course of 120 cycles and needs to be improved for practical use.29
Figure 5: Comparison of traditional polymer binders to self-healing binders fabricated by Cui’s
group. Reprinted with permission from reference 29. Copyright 2013, Nature Publishing Group.
Cui’s group also published a paper using a mechanical pressing method and micron sized Si. This study is unique in that the authors state that they can produce large quantities of product (>20 g) with 95% yield. This leads them to conclude that their method is highly scalable. They produce Si MPs by starting with silica coated silicon nanospheres and using high pressure to press them into bulk sized pellets. These pellets were then ball milled to create particles with an average size of around 4.5 µm. Once the milling process is complete the particles were heated to 600°C for 2 hours to bridge neighboring particles together and ensure that they do not break off into smaller particles later on. Once the particles were heated they were then carbon coated and acid
reach an initial capacity of 1250 mAh g-1, 95% of which is retained after 1400 cycles at a charging rate of 1C. These results are compatible with what is needed for commercial batteries. However, both the silica and carbon coating processes require CVD which requires high temperatures and expensive precursor gases. Also, the etching process involves using HF, which is the most
dangerous and corrosive acid, further hindering its potential for large scale production.36
Figure 6: Schematic diagram for the fabrication of Si MPs via the mechanical pressing of
nano-Si@SiO2 clusters, ball milling into micron-size particles, and carbon coating with acid etching to
remove SiO2. Reprinted with permission from reference 36. Copyright 2015, Royal Society of
Chemistry.
Gao Liu’s group at the Lawrence Berkeley National Laboratory is also working with micron size Si. Their method involves an in situ formed network of Si MPs and Si NPs using a highly cross-linked conductive polymer binder. The idea is that they use the Si NPs as an additional conductive additive in the place of traditional conductive additives and make use of a polymer that is much more resistant to strain, particularly non-recoverable deformation. Even though a high
capacity of over 3000 mAh g-1 is achieved, there is only a 73% capacity retention after only 30
cycles. The capacity retention needs to be significantly improved in order to meet the needs of
1.6. Vanadium Pentoxide as a High Capacity Cathode for Lithium-Ion Batteries
Extensive work is being done to improve cathode capacity by using alternative high
capacity and low cost materials. LiCoO2 is the most commonly used cathode but suffers from a
low capacity (140 mAh g-1) and is costly to produce. The material with the highest capacity at the
cathode for LIBs is sulfur that has a theoretical capacity of 1672 mAh g-1.38 Sulfur is also cheap to
produce and is environmentally benign. However, sulfur has an extremely low electrical
conductivity and the dissolution of polysulfides in electrolytes can reduce its cycle life rapidly.39
There have been very few reports of high capacity cathodes using sulfur that have decent capacity retention over repeated cycling. There are other materials with lower capacities but much higher
cyclability than sulfur that could be used. One of the leading candidates is LiNiO2. LiNiO2 is both
lower in cost and higher in capacity than LiCoO2.40 Although it has some advantages, there are
also some limiting factors. The LiNiO2 structure is less ordered than LiCoO2 which causes Ni to
occupy some of the lithium sites and thus limits lithium ion diffusion.41
Vanadium Pentoxide (V2O5) is an attractive candidate to replace current commercial
cathodes in LIBs because of its high theoretical capacity of 294 mAh g-1 when two lithium ions
are intercalated into the layered structure of V2O5.42-43 This is much higher than the capacity for
current commercial cathode materials (LiCoO2: 140 mAh g-1; LiMn2O4: 148 mAh g-1; LiFePO4:
170 mAh g-1).42 Although V2O5 has a high capacity, it falls short in a few key categories. The
charging rate capability of bulk V2O5 is severely limited due to its low electron conductivity and
lithium ion diffusivity.44 Along with the low conductivity, V2O5 also experiences some volume
expansion issues similar to those seen with silicon at the anode. Recently, a few strategies have been employed to overcome these issues. These include the synthesis of nanoparticles (NPs),
reduced particle size can increase the ionic conductivity of V2O5 by dramatically reducing the
diffusion length so that the rate capability is more satisfying.
1.7. Vanadium Pentoxide Lithium-Ion Kinetics
The layered structure of V2O5 makes it an attractive alternative to commercial cathode
materials. The sheet-like structure of V2O5 is shown in Figure 7.47 A large spacing between the
sheets (4.368 Angstroms) allows for facile lithium insertion due to the small atomic radius of
lithium (1.67 Angstroms).48-49 Two lithium-ions can be reversibly inserted into the layered
structure of crystalline V2O5. It is possible for a third lithium ion to be inserted to reach a theoretical
capacity of 440 mAh g-1 when discharged to 1.9 V. But the lithium ion cannot be extracted and the
battery ceases to cycle.43, 50 This irreversible process can be avoided by cycling in a voltage
window above 1.9 V. The insertion of lithium ions can be explained through a series of reactions
that take place upon lithium insertion into crystalline V2O5. Lithium insertion gives way to five
phases of LixV2O5 (, , , , ), the last of which is the non-reversible phase. The initial phase
is formed when 1% of lithium is inserted into V2O5 sheets.48 The ε-phase (ε – Li0.5V2O5) is formed
when 0.5 Li-ion is inserted into one V2O5 unit on average as shown through the following reaction:
𝑉2𝑂5+ 0.5𝐿𝑖++ 0.5𝑒− ↔ 𝜀 − 𝐿𝑖0.5𝑉2𝑂5
This reaction can be observed at a potential of ~3.4 V. The exact voltage may vary from sample to sample depending on the electrode over-potential and solid electrolyte interphase (SEI) stability. At this point, there is minimal volume expansion that does not affect the reversibility. The next
phase formed is the δ-phase (δ – LiV2O5) when one Li-ion is inserted and is demonstrated through
the following reaction which is commonly observed at a potential of 3.1 V: 𝐿𝑖0.5𝑉2𝑂5+ 0.5𝐿𝑖++ 0.5𝑒− ↔ 𝛿 − 𝐿𝑖𝑉2𝑂5
This is the last fully reversible phase where V2O5 can be fully de-lithiated back to its original
pristine V2O5 form. At this point the reactions still do not affect the strong V-O bond. If insertion
is halted at this phase, the reversible capacity would be 147 mAh g-1, which is comparable to
commercial cathodes. However, commercial cathodes have much more satisfying capacity
retention over the course of many cycles.51 Once more than 1 lithium is inserted a transition to the
γ-phase (γ – Li2V2O5) will occur when the second lithium ion is inserted.48 The corresponding
chemical reaction is shown below:
𝐿𝑖𝑉2𝑂5+ 𝐿𝑖+ + 𝑒− ↔ 𝛾 − 𝐿𝑖2𝑉2𝑂5
The final transition occurs at a potential of ~2.3 V and corresponds to a reversible capacity of 294
mAh g-1. After this transition, the layered crystal structure starts to be puckered and generate
internal lattice strain, potentially leading to irreversible capacity loss if there is no extra protection.
As previously mentioned there is another phase that can be formed when V2O5 is cycled to
potentials below 1.9 V. This phase is called ω-phase (ω – Li3V2O5) corresponding to the third
lithium insertion. This phase has a rock-salt cubic structure as opposed to the original
orthorhombic structure for α – V2O5.52 This phase is also non-reversible because the lithium
diffusion coefficient is reduced from 3.3 x 10⁻⁹ cm2 s-1 when 2 lithium ions are inserted to 10-12
cm2 s-1 when a third lithium ion is inserted.48 The reaction for this transition is as follows:
𝐿𝑖2𝑉2𝑂5+ 𝐿𝑖++ 𝑒− → 𝜔 − 𝐿𝑖3𝑉2𝑂5
Upon de-lithiation, the reactions will happen in reverse order starting from the γ-phase back to the
Figure 7: Layered structure of V2O5. Note: the weak V-O bond is not shown in this diagram.
Reprinted with permission from reference 47.
1.8. Current Research Status of Vanadium Pentoxide Lithium-Ion Battery Cathode
Yun Xu et al. fabricated a two dimensional V2O5 sheet network for use as the cathode
material in LIBs. This group also fabricated manganese doped V2O5 sheets.42 It is believed that
these carbon coated two-dimensional nanosheets can increase lithium ion diffusion by providing a pathway for the lithium ions. The carbon coating serves the purpose of increasing the electrical conductivity of their 2D sheets, thus increasing its rate capability. The purpose of doping the sheets with manganese is to increase the electrochemical performance and increase electrical conductivity
even further. They are able to achieve a capacity based on the mass of V2O5 only of over 300 mAh
g-1 for the first cycle, but the capacity drops dramatically to ~200 mAh g-1 in the second cycle. In
the first 10 cycles, some capacity is regained but the capacity drops steadily over the course of only 50 cycles. The manganese doped electrodes show improved stability, but suffer from a lower
capacity. In order to be used in a commercial battery the stability needs to be greatly improved.42
James M. Tour’s group at Rice University used a similar graphene nanoribbon/ V2O5
composite material for use as the cathode in LIBs.43 They utilize graphene nanoribbons (GNR) to
enclose nanocrystalline V2O5 particles by “unzipping” multi-walled carbon nanotubes
(MWCNTs). The group first fabricated the GNR from unzipped MWCNTs. The MWCNTs were
combined with 1,2-dimethoxyethane and a Na/K alloy in a N2 filled glovebox. The solution was
stirred for three days then filtered and dried. Next, the GNRs were combined with
1,2-dimethoxyethane and varying amounts of Na/K alloy under N2 atmosphere. Then, VCl4 was added
with stirring for two days. This causes V4+ to be reduced to V0 NPs by the Na/K alloy while being
intercalated into the GNR. This composite was then annealed at 250°C for 3 hrs to oxidize vanadium to vanadium oxides. The three-dimensional conductive matrix is shown to be able to increase the conductivity and therefore improve the rate performance as well as the stability of
V2O5 particles. The group is able to attain a high capacity of 278 mAh g-1, but like other studies,
this capacity is calculated based on the mass of V2O5 alone. Considering that the electrode contains
only 40 wt. % V2O5 particles, the capacity based on the total electrode mass is calculated to be
only 110 mAh g-1 considering that carbon does not have any contribution to capacity at a voltage
window of 2 – 4 V. The capacity retention rate is also unsatisfying at only 78% in 100 cycles
(Figure 8). Although their structure shows an increased performance over V2O5 particles alone,
the overall capacity based on total electrode mass needs to be improved as well as the capacity retention rate.43
Figure 8: Cycling performance of different mass loadings of V2O5. Reprinted with permission
from reference 43. Copyright 2014, American Chemical Society.
1.9. Brief History of Asymmetric Membranes and Their Formation Mechanisms
Asymmetric membranes are widely used in water filtration and water desalination due to their unique asymmetric porous structure consisting of a network of nanopores and macropores. This structure allows a high water flux while also being able to reject salts and other larger
macromolecules.54 These membranes are produced almost exclusively through immersion
precipitation where the membrane forms through a process called phase inversion.55 They can be
produced on a large scale via a roll to roll method.
The precipitation process is the main method to producing asymmetric membranes. In this method there are three components: polymer, solvent, and nonsolvent. The membrane is ultimately
formed by a process known as phase inversion.56 Phase inversion can be illustrated through a
ternary phase diagram (Figure 9). Each corner of the phase diagram represents a different phase. At any point inside the triangle, all phases are present at different concentrations. The general
procedure for phase inversion requires a polymer to be dissolved into the solvent. Once the polymer is dissolved it is cast onto a substrate to be immersed into the nonsolvent in which the polymer is insoluble. Then, two phases are to be formed, polymer-rich and polymer-lean, resulting
in the spontaneous formation of asymmetric membranes. 54, 57
Figure 9: Ternary phase diagram for the phase inversion process.
In general, there are two types of membranes that can be formed, finger-like and a porous
sponge structure.54 Each type of membrane is formed under different precipitation conditions. The
rate at which the polymer precipitates is the determining factor for which type of membrane will
form. The best way to control the rate of precipitation is by the use of different solvents.58 Some
solvents have a tendency to produce finger-like structures while others produce sponge-like membranes (Figure 10). Finger-like membranes will have a dense skin layer on their surface and a much less dense finger-like network of larger pores underneath. This structure is produced because the skin layer meets the nonsolvent first and is therefore precipitated out of solution faster. At this point the polymeric solution absorbs the nonsolvent quickly and is therefore supersaturated
with polymer and is precipitated from a large number of nucleation sites.59 This dense skin layer impedes the flow of nonsolvent and therefore causes the underlying layer to have fewer nucleation
sites and be precipitated out of solution much more slowly.54
Figure 10: a) An example of a sponge-like polysulfone membrane that was precipitated in ethanol,
and b) an example of a membrane polysulfone membrane that was precipitated in DI water.
1.10. Our Proposed Hypothesis and General Experimental Design
It is hypothesized by us that the asymmetric structure consisting of dense nanopores and large macropores can provide an ideal solution to solving the large volume expansion issue of high capacity lithium-ion battery electrodes such as silicon and vanadium pentoxide. The large macropores can provide free space for Si to expand while the dense nanoporous skin layer can prevent cracked Si from being leached out into the electrolyte, causing permanent capacity loss. These membranes can be produced on a large scale via a simple roll to roll method, thus benefiting their potential commercialization.
To adapt these membranes to contain silicon for use as the anode material we will simply add Si MP and a conductive carbon black additive to the polymeric solution and carry out the
phase inversion process in water to generate a fingerlike structure. In order to further stabilize the electrode, either one or both sides of the original membrane will be coated with carbonaceous cellulose acetate membranes. This may help to prevent particles from being leached out into the electrolyte causing permanent capacity loss. These membranes will be carbonized to make them conductive enough for use in LIBs, then glued to a current collector and assembled into coin cell batteries for various electrochemical tests such as cyclability, voltage profiles, electrochemical impedance spectroscopy, rate performance, etc.
For cathode materials, the process is a little different by introducing sol-gel chemistry. We
will dissolve a V2O5 organometallic precursor in the polymeric solution and then add either carbon
black or graphene as a conductive additive. It is hypothesized that graphene may wrap around the
V2O5 particles, increasing the conductivity greatly. With the addition of an organometallic
precursor, the membrane will still form via phase inversion but will be complicated due to the
V2O5 sol-gel chemistry. Overall, it is predicted that this will not significantly affect the ternary
phase diagram and structure of the membrane. These membranes will be carbonized in an inert atmosphere and then annealed in air. The extra annealing step is necessary to oxidize vanadium
back to the V2O5 form as other charge states of vanadium are not suitable for use in LIBs. Similar
to the anode, the membranes will then be glued to a current collector and assembled into half cell batteries for electrochemical tests.
CHAPTER 2: Asymmetric Membranes Containing Micron Size Silicon as Anode Material for High Capacity Lithium Ion Batteries
2.1. Introduction
Aforementioned in the introduction, current LIBs are limited by their low capacity graphite
anodes with a theoretical capacity of only 372 mAh g-1. An alternative is to incorporate silicon into
batteries as a high capacity anode material. Silicon benefits from a high theoretical capacity of 4200 mAh g-1 based on the fully lithiated phase of Si22Li5.3, 17 Unfortunately, with this large
capacity comes some serious obstacles to overcome. The biggest issue with silicon is its volume
expansion upon cycling. When silicon is lithiated, it can expand up to 300%.29 Due to the low
mechanical strength of silicon, this expansion can cause silicon particles to crack and be peeled away from the current collector, resulting in permanent capacity loss in only a few cycles. In micron-size silicon, these issues are amplified since silicon will continue to crack until it reaches
a small enough diameter where the mechanical strength is improved.60 Most attempts to
circumvent this issue involve the use of nano-sized silicon particles.19, 32-34, 61 However, these
nano-sized silicon particles are much more expensive than their micron-size counterparts. Cost is one of the major hindrances to nano-sized silicon being commercially used in LIBs. To overcome this issue, low cost composites with free space to allow for silicon to expand but still maintain good contact with the current collectors are needed.
The asymmetric structure is an ideal structure to contain silicon’s volume expansion issues. The dense skin layer on the surface of the membrane can act as a barrier to keep cracked silicon particles trapped inside while the large macropores allow ample space for silicon to expand upon
lithiation. These membranes are also produced via a facile phase inversion process.58-59 Herein, we
membranes via phase inversion. In addition, it was determined the performance of a single-layer membrane alone was not satisfying (~40% capacity loss in 100 cycles), therefore double-layer and triple-layer (sandwich) membrane coatings were added with no silicon to increase the cycle life. We are able to demonstrate that these additional coatings can stabilize Si MP-based electrodes during cycling.
2.2. Experimental
2.2.1. Synthesis of single-layer asymmetric membranes containing micron-size silicon
First, 0.75 g of polyacrylonitrile (PAN) (Mn=150,000; Pfaltz & Bauer) was dissolved in 11
mL N-methyl-2-pyrrolidone (NMP) (Sigma Aldrich, >99.5%) using a sonic bath (Bransonic CPX3800H) for 1 hr. Next, 0.25 g of as-received Si powder (American Elements, ~1 µm, Figure
13) and 0.20 g carbon black (CB, TIMCAL SUPER C45 with a surface area of 45 m2 g-1) were
added to the solution and dispersed using a sonic bath for 2 hrs. After sonication, the homogenous solution was then coated onto a silicon (100) wafer (2 in. diameter) using a doctor blade set to deliver a wet coating thickness of 100 µm. Next, the coated wafer was immersed in deionized water for phase inversion. The membrane was left in DI water for 30 minutes and then placed in ethanol for another 30 minutes to remove residual moisture. It is noteworthy that the moisture may lead to the oxidation of silicon powders at high temperature during the carbonization process. Finally, the membrane was carbonized at 800°C for 2 hrs in a tube furnace (Lindberg/Blue M™ 1100°C) and under the protection of helium gas (99.9999%, Airgas He UHP300) with a flow rate
of 200 sccm. The temperature was ramped at a rate of ~60°C min-1. These membranes are labeled
2.2.2. Synthesis of double-layer asymmetric membranes containing micron-size silicon
A mixture of 0.75 g of cellulose acetate propionate (Mn=15,000; Acros) and 0.2 g of carbon
black was dispersed in 5 mL of acetone using a sonic bath for 1 hr. This mixture was then coated on the top of the un-carbonized PAN/Si membrane using a doctor blade set to ~25 µm. Next, the coated membrane was placed into ice cold ether (ACS Grade, EMD Millipore Corporation) for phase inversion to generate a double-layer asymmetric membrane. Lastly, the membrane was carbonized at 800°C for 2 hrs in a tube furnace and labeled as CA/PAN/Si herein.
2.2.3. Synthesis of triple-layer sandwich asymmetric membranes containing micron-size silicon
First, 1.2 g of cellulose acetate and 0.4 g carbon black were dispersed in 15 mL acetone to make a suspension. Next, an un-carbonized PAN/Si asymmetric membrane was dipped directly into the suspension and then slowly withdrawn out of the suspension. In the next step, the dip-coated membrane was immersed into ice cold ether to form a triple-layer sandwich asymmetric membrane. Similarly, the triple-layer sandwich asymmetric membrane was carbonized at 800°C for 2 hrs in a tube furnace and labeled CA/PAN/Si/CA. The synthesis of these membranes is demonstrated in Figure 11.
2.2.4. Synthesis of asymmetric membranes without silicon for control
Asymmetric membranes containing no Si MPs were also prepared using the aforementioned method for control experiments. The membranes were carbonized at 800°C for 2 hours and labeled as PAN.
Figure 11: General experimental design for the synthesis of CA/PAN/Si/CA asymmetric
membranes.
2.2.5. Characterization
A field emission scanning electron microscope (JEOL JSM-7600F) equipped with a transmission electron detector (TED) was used for morphology and structure characterizations. Raman studies were carried out using a ThermoScientific DXR SmartRaman Spectrometer with a 10x lens magnification, 150 second collection time, a 1 mW laser with a wavelength of 532 nm, and a 50 µm slit aperture. Phase identification was performed using a powder X-ray diffractometer
(Rigaku MiniFlex 600) at Armstrong State University. The samples were scanned using Cu Kα
(λ=0.1542 nm) radiation with a step rate of 0.2° per second from 10-90° (2Θ). The silicon content was determined using a thermogravimetric analyzer (TA Instruments G50 TGA). Compressed air
(Ultra Zero, Airgas) was used as the purging gas with a flow rate of 20 mL min-1. The temperature
distribution experiments were completed on a Micrometrics ASAP 2020 Surface Area and Porosity Analyzer. The surface area was calculated using Brunauer-Emmett-Teller (BET) equation and pore size distribution was determined using the Barrett-Joyner-Halenda (BJH) method. Samples were degassed at 50 µTorr and 300°C for 30 minutes. Nitrogen adsorption and desorption was carried out at 77 K using ultra high purity nitrogen gas (Airgas UHP300, 99.9999%).
2.2.6. Electrode preparation and electrochemical analysis
Asymmetric membranes were glued to a copper current collector (15 mm diameter, 11 µm thickness; MTI Corporation) using a suspension made of 0.15 g carbon black and 0.15 g of polyacrylic acid (PAA; Aldrich) in 4 mL of ethanol to make the electrodes. Electrodes were then dried in an oven at 100°C for at least 4 hrs to remove residual moisture and ethanol. In the next step, these dried electrodes were assembled into 2032 coin cells (MTI Corporation) using Li metal
as the counter electrode and 60 µL electrolyte consisting of 1 M LiPF6 dissolved in ethylene
carbonate (EC), dimethyl carbonate (DMC), and diethyl carbonate (DEC) with a 1:1:1 v/v ratio (MTI Corporation). A polypropylene/polyethylene membrane with pore size of 0.21 x 0.05 µm (MTI Corporation) was used as separator. The mass loading of the silicon asymmetric membrane is 1-2 mg per coin cell. The contents of silicon are determined by TGA analysis, which are 46.0 wt.%, 39.6 wt.% and 33.6 wt.% in single-layer, double-layer and triple-layer asymmetric membranes, respectively.
For Si MP coin cell batteries (control sample), 80 wt.% Si MPs, 10 wt.% PAA and 10 wt.% carbon black were sonicated for 2 hrs to create a homogenous slurry. The slurry was coated onto a copper foil using a doctor blade with a wet coating thickness of 100 µm. After being dried, the foil was punched into 15 mm diameter disks and then assembled into coin cells using the same method as mentioned above. The whole battery assembly was carried out in an argon filled glove
box (LCPW, LC Technology Solutions, Inc.) with both oxygen and water content <1 ppm. Galvanostatic cycling of the LIBs was carried out on a Bio-Logic VMP3 multi-channel potentiostat
with a voltage window of 0.01-1.50 V vs. Li+/Li. Three formation cycles at a current density of
100 mA g-1 were carried out on all coin cell batteries before any other electrochemical tests.
Electrochemical impedance spectroscopy (EIS) measurements were carried out in the frequency range of 0.1 Hz – 1 MHz with an amplitude of 10 mV. The data were fitted using an equivalent
circuit as shown in Figure 12. Rs stands for the contact resistance; RSEI and CSEI are corresponding
to the resistance and capacitance from SEI layer; Rct and Cdl represent the charge transfer resistance
and double-layer capacitance of the membrane electrode; Wd is the Warburg diffusion impedance.
Figure 12: Equivalent circuit used to fit EIS measurements.
2.3. Results and Discussion 2.3.1. Characterization
Because Si MPs have irregular shapes, the Heywood diameter ( 𝑑𝑝 = 2√𝐴
𝜋) is used to represent the size of these particles, where A is the area of the particle determined from TEM images using ImageJ software (Figure 13a). The average diameter of Si MPs for this study was calculated to be ~1.01 µm (Figure 13b) with a standard deviation of ~0.60 µm, which is highly consistent with the corresponding SEM and TEM images (Figure 13a, 13c and 13d).
Figure 13: Electron microscope characterization of Si MPs used for this study: a) transmission electron microscope (TEM) image used to calculate size distribution via the ; b) size distribution; c) and d) scanning electron microscope (SEM) images at different magnifications. Note: the scale bars in a) and d) are 1 µm, while the bar in c) represents 10 µm.
Cross-section images of single layer PAN/Si membranes reveal the unique asymmetric structure is present with large macro-pores ~10 µm wide sandwiched between two dense skin layers. It can be seen that the membrane thickness decreased from the original wet coating thickness of 100 µm to ~80 µm. This is caused by solvent de-mixing (Figure 14a). After carbonization, it can clearly be seen that the asymmetric structure is maintained even with the loss of organic material and the thickness is further reduced to ~65 µm (Figure 14d). To further improve the electrochemical stability of the single-layer asymmetric membrane electrode, a cellulose acetate/carbon black solution was coated on one side or both sides of the original single-layer
Size Distribution of SiMP
Diameter ( m) 0.0 0.5 1.0 1.5 2.0 2.5 3.0 C o u n t 0 5 10 15 20 25 30 35
a)
b
)
c)
d)
PAN/Si membrane that was then carbonized to generate double-layer or triple-layer (sandwich) asymmetric membranes (Figure 14b,c,e,f). These carbonaceous membranes are dense sponge-like membranes that serve the purpose of protecting any Si MP that may have precipitated onto the membrane surface during phase inversion. The high-resolution SEM image (Figure 15) shows that the junction between the top carbonaceous layer derived from the carbonized cellulose acetate and the bottom PAN/Si layer is nearly seamless, which is beneficial to an efficient electron transfer across the boundary.
Figure 14: a) PAN/Si single-layer asymmetric membrane before carbonization; b) CA/PAN/Si
double-layer asymmetric membrane before carbonization; c) CA/PAN/Si/CA triple-layer asymmetric membrane before carbonization; d) PAN/Si membrane after carbonization at 800°C for 2 hrs; e) CA/PAN/Si membrane after carbonization at 800°C for 2 hrs; f) CA/PAN/Si/CA membrane after carbonization at 800°C for 2 hrs.
a)
b)
c)
Figure 15: High resolution scanning electron microscope image of the interface in double-layer asymmetric membrane containing Si MPs.
In order to confirm the presence of silicon, Raman Spectroscopy was employed. Raman
data shows a sharp peak around 520 cm-1 for all samples containing Si MPs, confirming the
presence of cubic Si (Figure 16a).62 For all carbonized membrane samples a weak graphite (1600
cm-1) and defect (1365 cm-1) peak can be clearly distinguished. From this it can be determined that
the during the carbonization process a small amount of poorly ordered graphite can be formed. With increasing weight percentages of carbon, the peaks intensify. The phase identification is further confirmed in Figure 16b. In each sample that contains Si, characteristic patterns from cubic phase Si (111), (220), (311), (400), (331) and (422) crystal planes were observed (JCPDS-ICDD No. 27-1402). A broad pattern at 26° can be seen from all types of membranes, which can be
ascribed to carbon materials with a poor crystallinity similar to the Raman spectra.18, 63-64 This peak
Figure 16: a) Raman spectra of all carbonized membranes and as received SiMP; b) PXRD diffraction patterns of all carbonized membranes and as received SiMP (Note: **: Si, G: graphite).
The silicon content in asymmetric membranes was determined using a Thermogravimetric
Analyzer (TGA) under the assumption that carbon can be fully oxidized into CO2 gas and Si is
only slightly oxidized under our TGA conditions. This hypothesis is confirmed by the PAN control membrane which showed a 99.7% weight loss (Figure 17b). Under the same TGA analytical conditions, the mass of pure Si MPs is only slightly increased by less than 1.0%, confirming that Si cannot be significantly oxidized below 700° C in air (Figure 17a). Under this assumption, the content of Si in PAN/Si single-layer, CA/PAN/Si double-layer and CA/PAN/Si/CA triple-layer (sandwich) membranes are 46.0 wt.%, 39.6 wt.% and 33.6 wt.%, respectively (Figure 17c-e). The
Si MP Degree (2 10 20 30 40 50 60 70 80 PAN PAN/Si In te n s it y ( A U ) CA/PAN/Si CA/PAN/Si/CA G ** (1 1 0 ) ** ** ** ** (2 2 0 ) ** (3 1 1 ) ** (4 0 0 ) ** (3 3 1 ) ** ** ** ** ** ** ** ** ** ** ** ** Si MP Raman Shift (cm-1) 200 400 600 800 1000 1200 1400 1600 1800 2000 PAN PAN/Si In te n s it y ( A U ) PAN/Si/CA CA/PAN/Si/CA Si G D
a)
b)
gradual decrease in Si content from the single-layer to the triple-layer asymmetric membrane is due to the addition of carbonaceous coatings that do not contain any Si particles.
Figure 17: Thermogravimetric analysis of: a) as received SiMP; b) carbonized PAN/CB
membrane with no Si added; c) carbonized PAN/Si single membrane; d) carbonized CA/PAN/Si double layer membrane; e) carbonized CA/PAN/Si/CA triple layer membrane.
Time (min) 0 20 40 60 80 T e m p e ra tu re ( oC) 0 100 200 300 400 500 600 700 800 M a s s P e rc e n t (% ) 96 98 100 102 +0.94% Time (min) 0 20 40 60 80 T e m p e ra tu re ( oC) 0 100 200 300 400 500 600 700 800 M a s s P e rc e n t (% ) 0 10 20 30 40 50 60 70 80 90 100 110 -99.7% Time (min) 0 20 40 60 80 T e m p e ra tu re o C 0 100 200 300 400 500 600 700 800 M a s s P e rc e n t (% ) 30 40 50 60 70 80 90 100 110 -54.0% Time (min) 0 20 40 60 80 T e m p e ra tu re ( oC) 0 100 200 300 400 500 600 700 800 M a s s P e rc e n t (% ) 20 30 40 50 60 70 80 90 100 110 -60.4% Time (min) 0 20 40 60 80 T e m p e ra tu re ( oC) 0 100 200 300 400 500 600 700 800 M a s s P e rc e n t (% ) 20 30 40 50 60 70 80 90 100 110 -66.4%
a)
c)
b)
d)
e)
The BET and BJH equations were used to determine the surface area and porosity of carbonized membranes, respectively (Table 1 and Figure 18). The surface area of CA/PAN/Si/CA
sandwich asymmetric membrane is 67.4 m2 g-1. The double-layer CA/PAN/Si membrane has a
slightly lower surface area of 59.6 m2 g-1. Finally, the single PAN/Si membrane has the lowest
surface area of 36.4 m2 g-1. The trend of increased surface area and increasing number of carbon
coatings can be attributed to the highly porous structure of the carbonaceous layer (Table 1). The pore size distribution data shows the majority of pores are less than 40 nm in diameter, but there are some larger pores greater than 100 nm (Figure 18b).
Figure 18: a) surface area plot of CA/PAN/Si/CA triple-layer asymmetric membrane; b) pore size
distribution of CA/PAN/Si/CA triple-layer asymmetric membrane.
Table 1: BET surface area of carbonized single-layer, double-layer and triple-layer asymmetric
membranes.
Relative Pressure (P/Po)
0.05 0.10 0.15 0.20 0.25 0.30 0.35 1 /[ Q (P o /P 1)] ( g /c m 3) 0.002 0.004 0.006 0.008 0.010 0.012 0.014 0.016 0.018 0.020 0.022
Pore Size (Angstroms)
0 200 400 600 800 1000 1200 P o re V o lu m e ( c m 3/g ) 0.02 0.04 0.06 0.08 0.10 0.12 0.14 0.16 0.18 0.20 0.22 0.24
Type of membrane BET specific Area (m2/g)
CA/PAN/Si/CA; Triple Layer Asymmetric Membrane 67.4
CA/PAN/Si; Double Layer Asymmetric Membrane 59.6
PAN/Si; Single Layer Asymmetric Membrane 36.4
2.3.2. Electrochemical Analysis
The LIBs fabricated using the single layer PAN/Si membrane show a high initial capacity
of 968 mAh g-1 at a charging rate of 0.5C which corresponds with a two-hour charging and
discharging time, respectively (Figure 19b). Unfortunately, the retention is sub-par with only ~40% capacity retention over the course of 100 cycles. Even though the retention is poor, it is a significant improvement over the pure Si MP electrode which experiences nearly 100% capacity loss in as little as five cycles (Figure 19b). This rapid capacity loss is commonly seen in
literature.27, 29, 37 This dramatic increase in cyclability can be credited to the asymmetric porous
structure. The structure provides free volume for Si MPs to expand and contract within the large macro-porous network during lithiation/delithiation. However, the nearly 60% capacity loss is not satisfying and needs to be vastly improved. It is believed that the large capacity drop of single-layer PAN/Si membrane may be related to the pulverization of Si MPs on its top surface (Figure 20b). The SEM images of the membrane surface show that after carbonization, many Si MPs become exposed thus can be cracked and leached out into the electrolyte. It is well-known that Si
MPs have a high tendency to fracture during lithiation.60 The fracture of micron-size Si particles
can cause loose contact with conductive carbon material.29 This fracturing will continue until the
particle size is small enough to withstand cracking. When this happens, the tiny nanoparticles that are generated may fall into the conductive finger-like channels. This may cause the contact between silicon and carbon to be regained leading to an increase in capacity. This phenomenon may explain why the PAN/Si membrane experiences an initial capacity loss and a full recovery of
initially lost capacity up to ~1000 mAh g-1. Additionally, Si NPs can be more efficiently lithiated
as compared to Si MPs due to the shortened lithium diffusion length. Even though the capacity is
without the coating of additional porous carbon coatings on the surface of the PAN/Si single layer membrane.
Based on this assumption that Si MPs on the surface were a major factor in the continuous capacity loss, the single-layer PAN/Si asymmetric membrane was coated with a single-layer or double-layer coating of cellulose acetate (CA) asymmetric membranes to obtain double-layer or triple-layer asymmetric membranes, respectively. The goal of this structuring is to prevent the loss of pulverized silicon particles from the top surface of asymmetric membrane. It is worth noting that the CA asymmetric membrane must be carbonized to make it electrically conductive. Indeed, double-layer CA/PAN/Si asymmetric membrane shows a much improved cyclability as compared to single-layer PAN/Si asymmetric membrane (Figure 19b). Despite an initial capacity loss of
~18% in the first 20 cycles, the capacity remains nearly unchanged from the 20th to 80th cycle. The
initial capacity loss may be linked to the pulverization of Si MPs caused by the sudden increase in current after formation cycles are complete. As a result, some Si particles may lose contact with the conductive carbon matrix, thus leading to the capacity loss. The initial capacity of the
double-layer CA/PAN/Si asymmetric membrane is 852 mAh g-1 at 0.5C. This is slightly lower than that
of single-layer membrane and is caused by a lower content of silicon (46.0% in PAN/Si to 39.6% in CA/PAN/Si). The capacity retention of triple-layer CA/PAN/Si/CA asymmetric membrane is far and away superior to other samples (Figure 19a). Over 88% of the initial capacity can be retained after 100 cycles. This impressive retention is seen because the PAN/Si asymmetric membrane is protected by extra porous coatings that can efficiently prevent the loss of pulverized
Si particles. The overall capacity of triple-layer asymmetric membrane is 610 mAh g-1 at the 100th
cycle at a charging rate of 0.5 C. The average coulombic efficiency is 99.8% in 100 cycles (Figure 19a). The coulombic efficiency is the ratio of lithium that is inserted to the amount extracted. It is