Connecting the Dots in Visual Analysis
Yedendra B. Shrinivasan∗Eindhoven University of Technology The Netherlands David Gotz† IBM Research USA Jie Lu‡ IBM Research USA ABSTRACT
During visual analysis, users must often connect insights discov-ered at various points of time. This process is often called “connect-ing the dots.” When analysts interactively explore complex datasets over multiple sessions, they may uncover a large number of find-ings. As a result, it is often difficult for them to recall the past insights, views and concepts that are most relevant to their current line of inquiry. This challenge is even more difficult during collab-orative analysis tasks where they need to find connections between their own discoveries and insights found by others.
In this paper, we describe a context-based retrieval algorithm to identify notes, views and concepts from users’ past analyses that are most relevant to a view or a note based on their line of inquiry. We then describe a related notes recommendation feature that sur-faces the most relevant items to the user as they work based on this algorithm. We have implemented this recommendation feature in HARVEST, a web based visual analytic system. We evaluate the related notes recommendation feature of HARVESTthrough a case study and discuss the implications of our approach.
Index Terms: H.3.3 [Information Search and Retrieval]— Retrieval models
1 INTRODUCTION
Interactive visualizations allow users to investigate various charac-teristics of a dataset and to reason based on patterns, trends and out-liers. During complex visual analyses, users must derive insights by connecting discoveries made at different stages of an investigation. However, during a long investigation process that can span hours, days or even weeks, it becomes difficult for users to recall the de-tails of their past discoveries. Yet these dede-tails may form the key connections between their past work and current line of inquiry. We believe that the difficulty in recalling past work often leads users to overlook important connections. The challenge, therefore, is to de-velop techniques that assist in “connecting the dots” by uncovering connections to users’ past work that would normally go unnoticed. To address the challenge of recalling past work, users often ex-ternalize interesting findings or new hypotheses using either anno-tations on top of visualizations or through bookmarks in electronic notes. These notes help users to manually revisit and review their past analysis. However, as the number of notes and annotations grows larger, users again have difficulty recalling the details of each previous discovery. Therefore, users must be enabled to more easily retrieve relatedviews(visualization states with one or more visual-izations),notesandconcepts(including data characteristics investi-gated in the views and entities from notes) from their past analyses. These related views, notes and concepts can then help them to find interesting connections within their analysis.
∗e-mail: [email protected] †e-mail:[email protected] ‡e-mail:[email protected]
In this paper, we describe a context-based retrieval algorithm that retrieves views, notes and concepts from users past analysis related to a view or a note based on their line of inquiry. Whenever users create a view or record a note, we derive a context description for the view or note from their line of inquiry. Our algorithm then uses these context descriptions to retrieve the most relevant views, notes and concepts from past analyses.
Using our context-based retrieval algorithm, we have imple-mented a related notes recommendation feature in HARVEST, a web based visual analytic system. As users create new views during their analysis, HARVESTdynamically applies our algorithm to rec-ommend the most relevant notes from past analyses. An overview of related notes is presented as a ranked list of notes along with a thumbnail of associated views in the note-taking interface. An overview of related concepts is also shown using a tag cloud. Both overviews are updated after each exploration action. We evaluate the related notes recommendation feature of HARVEST through a case study and discuss the implications of our approach. Specif-ically, we believe that the related notes recommendation feature helps users to maintain greater awareness of relevant information and assists in connection discovery during visual analysis. 2 CONNECTING THEDOTS
We encounter a lot of information during daily activities. We pro-cess that information to learn new things, perform tasks or make de-cisions, and store that processed information in our memory. How-ever, our memory is limited in its ability to store and recall relevant information from the past [4]. To overcome these limitations, we have learnt to work around by taking notes, capturing pictures and videos, or associating with a local environment [12]. In addition, we also create to-do lists and automatic reminders using personal information management systems [15]. These external attention pointers help us remember information that would otherwise be forgotten. Thus, we try to connect the dots using these attention pointers and make sense of information encountered in our daily activities.
Also, when we read a text, we process information from it to understand the story conveyed by its authors. For this, we need to connect the dots at various parts of the text and make sense of it. A good text provides relevant attention pointers in the text that helps a reader to connect the dots. For example, authors of academic text use cross-referencing as a reminder that helps readers to locate relevant pieces of information from other locations. Similarly, au-thors of fiction text use sequences of events or people and context descriptions as attention pointers that help readers to connect the dots.
During a visual analysis, analysts encounter much information by interactively exploring large datasets using visualizations. They also formulate some interesting findings during this exploration process. Due to the volume of information discovered during a long analysis task, they often externalize interesting findings or new hy-potheses using either annotation on top of visualizations or through bookmarks in electronic notes. They organize those findings into a case and present them to others [11, 17]. They must often con-nect insights discovered at various points of time and make sense of them [10]. However, during a long investigation process that can
span hours, days or even weeks, it becomes difficult for users to re-call the details of their past discoveries. Therefore, it is difficult to connect the dots during a visual analysis. Hence, we think it will be helpful for the users to retrieve notes, views and concepts that are related to a given view or note based on their line of inquiry. Also, during a visual analysis, the most relevant items from past analy-ses related to their current line of inquiry can be recommended for maintaining awareness of relevant information and to assist in con-nection discovery.
3 RELATEDWORK
First, we present a number of sense making models that highlight the critical role of connection discovery during information analy-sis. We then discuss related work that specifically addresses “con-necting the dots” during visual analysis.
3.1 Sense Making Models
Kuhlthau [14] considers a sense making process as an information search process in which a person is forming a personal point of view [5]. She identifies six stages in an information search process from a user’s perspective: initiation, selection, exploration, formu-lation, collection and presentation. She modeled the cognitive, af-fective and actions aspects involved in these six stages by conduct-ing longitudinal user studies involvconduct-ing various public library users, students and academic researchers. Finding relevant information to the current topic and being aware of related information are some of the important actions during the exploration and collection stages. These actions help to avoid premature closure of an information search process.
Similarly, Ellis [6] classifies information seeking activities into eight categories: starting, chaining, browsing, differentiating, mon-itoring, extracting, verifying and ending. She models the process of connection discovery in the information search process in two categories: chaining and monitoring. Chaining involves follow-ing a referential connection between information sources. Monitor-ing involves maintainMonitor-ing awareness by trackMonitor-ing related information sources.
Pirolli and Card [16] identify two major loops in the sense mak-ing process durmak-ing an intelligence analysis task: the information foraging loop and the sense making loop. They found that analysts look back into the processed information (evidence file) obtained during the information foraging loop from the sense making loop to search for evidences or relations that support a hypothesis. If no supporting information is found, analysts continue to forage new information.
3.2 Visual Analysis
In general, to support the reasoning process in information visu-alization [17], users are provided with three type of linked views: a data view, a knowledge view and a navigation view. The data view has interactive visualization tools; the navigation view pro-vides an overview of exploration process, for instance, history tree and action trails; and the knowledge view helps to record and orga-nize notes. Currently, during an analysis, the connection discovery process is supported by exploiting the relationships shared between either views and notes, or entities in notes.
Using Links between Views and Notes
Several information visualization tools support links between views and notes. In Aruvi [17], users can externalize findings using notes along with links to the views. They can revisit views via notes and review and revise their analysis. To support the review process, it also provides an overview of key visualization and data aspects in an exploration process using a user interest model [18]. They can also retrieve visualizations from the past analysis using keyword and similarity search mechanisms.
Sense.us [11], a web site supporting asynchronous collabora-tion across a variety of visualizacollabora-tion types, supports view sharing, discussion, graphical annotation, and social navigation. It has a doubly-linked discussion mechanism that supports situated conver-sation about visualizations. For this, both data and view parameters of visualization states are indexed and associated with the corre-sponding comments. Thus, during an asynchronous collaboration, all comments associated with a view are retrieved.
Using Entities
A combination of text analytics and information visualization has been widely used to analyze massive textual data. Text analytics is used to extract entities from the text and the relationship between those entities is visualized. The Have Green framework [20] uses an interactive graph visualization to represent concepts and relation-ships extracted through its analytical capabilities. In Jigsaw [19], multiple coordinated views are used to visualize the connections between entities extracted from a collection of text documents. A graph view is used to visualize text documents and entities shared among these documents. In addition to graph visualization, a list view is used to show the connection between entities. A scatter-plot view is used to explore pairwise connections between entities. However, in Have Green and Jigsaw text analysis is used on the input data, but not applied to a user’s notes.
Analyst’s Notebook [13] visualizes the relationship among en-tities extracted from a user’s notes using graph visualization. In Entity Workspace [1], users can record notes or place text snip-pets, entities and their relationship from notes and documents are extracted and a document-entity graph is constructed. Using this graph model, analysts can re-find facts quickly, notice connections between entities, abstract information structure and identify docu-ments and entities to explore further. During a collaborative anal-ysis, the most valuable notes from other analysts related to the current topic (text) are recommended to an analyst using an en-tity graph. Thus the enen-tity workspace identifies related entities and helps analysts to connect the dots while investigating a text docu-ment corpus. Also, in InsightFinder [2], users’ notes are used to build a context model. Using this context model, the most relevant page units are recommended to them while browsing the internet.
During a visual analysis, users formulate findings after some ex-ploration as identified in Pirolli and Card’s sense making model and Kuhlthau’s information seeking process model. For connection dis-covery in visual analysis, approaches based on links between views and notes or entities in notes are not sufficient. The users’ line of inquiry has to be considered in combination with view and data parameters of views and entities in notes. We now present our ap-proach to connect the dots in visual analysis, by considering the users’ line of inquiry, view and data parameters of views, and enti-ties in notes in an integrated way.
4 APPROACH
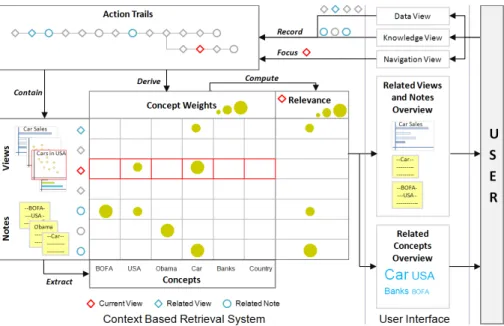
To support the connection discovery process in visual analysis, we enable users to retrieve views, notes and concepts from past analy-ses related to a view or note. Figure 1 shows our approach. When-ever they create a view of their data (in data view) or record a note (in knowledge view), we derive a context description for the view or note from their line of inquiry. Our algorithm then uses these con-text descriptions to retrieve the most relevant views and notes from past analyses. The context description is derived from a model of visual analytic activity calledaction trails[10]. Action trails repre-sent users’ analytic activity as graphs of semantic analytic steps, or actions. Actions can be classified into broad categories:exploration actions,insight actions, andmeta-actions. An exploration action al-ters the visualization specifications in a visual analytics system and creates a new view. Insight actions record or organize notes and
Figure 1: A context-based retrieval system that retrieves related notes, views and concepts for a view or a note based on the users’ line of inquiry. This retrieval system is used to support the ‘connecting the dot’ process during a visual analysis.
views, while meta-actions (e.g., revisit, undo, redo) allow users to review and structure their lines of inquiry.
Action trails contain valuable information about the concepts that are most relevant to a user’s analysis and how the user’s in-terests evolve over time. We therefore extract a set of concepts from the action trail to form the context description for each view or note. We extract two types of concepts. Action concepts are de-rived from the attributes associated with exploration actions (e.g., data and view parameters). Entities are concepts extracted from a user’s notes and represent items such as people, places or compa-nies. For each concept associated with a view or note, we derive a concept weightsfrom the user’s action trail to determine its degree of salience at the time the view or note was created.
For a view or note focused by the user, we compute the relevance score to existing views and notes by comparing the context descrip-tions of existing views and notes with that of the given view or note. Using the relevance score, the related views and notes are retrieved. An overview of the related concepts is also provided. Thus, this context-based retrieval algorithm surfaces the most relevant infor-mation from the past analyses of the users based on their line of inquiry during a visual analysis.
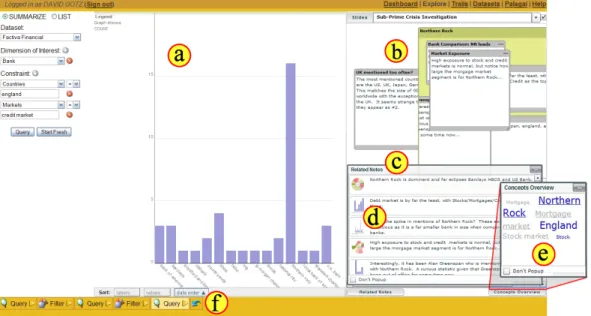
Using this context-based retrieval algorithm, we have imple-mented a recommendation feature in HARVEST, a web based visual analytics system which is shown in figure 2. The recommendation feature shows a list of related notes (figure 2(c)) along with thumb-nails of the view displayed while recording those related notes (fig-ure 2(d)) to the current view (fig(fig-ure 2(a)). Also, it provides an overview of related concepts using a tag cloud (figure 2(e)). In the following sections, we describe the context-based retrieval algo-rithm (section 5) and present the design considerations (section 6) and implementation details (section 7) of the recommendation fea-ture in HARVEST.
5 CONTEXT-BASEDRETRIEVALALGORITHM
In this section, we describe the details of our context-based retrieval algorithm. First, we present a visual analysis use case. Next, we support our argument for a context description based on action con-cepts and entities from action trails with the use case. We then use the context description as the basis for the relevance metric used to identify related views, notes, and concept.
5.1 Use Case
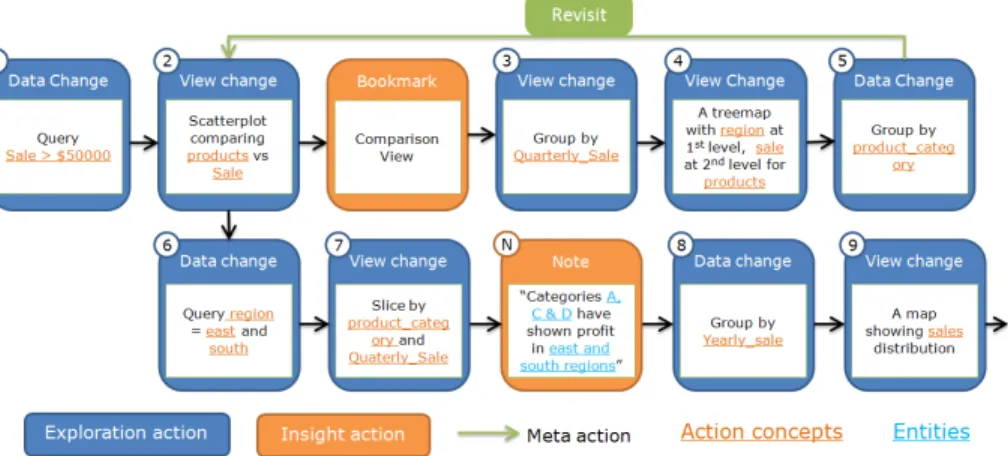
Figure 3 shows a portion of an action trail for an analyst investigat-ing product sales data. She starts her analysis by focusinvestigat-ing on sales that are more than $50,000 (figure 3(1)). She compares sales of each product using a scatterplot visualization and bookmarks it (fig-ure 3(2)). Then, she studies quarterly sales of the products by ag-gregating the sales represented on the y-axis of the scatterplot based on a quarterly time period (figure 3(3)). Next, she uses a tree map to visualize the sale figures in various regions (figure 3(4)). Further, she clusters the products by their category to get an overview of the sales performance by product category in various regions (fig-ure 3(5)). This view triggers her to reconsider the products sales comparison that she investigated some time back. She therefore re-visits the comparison view she bookmarked earlier. Then she nar-rows down to the east and south regions (figure 3(6)). This revisit and reuse of a view creates a branch in her action trail.
She further slices the products in the x-axis of the scatterplot by their category; and slices sales in the y-axis of the scatterplot by quarterly period (figure 3(7)). This slicing creates a scatterplot ma-trix showing sales of various product categories in different quar-ters of the year. She finds out that product categories A, C and D have shown profit consistently in the east and south regions. She records this finding using a note. Then, she continues her analysis by studying yearly sales (figure 3(8)) and sales distribution across regions using a map (figure 3(9)).
5.2 Action Concepts as Context
In the products sales use case, the user started her analysis with general sales data and moved on to investigate quarterly and yearly sales trends. Region was another aspect considered in the investi-gation; she focused on all regions, then narrowed down to the east and south regions, and finally moved on to see the actual geograph-ical sales distribution. She also investigated the sales of individual products as well as product categories (groups of products).
The action concepts associated with this action trail (e.g., the east region and product category) correspond to the user’s information interests. However, some of the action concepts were more predom-inant at certain times than others. For instance, she was interested only in sales of more than $50,000 throughout the investigation. In contrast, she shifted her focus among other action concepts such
Figure 2: A user investigating a finance dataset in HARVEST, a web based visual analytics system. (a) The data view shows a visualization created by the steps shown in the user’s action trail (f). (b) A note-taking interface. (c) A ranked list of related notes. (d) Thumbnail of the view displayed while recording those related notes. (e) Related concepts overview - An overview of related entities from notes (underlined) and related action concepts from action trails.
as quarterly sales, product categories, and regions. Her interest in these action concepts varied over time. Therefore, during an explo-ration process, users’ evolving information interests can be viewed as a time-varying set of weighted action concepts taken from their action trails.
A set of weighted action concepts is associated with each view and note to represent its context description. The weight for each action concept represents its degree of salience at the time the view or note was created. The metrics used for calculating the weight from the action trails are motivated by the spreading-activation con-struct that is used in many theories for retrieving information from long term memory [3]. In these theories, knowledge is encoded as a network structure, consisting of nodes representing concepts and links representing associations among concepts. During a re-trieval process, this network structure is used to identify knowledge relevant to a current focus of attention and facilitate processing of associated items. The two basic points emphasized in these theo-ries are (1) activation is modeled as a spreading function, and (2) activation decays exponentially with the distance it spreads over a network structure [3].
5.2.1 Tracing Related Action Concepts
We extract related action concepts for a view or a note by tracing a user’s action trail. A trace spreads through the branching structure of an action trail to reflect that a view or note can be created by a confluence of different lines of inquiry. Hence, we need to deter-mine (1) direction of the trace, and (2) the trace distance for a view or note.
For a view, we extract the related action concepts by back tracing exploration actions in an action trail. Figure 4(a) shows a back trace of exploration actions for a view using the structure of the analyst’s action trail shown in figure 3.
For a note, we determine the direction of the trace, that is, back trace or forward trace or both based on the type of insight behavior being performed by the user. We define six types of note taking based on our observation of how users record notes in Aruvi [17]. In the following, we present the six types of notes and the direction of trace chosen to extract related action concepts for each type of
notes:
Finding Findings are usually obtained after a sequence of explo-ration actions. Hence, a back trace of exploexplo-ration actions will give related action concepts for this note. A note with a link to a view is categorized as a finding.
Hypothesis Users record some assertions or hypotheses that they want to confirm during an investigation. These notes influence subsequent actions. Hence, a forward trace of the exploration actions will give related action concepts for this note. A note without a link to a view is categorized as an hypothesis. Snippet Users can collect some relevant information from outside
a visual analytics system (e.g., a snippet from the internet). In this case, either a sequence of exploration actions might have triggered them to look for some external information or they may be preparing for an investigation by gathering some external information. Hence, in this case, both back trace and forward trace is required to derive related action concepts (fig-ure 3(b)). A note created by copying contents from the inter-net or other digital documents, and without a link to a view is categorized as a snippet.
Edit During the exploration process, users can edit a previously recorded note. In this case, we combine the related action concepts from the previous line of inquiry associated with the note and the related action concepts from the current line of inquiry. Currently, we consider only edits that add a new en-tity or new sentence to the notes.
Reassociation Sometimes, users can remove a link between a note and a visualization and reassociate the note to a new visual-ization. In this case, the related action concepts from the pre-vious line of inquiry are replaced with those from the current line of inquiry.
Multiple Association Some users requested multiple visualiza-tions created at different instance during an analysis to be as-sociated with a note. In this case, the related action concepts from the line of inquires of each visualization are combined.
Figure 3: Part of an action trail for an analyst investigating product sales. Exploration actions are represented with a blue box; insight actions such as bookmarking and note-taking are represented using an orange box; meta-actions such as revisit are represented using a green line with an arrow.
In addition to choosing the trace direction, we must also deter-mine how far to trace along the trail. The boundary of a trace is difficult to determine algorithmically from an action trail because it depends on the semantics and is subjective. Hence we apply a simple threshold to determine the boundary: either untilnunique action concepts are extracted, or when the start or end of an action trail is reached. After experimenting with various values, we use a threshold ofn= 10in our current prototype. Thus, the outcome of the trace is a list of related action concepts from the local neighbor-hood of the action trails.
Figure 4: (a) Back trace of exploration actions for the view 9 in fig-ure 3. (b) Back trace and forward trace of exploration actions for the note N in figure 3. di is the normalized distance of an exploration action (i) from the end of a trace for the current view or note.
5.2.2 Related Action Concept Weight
We derive weights for a set of related action concepts extracted by tracing the action trail based on the following factors:
• Recency
Proximity of an exploration action to a view or a note in an action trail is used to weigh an action concept. In figure 4,di
is the normalized distance of an exploration action (i) from the end of a trace for the current view or note. This normalization compensates for the variation in length for each trace. • Specificity
During an exploration process, analysts may focus on all
val-ues of an attribute (e.g., sales in all regions) or on specific values of those attributes (e.g., sales in the east and south re-gions). Hence, if an action concept references specific values within the dataset, then it is given more weight than those which reference generic characteristics. In our current proto-type, a specific concept is given a specificity weightsc that is twice the weight of a generic concept (e.g., all regions). Based on the factors above, the weightWc for an action conceptc
is as follows Wc=sc× wb× b X i=1 di+wf× f X i=1 di ! ,
wheresc is the specificity weight of the action conceptc;bandf
are the length of the back and forward traces respectively;di is the
normalized distance of an exploration action (i) from the end of a trace for the current view or note; (withdi = 0, ifcis not spec-ified in an exploration action (i));wb andwf are the weights for
back and forward traces respectively; (withwf = 0, for a view or a finding;wb = 0, for a hypothesis). For each note, related ac-tion concepts are extracted and a weight for each acac-tion concept is computed based on the structure of the user’s action trail. As the exploration process evolves, the set of related action concepts for each note and their weights are updated based on the above cate-gories. Our current usage scenario only utilized values of 0 or 1 forwb andwf. However, future scenarios where these weights take
values between 0 and 1 can be easily integrated into our algorithm. 5.3 Entities as Context
In the above use case, the analyst recorded a note (in figure 3) that contains entities such as product categories (A, C & D) and regions (east & south) and relationships among them. These entities and relationships also represent her information interest at the time of recording that note. Thus, entities extracted from notes also rep-resent a user’s information interest in addition to the related action concepts.
We use text analysis tools to extract entities (e.g., people, places, and organizations) from the user’s notes [7]. Often, these entities are of the same types found in the dataset being visualized. An extracted entity has three properties: a type, the covered text and its canonical form. For example, a user might type ‘BOFA’ in a note to refer to ‘Bank of America’. The text analysis tool would detect this phrase as an entity of type ‘Bank’ with covered text ‘BOFA’ and canonical form ‘Bank of America’. For each type, we also defined
a generic canonical form (e.g., ‘Generic Bank’) to capture general references (e.g., ‘Bank’ or ‘Lender’).
A weight can be associated with each entity extracted from a note based on its properties and frequency of occurrence (n) within the note . We associate a weight (we) to the covered texte:we=n, if
eis a canonical form;we= 0.5n, ifeis a type; andwe= 0.75n, ifeis a generic canonical form.
5.4 Retrieving Related Views, Notes and Concepts A view or a note has a context description based on the related action concepts (c) from the action trails and entities (e) extracted from notes. For a given view or a note (B), we can compute a relevance scored(T)to a target view or a note from past analyses (T) as follows d(T) = m X i=1 (WB(ci)×WT(ci)) + p X i=1 (wB(ei)×wT(ei)),
wheremis the number of related action concepts for the base view or note andpis the number of entities from the base note; withn
= 0, ifB is a view;WT(ci) = 0, whenciis not a related action
concept for the target view or note (T); andwT(ei) = 0, whenei
is not an entity of a target note or the note attached to a target view
T. Thus, a ranked list of related views and notes for a given view or note is obtained based on the context descriptions extracted from the action trails.
Next, we derive the related concepts forB. An overview of the related concepts is provided using a tag cloud as shown in fig-ure 2(e). The weights of the action concepts from the context de-scription ofBare used to determine the font height for displaying each action concept in the tag cloud. The weightW(ei)for a entity eiis computed as W(ei) = n X k=1 d(Tk),
wherenis the number of relevant notes.d(Tk) = 0, when the note Tkdoes not contain the entityei.
The weights of the action concepts and entities are normalized before they are used to determine the font height. Entities are un-derlined while action concepts are not unun-derlined. Since concepts can be represented in multiple words, an alternate coloring scheme is used to distinguish concepts in the tag clouds.
In the above use case, when the analyst explores the geographic distribution of the sales (figure 3(9)), we can retrieve related views and notes from her past analysis. Previously, she investigated sales in all regions using a tree map (figure 3(4)). This view may be one of the most relevant views for her investigation on the geographic distribution of the sales. Using the above context-based retrieval algorithm, we retrieve such related views and notes for a given view or note.
6 RECOMMENDINGRELEVANTINFORMATION
Our algorithm can be used to recommend related views, notes and concepts based on a user’s ongoing exploration process. This rec-ommendation can help the user by showing them information they may have overlooked. However, it is also critical to avoid over-whelming the user with too many recommendations. To avoid this, we must automatically recommend only the most relevant informa-tion to balance the cost of distracting their atteninforma-tion.
Of the three components—views, notes and concepts—we argue that notes play the most critical role in connection discovery in vi-sual analysis by acting as a reminder that helps to recall key aspects such as views and concepts during the foraging process (figure 5).
To validate this argument, we interviewed two business analysts who do some visual analysis using simple visualization tools such
Figure 5: Relevant information to connect the dots during the infor-mation foraging process
as Microsoft Excel. Both analysts take notes during the analysis process and refer back to it throughout the analysis, when preparing a report, while sharing analysis with others or when starting a new related analysis. The first analyst stated “I take notes to help me remember what I have learnt. . .I would refer to the notes to figure out what I think and what I do. The notes help me remember how I performed a task during the analytic process, for instance, how I derive this insight, how I generate this chart.”
The second analyst explained that she records how she manipu-lated a dataset along with findings in her notebook. She documents in detail especially when she has to create a report for transferring operations to other analysts. She maintains a big notebook and or-ganizes notes with titles that summarize them. While recording any new findings, she tries to locate earlier notes that are most relevant to the particular topic and just add new findings into the old notes. When she creates the detailed report, it is pretty much like starting a new task from her, because usually she forgets what and how she did the analysis. She says “but I have my initial report to help me remember. It is not easy to remember how I did by just looking at the visualizations in the report. I need to click on a few (spread-sheet) cells to remember what it is about.”
For the two analysts, the notes acts as a bridge between the anal-ysis executed in the system and their cognitive process. The notes act as reminders to key aspects of the exploration process, such as views or concepts. Hence, in our current prototype, we recommend only related notes along with a thumbnail of the visualizations that led to the formulation of those notes during the exploration process. Figure 2 shows recommendations of related notes for the current view (figure 2(a)) based on the user’s current line of inquiry. If the users are interested in locating views and concepts with similar context description, they can explicitly request that information. 7 CONNECTING THEDOTS INHARVEST
We have added our recommendation algorithm to HARVEST [8], a web based visual analytics system that supports exploration of large unstructured datasets. It has an action tracking mechanism that automatically captures and displays (figure 2(f)) user’s analy-sis behavior as an action trail [9]. The implementation of the ex-ploration model based on the action trails in HARVESTis detailed elsewhere in [8]. Using the action trail interface, users can archive their trails, as well as revisit and reuse past views. In addition, we extended HARVESTby adding a new note-taking interface that al-lows users to record notes and organize them into groups and slides (figure 2(b)).
Related notes are surfaced through the note-taking interface. When a user records a note, the system augments it with a con-text description. Then, as the user creates a new view in HARVEST, the recommendation algorithm dynamically derives a context de-scription for the view from the current action trail and compares it with the context descriptions attached to the user’s notes. Based on this comparison, the system computes a relevance score for each note and presents a ranked list of related notes through the note-taking interface (figure 2(c)). A thumbnail of the visualization that was displayed while the user originally recorded each note is also shown (figure 2(d)). An overview of concepts extracted from notes (underlined) and views is shown (figure 2(e)) on-demand. With the note-taking interface, users can either explicitly request related notes at anytime or have the system automatically recommend them after each exploration action.
The integration of our algorithm into the HARVESTsystem al-lows it to dynamically surface the most relevant notes from earlier stages in an analysis as users continue the exploration process. We believe that this related notes recommendation feature in HARVEST
helps users maintain awareness of relevant information and assists in connection discovery during visual analysis.
8 CASESTUDY
We conducted a case study to explore the implications of recom-mending related notes during a visual analysis. We were quite in-terested in looking at the circumstances in which users wanted to access related notes during their tasks. For this, we observed the analysis process of a research analyst working for a major financial services company. He is familiar with data analysis tools such as Microsoft Excel but had never used HARVESTbefore. He investi-gated a financial dataset in HARVESTand recorded notes using its note-taking interface.
The financial dataset consists of around 1000 financial news ar-ticles from the New York Times published between August and September of 2007. These articles were selected from a collec-tion of news and business articles provided by Factiva, a division of Dow Jones & Company. The content of the articles was processed by a text analysis tool to identify key entities in the financial domain such as banks, investment firms, markets (e.g., stock, mortgage, credit, debt), financial instruments (e.g., bonds, securities, funds, etc.), government agencies, important persons, and countries.
The research analyst investigated the financial dataset by ex-ploring the relationships among the entities using visualizations in HARVEST. His investigation spanned for two sessions each last-ing for 30 minutes and one week apart. For the first session, we turned off the recommendation feature and for the second session we turned it on. The analyst was asked to explore the financial dataset and understand the status of the financial sector around the time when the articles were published. He was allowed to explore and analyze data freely without any task restriction. We recom-mended that he make use of the note-taking interface for record-ing hypotheses and discoveries durrecord-ing the analysis. At the end of the sessions, his exploration trail was bookmarked and saved. We closely observed the analyst’s analysis process, and conducted a short interview at the end of each session.
Session 1 - Without related notes recommendation In the first session, the analyst typically alternated between analyz-ing data along different dimensions usanalyz-ing various criteria (by issu-ing queries and interactissu-ing with the visualized results), and takissu-ing notes to record his thoughts and discoveries. He used separate notes to record (1) what he expected to see from the data (hypotheses), and (2) what he actually saw and thought was/were the reason(s) to explain such trend or pattern in the visualizations (findings). He then grouped notes related to the same topic (e.g., about a specific investment firm).
During the first session, the analyst created 10 notes and orga-nized them into 4 groups. Each note had around two sentences. There were five unique action concepts such as person, bank, in-vestment firm, market and financial institution) mentioned in these notes. The total number of action concepts was twenty (including duplicates). There were eleven unique entities such as Greenspan and Lehman in these notes. The total number of entities mentioned in notes was twenty eight (including duplicates).
During an interview held afterwards, the analyst expressed that the note-taking facility was quite useful. We asked further about the usefulness of identifying related notes in the analysis process. He agreed that it would be useful. He stated that he would like the sys-tem to recommend the related notes immediately after the syssys-tem displays the chart of the newly requested data. He indicated that such recommendations will inform him of what has already been
explored, and give him some ideas of how to explore the new re-sult. He also felt it could save time by helping him avoid duplicate work, and by allowing him to start new tasks by building on previ-ous analyses. He felt that these time savings would allow him to go deeper into his analysis.
The analyst also expressed that automatic recommendation of related notes can be useful since he wouldn’t have to spend time reading through all his notes to find the few that might be relevant. It can also help him to aggregate insights and discoveries from pre-vious notes more easily. In addition, he mentioned that he would very much appreciate if the system could recommend related notes from a collection of notes shared among other analysts.
These statements were encouraging and affirmed our approach to surface the related notes during an exploration process. Session 2 - With related notes recommendation
After a week, the analyst continued his analysis of the same Factiva dataset. The archived exploration trail was restored in HARVEST, including the notes previously created by the analyst. We enabled the related notes recommendation in HARVESTduring this session and observed his analysis process. The analyst started by revisiting few previous views using the exploration trail for recalling what he did during the last session. Then he continued to explore the data.
When the system provided a recommendation for the first time, he read the content of the recommended notes carefully. He also tried to identify the states in the action trail that were associated with the notes without revisiting it using the thumbnails. Later, he only glanced over the recommendation list and focused his atten-tion on the recommended notes that were newly added to the list. During this session, he edited four existing notes, all of which were recommended by the system. Four new sentences and two new en-tities were added. Interestingly, he didn’t create any new notes.
After the analysis session, we conducted a short interview to un-derstand how the related notes recommendation in HARVEST im-pacted his analysis. When we asked about the relevancy of the rec-ommend notes, the analyst said “They were relevant in the sense that the concepts mentioned in the recommended notes were re-lated to the data I was inspecting. For example, when I was looking at the information about one bank, the system recommended a note I created previously about another bank, which I thought was use-ful. I think note recommendation could also help me find some of my previous notes related to my current analysis, which I might not realize or totally forget about.”
The analyst liked the thumbnail associated with each recom-mended note because it helped him quickly remember the context of this note. He felt the option of showing/hiding the recommen-dation quite useful and said “. . .so if I didn’t want to be distracted during my data analysis I could always hide it and make it appear later when I needed it.”
Towards the end of the interview, the analyst suggested a few im-provements to the system. He would have liked the related concepts to be highlighted in the recommended notes so he could quickly de-termine if a recommended note is useful or not without having to read through the whole note. He currently felt it was difficult to re-visit views from the notes and to rere-visit notes from the action trail; and asked for an efficient way to revisit visualizations without hav-ing to lose sight on the current analysis process. He also expressed that it would be better if the thumbnail of a chart could be displayed together with a note when it is created, not just when it is recom-mended.
9 DISCUSSION
We performed the case study to understand the circumstances in which related notes recommendation is found to be useful. Initially, we assumed that the recommendation would be relevant only for longer analysis processes with a large number of notes, hence our
study design of two sessions spread out over a week. However, the research analyst who participated in the case study performed the analysis in two short sessions and just recorded 10 notes with rela-tively small action trails. Still, the analyst createdZEROnew notes in the second session, always editing old notes recommended by the system. It is exactly what we want to encourage —‘connections be-tween insights instead of a bunch of small individual insights’. We believe that with the related notes recommendation, users will more often do editing, re-association and multi-association of notes dur-ing an analysis. Thus, the related notes recommendation helps to create awareness of relevant information from the past with respect to the analyst’s current line of inquiry and and encourages connec-tion discovery during visual analysis.
In addition, the identification of related notes and views using the context description provides a new way of retrieving visualization from past or other collaborator’s analysis. This approach, in addi-tion to keyword and view similarity based search methods [18], can help analysts review past analyses.
Retrieval of related items can also be helpful during the sense making process. In HARVEST, we used the context-based retrieval algorithm to recommend related items during the information for-aging process. Whenever analysts created a new view, the related notes, views and concepts are retrieved and shown. Similarly, rec-ommendation of related views, notes and concepts can be made when they select or modify an existing note, related views, notes and concepts to that note can be retrieved. Thus, analysts can lo-cate related notes within the note-taking interface when relevant information is either scattered spatially (in a diagram editor) or dis-tributed in different discussion threads (in forums). After locating the related notes, users may be interested in combining them into a group or a note.
10 CONCLUSION ANDFUTUREWORK
In this paper, we described a context-based retrieval algorithm that retrieves views, notes and concepts from users past analysis related to a view or a note based on their line of inquiry. Whenever users create a view of their data or record a note, we derive a context description for the view or note from their line of inquiry. Our algorithm then uses these context descriptions to retrieve the most relevant views and notes from past analyses.
Using our proposed approach, we have implemented a related notes recommendation feature in HARVEST, a web based visual analytic system. As users create new views during their analysis, HARVEST dynamically applies our algorithm to recommend the most relevant notes from past analyses. An overview of related notes is presented as a ranked list of notes along with a thumbnail of associated views in the note-taking interface. An overview of related concepts is also shown using a tag cloud. Both overviews are updated after each exploration action.
Finally we presented a case study in which a research analyst in-vestigated a dataset using the HARVESTsystem. Our observations of the analyst’s analysis process and his feedback support our argu-ment that the identification of related notes, views and concepts is helpful in connection discovery during visual analysis.
Given our findings, there are several areas for future work. From the navigation structure represented in the action trail, it is possi-ble to identify the relationship among the action concepts. Also, the relationship among entities can be derived based on the spa-tial distribution of notes and text analytics as in some text analysis tools such as Jigsaw [19] and Entity Workspace [1]. Hence, in the future, the relationship among action concepts and entities can be derived from the action trails and studied using interactive graph visualization. We believe this can clearly bring out the information structure that evolves during the user’s exploration process and can provide a better overview of the implicit connections among con-cepts during a visual analysis.
ACKNOWLEDGEMENTS
The authors wish to thank three business analysts who participated in the user study. We thank Jarke J. van Wijk for his valuable sug-gestions and comments.
REFERENCES
[1] E. Bier, S. Card, and J. Bodnar. Entity-based collaboration tools for intelligence analysis. IEEE Symposium on Visual Analytics Science and Technology, pages 99–106, Oct. 2008.
[2] W.-H. Cheng and D. Gotz. Context-based page unit recommenda-tion for web-based sensemaking tasks. InIUI ’09: Proceedingsc of the 13th international conference on Intelligent user interfaces, pages 107–116, New York, NY, USA, 2008. ACM.
[3] A. M. Collins and E. F. Loftus. A spreading-activation theory of se-mantic processing.Psychological Review, 82(6):407–428, November 1975.
[4] N. Cowan. Attention and memory: An integrated framework, vol-ume 26 ofOxford Psychology Series. Oxford University Press, 1998. [5] B. Dervin. An overview of sense-making research: Concepts, meth-ods, and results to date. InInternational Communication Association, Dallas, TX, USA., 1983.
[6] D. Ellis, D. Cox, and K. Hall. A comparison of the information seek-ing patterns of researchers in the physical and social sciences.Journal of Documentation, pages 356–369, 1993.
[7] D. Ferrucci and A. Lally. UIMA: an architectural approach to unstruc-tured information processing in the corporate research environment.
Natural Language Engineering, 10(3-4):327–348, 2004.
[8] D. Gotz, Z. Wen, J. Lu, P. Kissa, M. X. Zhou, N. Cao, W. H. Qian, and S. X. Lui. HARVEST- visualization and analysis for the masses.
IEEE InfoVis, Poster, 2008.
[9] D. Gotz and M. Zhou. Characterizing users visual analytic activity for insight provenance.IEEE Symposium on Visual Analytics Science and Technology, pages 123–130, Oct. 2008.
[10] J. Heer and M. Agrawala. Design considerations for collaborative visual analytics.Information Visualization, 7:49–62, 2008.
[11] J. Heer, F. B. Vi´egas, and M. Wattenberg. Voyagers and voyeurs: supporting asynchronous collaborative information visualization. In
CHI ’07: Proceedings of the SIGCHI conference on Human factors in computing systems, pages 1029–1038. ACM Press, 2007.
[12] E. Hutchins. Cognition in the Wild. MIT Press, Cambridge, MA, USA., 1994.
[13] i2 Analyst’s Notebook. http://www.i2inc.com/, 2009.
[14] C. C. Kuhlthau. Inside the search process: Information seeking from the users perspective.Journal of the American Society for Information Science, 42:361–371, 1991.
[15] D. A. Norman. Learning and Memory. W. H. Freeman & Co., New York, NY, USA, 1982.
[16] P. Pirolli and S. Card. The sensemaking process and leverage points for analyst technology as identified through cognitive task analysis. In
International Conference on Intelligence Analysis, May 2–4 2005. [17] Y. B. Shrinivasan and J. J. van Wijk. Supporting the analytical
rea-soning process in information visualization. InCHI ’08: Proceeding of the twenty-sixth annual SIGCHI conference on Human factors in computing systems, pages 1237–1246, New York, NY, USA, 2008. ACM.
[18] Y. B. Shrinivasan and J. J. van Wijk. Supporting exploration awareness in information visualization. To appear in IEEE Computer Graphics and Applications Special Issue on Collaborative Visualization, 29(5), September 2009.
[19] J. Stasko, C. Gorg, Z. Liu, and K. Singhal. Jigsaw: Supporting in-vestigative analysis through interactive visualization. IEEE Sympo-sium on Visual Analytics Science and Technology, pages 131–138, 30 2007-Nov. 1 2007.
[20] P. C. Wong, G. Chin, H. Foote, P. Mackey, and J. Thomas. Have Green - a visual analytics framework for large semantic graphs.IEEE Symposium on Visual Analytics Science And Technology, pages 67–74, 31 2006-Nov. 2 2006.