If Your Version Control System Could Talk ...
Thomas Ball
Jung-Min Kim Adam A. Porter
Harvey P. Siy
Bell Laboratories
Dept. of Computer Sciences
Bell Laboratories
Lucent Technologies
University of Maryland
Lucent Technologies
[email protected]
[email protected]
[email protected]
Abstract
Version control systems (VCSs) are used to store and reconstruct past versions of program source code. As a by-product they also capture a great deal of contextual information about each change. We will illustrate some ways to use this information to better understand a program's development history.
1 Introduction
There are many software-based metrics that one may use to assess the state of a software system. For ex-ample, the McCabe[7] and Halstead[4] software com-plexity metrics measure aspects of the structure of a static snapshot of source code to estimate its complex-ity. By measuring how these metrics change over time, the hope is that one can identify \decaying" compo-nents of a software system that, if restructured, may reduce the development eort needed to maintain and extend the system.
Such analyses depend on the ability to recreate snap-shots of the software at dierent points in time. A ver-sion control system (VCS) tracks each change a devel-oper makes to the system and, as a result, can recreate a consistent snapshot at any point in time. Examples of VCSs include RCS[10] and SCCS[9]. While this basic functionality of VCSs is essential for version control and measuring the evolution of metrics over time, there is much data in a VCS that is ignored when simply using it to extract snapshots of source code.
In this paper, we will examine some of the rich struc-ture in version control data and show how analysis of version control data can illuminate the software devel-opment process in new ways. A VCS tags each change with a substantial amount of additional contextual in-formation. Knowing what code was changed, when it was changed, who made the change, and so on, can yield valuable insights into what actually went on in the course of code development, sometimes better than
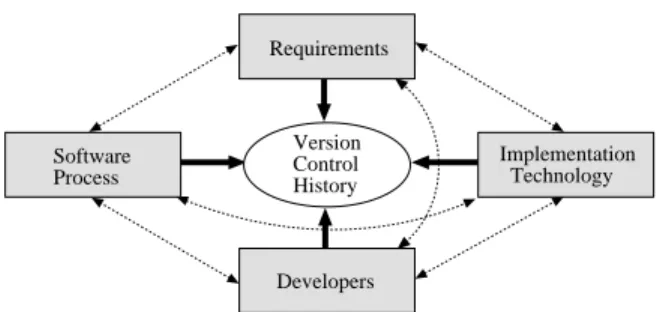
Requirements Software Process Implementation Technology Developers Version Control History
Figure 1: Version control history captures interactions between various aspects of software development. developers' memories. VCS data is amenable to com-pletely automated analysis, just as a snapshot of source code is amenable to metric analysis. Most software development organizations employ some form of VCS. Thus the methods we will outline here have wide appli-cability to many software projects.
Our framework is to use the data in a VCS (referred to as the version control history), in addition to the source code itself, to explore the relationships between various aspects of software development. For example, the requirements of the software, the implementation technology used, development process followed, and the organization of the developers have some eect on how the software evolved. Figure 1 illustrates the idea.
Each of these characteristics is a particular view of software development, with its own constraints and im-pact. Our thesis is that interactions between these views can impact the ecient production of software and that the version history data captured in a VCS provides a good starting point for exploring many of these relationships. In our particular example, we will examine some interesting relationships between the re-quirements of an optimizing compiler, the implementa-tion technology of C++, and the desire to have devel-opers work in parallel. We will examine these relation-ships using visualizations automatically generated from the VCS data.
2 Version Control Data
We present a very simplied description of some ba-sic data collected by a VCS. Most VCSs operate over a set of les containing the text lines of source code. An atomic change to the program text is captured by recording the lines that were deleted and those that were added in order to make the change. This informa-tion is usually computed by a le dierencing algorithm (such as Unix di), which compares the previous ver-sion of a le with the current verver-sion. Each change has associated with it the le that was changed, the time the change was recorded by the VCS, and the name and login id of the programmer who made it, at a minimum. In order to make a change to a software system, a developer may have to modify many program entities in many les. Most VCSs have the ability to track a group of related changes via a modication record (MR), which captures the fact that these changes were made for a specic purpose and are thus semantically related. An MR may have an English abstract associated with it that the developer provides, describing the purpose of the change. An MR also may have other data, such as it's opening time, closing time, and other status in-formation (approved, rejected).
An MR is a set of atomic changes and every atomic change has some MR associated with it. Thus, every line of text in any source code snapshot has associated with it: time of change, developer name and login, MR and related data. By analyzing the source code to iden-tify functions, classes or other program entities, we can then associate the VCS data with these entities as well as with source lines.
3 The Project Under Study
We present a brief overview of the project under study. More details may be found in Ladd and Ramming[6].
The 5ESSTM
is Lucent Technologies' agship local/toll switching system, containing an estimated 10 million lines of code in product and support tools. At the heart of the 5ESS software is a distributed relational database with information about hardware connections, software conguration, and customers. For the switch to function properly, this data must conform to cer-tain integrity constraints. Some of these are logical constraints; for example, \call waiting and call forward-ing/busy should never be active on the same line." Other constraints exist to document data design choices (re-dundancy, functional dependencies, distribution rules) that support ecient 5ESS operation and call process-ing.
PRL5[5] is a declarative SQL-like language, created to specify these data integrity constraints. PRL5
spec-ications are translated automatically into data audits and transaction guards in C, which is then compiled on multiple platforms. Due to the constantly changing integrity constraints to be provided to dierent commu-nication service providers worldwide, compilation speed was crucial. The generated C code also had to be opti-mized to make as few disk accesses as possible.
A compiler for PRL5 called P5CC (PRL5 to C Com-piler) was developed in C++. The compiler follows traditional compiler structure and includes lexing, pars-ing, semantic and type checkpars-ing, optimization, and code generation phases. The lexing and parsing phases pro-duce an abstract syntax tree (AST) over which the other phases operate.
For this compiler project, we have chosen to study the following views:
Requirements. Build an optimizing compiler for a
declarative SQL-like language
Developers. Team of 6 developers who have to
coordinate with each other
Implementation technology. The C++ language Software process. Many, but not all components
built in parallel.
4 Insights Into Compiler Development
The P5CC compiler is written in C++, using approxi-mately 275 classes. Multiple inheritance is not used, so the class inheritance relationship is tree structured. Ap-proximately, 120 of these classes are small stub classes generated via macros. We partitioned the classes into 5 basic groups (excluding miscellaneous support classes):
Top: the top level classes. That is, the classes not
directly related to any language entity, but used primarily as base classes;
SymTab: symbol table classes representing a PRL5
language construct or type;
AST: abstract syntax tree (AST) classes;
Optim: classes that apply optimization
transfor-mations to the abstract syntax tree;
Quads: code generation classes;
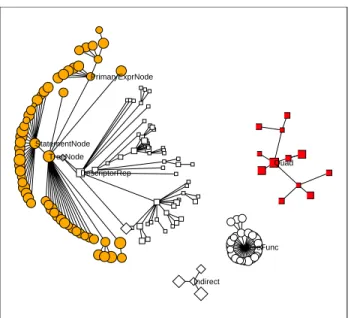
Each modication to the P5CC compiler is recorded in a VCS known as ECMS (the Extended Change Man-agement System). Our analysis is based on 750 MR's. For each class, we computed how many MRs modied it. Figure 2 shows the inheritance hierarchy of the P5CC classes. The area of a node is proportional to the log of the number of MRs that modied the corresponding class. A node is only shown if there was an MR touching
TreeNode PrimaryExprNode StatementNode Quad TreeFunc DescriptorRep Indirect
Figure 2: The class inheritance hierarchy of the P5CC com-piler, where the size of a node is proportional to the log of the number of MRs that touch the class. The shape of the node represents its class group as follow: Top { diamonds, SymTab { unlled square, AST { lled circle, Optim { unlled circle, Quads { lled squares.
it; this is the reason that the number of Quads classes is so small{most of the classes are generated by macros and are never modied by hand.
It is clear from this gure that most of the change activity was related to the AST. Keep in mind that the AST code does much more than simply maintain a tree data structure. Member functions of the AST classes are responsible for many compilation phases, such as type checking, code generation, etc. In an imperative language such as C, one might encapsulate type check-ing in a module that takes an AST as input and tra-verses it to perform the type checking. However, in an object-oriented language such as C++, the function of type checking is more naturally expressed as a method of the AST classes.
In the P5CC compiler, the member functions of the AST classes are divided among les according to their functionality. For example, all the member functions for type checking can be found in a particular set of les, while member functions for code generation can be found in another le set. The left panel in Fig-ure 3 makes this clear, using the SeeSoft code visualiza-tion [1]. Each rectangle represents a le from the com-piler. Only les containing code from the AST classes are shown. Each class is given a level of gray from the gray scale spectrum on the left, and each line of
a le is colored to show which class it belongs to. As is clear from the picture, each le contains code from many classes. Note, for example, the les containing a gray scale spectrum. These les group members func-tions from many dierent classes in the AST that con-stitute a particular phase of the compiler (such as type checking or code generation).
There is a very good reason to divide classes into les by functionality. Centralizing too much functionality in one set of classes can impede concurrent development. By splitting member functions of the same class across dierent les, dierent programmers can work on dier-ent aspects of the compiler. The right panel in Figure 3 shows which programmers worked on which les. This data is derived from ECMS: every MR is owned by ex-actly one programmer, so the code for that MR can be traced to an individual. It is clear that certain program-mers had ownership of particular aspects of the compiler and AST classes, although most les have accumulated modications by several programmers.
This partitioning illustrates the complex relation-ships among the views we are examining. For example, compiler literature[8] suggests that when prototyping a new programming language, it is useful to implement compiler phases as member functions of each AST class. To add new language constructs, one simply adds new classes to the set of AST classes. On the other hand, for a mature language, it is useful to implement compiler phases as modules that transform or operate over an abstract data type representing an AST. This makes it easier to add new optimizing passes to the compiler.
Since PRL5 was changing during the compiler's de-velopment, an OO approach would appear to make sense (the inheritance hierarchy acts as a built-in switch state-ment and virtual functions help avoid writing identical functions in all classes within a inheritance hierarchy). However, the developers' work assignments mimic'd the second approach. That is, each developer implemented a specic compiler phase for all AST classes. In the end, the compiler phases were incorporated into the mem-ber functions of the AST classes, but, during develop-ment, member functions with similar functionality were grouped together into separate les.
One goal of our research is to better understand the eect that development decisions, such as these, have on the evolution of software systems. In the next section we discuss some preliminary approaches for analyzing the relationship between development approaches and a system's change history.
umberChanges MR Date NestingLevel Subject Inspect ClassReturnNode values 93/93/93 lines29482/29482/29482 files 45/45/45 Subject 1 Subject 2 Subject 3 Subject 4 Subject 5 Subject 6 umberChanges MR Date NestingLevel SubjectSubject 4 Inspect Class values 6/6/6 lines29482/29482/29482 files 45/45/45
Figure 3: Two SeeSoft views of the les comprising the abstract syntax tree classes of the P5CC compiler. In the view to the left, each class maps to a level of gray in the gray scale spectrum on the left and each line of a le is colored with the class it belongs to. The view on the right shows the same set of les, where each line of a le is colored by programmer (there are six programmers).
TreeNode
Quad
DescriptorRep
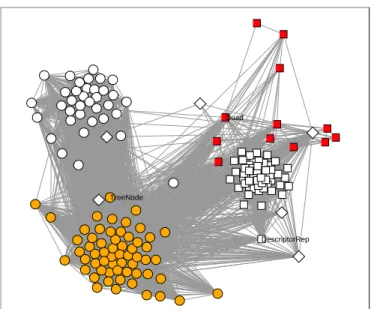
Figure 4: Cluster analysis of classes based on MR relationships. Each node representing a class is colored by the group of the class (same color and shape as in Figure 2). Nodes closer together are joined by links of higher probability. The clustering analysis has dened the ve class groups.
5 Cluster Analysis of Classes by
Modica-tion
One way to help understand the eects of a develop-ment decision on system evolution is to examine the system's change history. In this example we describe initial explorations of how the class structure of this system encapsulated changes to it.
For each classC, letCmrbe the number of MRs that
touch class C. If C and D are two unique classes, let CDmr be the number of MRs that touch both classes CandD. CDmrdenes a relationship between the two
classes, which translates to a link in a graph where the nodes are classes. A probability measure can also be associated with the link:
CDmr=
p
CmrDmr
If the classesCandDare always modied together, the
link probability will be 1, since Cmr =Dmr = CDmr
in this case. However, if C and D are rarely modied
together in comparison to the total number of modi-cations to C or D, then the link probability will be
low.
We generated this data for the current version of the P5CC compiler and ran it through a graph cluster-ing algorithm which places nodes connected by links of higher weight closer together. We used the probabil-ity measure described above for the link weighting. For details on this algorithm, see [3].
rep-resents a class. The shape of a node denotes the group that the class belongs to, as in Figure 2. Note that the clustering algorithm has identied clusters of se-mantically related classes. In fact, it identied the ve basic partitions described earlier! The cluster of round lled nodes on the lower left are the AST classes, while the cluster of white square nodes on the right are the SymTab classes. The cluster on the upper left is the Optim group. The group of lled square nodes above the symbol table cluster represents the Quads group. In this example, all links between classes of dierent groups had probabilities less than 40the same group had higher probability.
This gure shows that changes to the AST classes often involved other changes to the Optim and SymTab groups. However, as expected, there are very few links between the Optim and SymTab groups.
Based on this initial analysis, we are currently ex-amining the types of changes that are made between classes within the same hierarchy. If they are mainly changes involving the same member function across dif-ferent classes, then it argues that the class partitioning was not eective. In addition, we are examining similar views for le partitioning.
6 Summary
The thesis of this research is that version control sys-tems contain signicant amounts of data that could be exploited in the study of system evolution. We have il-lustrated some ways to use this information. In partic-ular we have derived VCS-related metrics, like connec-tion strength based on the probability that two classes are modied together. We used this metric to assess the eect of implementation decisions on the evolution of the resulting software.
Clearly, this work is in its initial stages. We are currently exploring several extensions to it.
Time-series analysis. Most metric work is based
on a single snapshot of a system. Little work has explored metrics to capture how structure changes over long periods of time.
Improved analysis models. This work implicitly
treats aspects of the change history as dependent variables and aspects of development history as in-dependent variables. Our initial work has looked at only a few variables. For example, we have looked at number of changes per class as a de-pendent variable. In our ongoing work we will re-ne this variable, looking at the type of changes, change eort, and whether the change was actu-ally approved or had to be reworked. We will also examine complex changes, i.e., those that involve
multiple developers, multiple classes, and multiple functions.
Examining development processes. We can also
examine issues related to the development process. For example, are defects discovered during inspec-tion dierent in nature than those discovered dur-ing testdur-ing? We can also look at the eect of devel-opment decisions on criteria such as develdevel-opment interval.
Improved visualization techniques. The
visualiza-tions we show in this paper are obviously static. Since we are inherently interested in system behav-ior over time we expect that visualizations must improve to capture this. Some possibilities include Trellis displays[2] and animation.
Static program analysis. The change history
pro-vides information about how dierent parts of a system are related. This information may be use-ful for automatic restructuring.
References
[1] T. Ball and S. G. Eick. Software visualization in the large.IEEE
Computer, 29(4):33{43, April 1996.
[2] William S. Cleveland.Visualizing Data. Hobart Press, 1993.
[3] Stephen G. Eick and Graham J. Wills. Navigating large networks
with hierarchies. InVisualization '93 Conference Proceedings,
pages 204{210, San Jose, California, Oct. 1993.
[4] Maurice H. Halstead.Elements of Software Science. Elsevier {
North Holland, 1979.
[5] David A. Ladd and J. Christopher Ramming. Software research
and switch software. InInternational Conference on
Commu-nications Technology, Beijing, China, 1992.
[6] David A. Ladd and J. Christopher Ramming. Two application
languages in software production. InUSENIX Symposium on
Very-High-Level Languages, Oct. 1994.
[7] Thomas J. McCabe. A complexity measure. IEEE Trans. on
Software Engineering, 2(4):308{320, Dec. 1976.
[8] Martin Odersky and Philip Wadler. Pizza into Java:
Translat-ing theory into practice. InConference Record of 1997 ACM
Symposium on Principles of Programming Languages, pages 146{159, Paris, France, Jan. 1997.
[9] Marc J. Rochkind. The Source Code Control System. IEEE
Trans. on Software Engineering, SE-1(4):364{370, December 1975.
[10] Walter Tichy. Design, implementation and evaluation of a
revi-sion control system. InProceedings of the 6th International
Conference on Software Engineering, pages 58{67, Tokyo, Japan, Sept. 1982.