Université Bretagne Sud - Centre de Recherche C. HUYGENS Rue de Saint-Maudé, 56321 Lorient, FRANCE
Master’s thesis
Dynamic life cycle assessment to compare conventional and
bio-based building construction impact on global warming
Aalto University School of Science
Master’s Programme in Advanced Materials for
Innovation and Sustainability (AMIS) Academic year 2018-2019
Internship supervisor: M. Thibaut Lecompte
M. Arthur Hellouin de Mennibus
Vladimir ZIEGER Referent Professor: M. Robin Ras
“Each generation doubtless feels called upon to reform the world. Mine knows that it will not reform it, but its task is perhaps even greater. It consists in preventing the world from destroying itself.”
Abstract
In a context of climate emergency, storing temporarily carbon in biogenic construction materials seems a particularly attractive strategy to mitigate important building sector impact on global warming. Usually, environmental impacts are assessed using standard Life Cycle Assessment (LCA), a product-based method that gives notably the global warming potential (GWP). In LCA, all greenhouse gas emissions linked to the product are assumed to be released in the first year even if they are emitted at different times within the chosen time horizon. Their GWP is calculated at this time horizon, which is usually 100 years. Moreover, biogenic carbon is often excluded of the calculation assuming a balance between captured and emitted carbon. On the other hand, new global warming impact calculation methods such as dynamic LCA propose to include timing in the calculation and to assess the value of temporarily storing carbon in long-lived products such as building structures.
The aim of this study was to investigate the impact of these hypotheses on the estimated GWP of building materials, by comparing the static and a dynamic LCA approach.
Two types of exterior walls were compared: one made with conventional materials (concrete and glass wool), the other mostly composed of bio-based materials such as straw and timber. Several parameters are discussed in detail: the real lifespan of buildings in France, carbon storage by forests and annual crops, the time horizon used to calculate GWP, the different greenhouse gases emitted, the accuracy of CO2
equivalent as an indicator of global warming. Finally, the overall impact on the global warming of different building construction and renovation materials is estimated under different scenarios applied to the French context.
Acknowledgements
I would like to acknowledge M. Thibaut Lecompte, Senior Lecturer at the Université Bretagne Sud, for his time, his advices and the great conversations ourhad together.
I also would like to acknowledge, M. Arthur Hellouin de Menibus, who gave me very interesting post-master thesis perspectives. He encourages me to continue my way with a civic service in eco-construction.
A special thanks to my colleagues Theo Vinceslas, Yann Guévec, Julien Troufflard, Luc Grasson, with whom I had very funny discussions as well as serious one about nonsenses in our society. Thanks to them I had a great time in Lorient.
Lastly, I would like to acknowledge my referent professors: Mrs Erini Sarigiannidou (Phelma – Grenoble INP), M. Robin Ras and Janne Halme (Aalto University). They all are close to their students, which is very pleasant. They put a lot of energy to make this new AMIS master on a great way.
Presentation of the institute
The IRDL is located in Brittany, France. It is a research institute coming from the consortium of an engineering material laboratory and a mechanics and systems laboratory. This bring together all the necessary competences from the sample to the big structure, especially for the shipbuilding sector and marine energy. IRDL had in 2018, 110 lecturers, 120 doctoral students, 10 post-doctoral researchers as well as 55 engineers, technicians or administrative personnel. Researches conducted by IRDL are separated into five complementary and multidisciplinary topics:
- Composites, nanocomposites, biocomposites - Multi-materials assembling
- Durability of heterogeneous materials - Energetical systems
Table of contents
Introduction ... 1
1. Bibliographic review ... 4
1.1 Housing stock in France ... 4
1.2 Building lifespan and in-service life of products and systems ... 5
1.3 Greenhouse gas dynamics linked to bio-based materials ... 7
1.4 Carbonation process ... 9
2. Methods ... 12
2.1 Life cycle assessment (LCA) ... 12
2.2 Dynamic LCA (dLCA) ... 13
2.3 Simplified dLCA ... 15
3. Experimental ... 17
3.1 Functional unit and system definition & boundaries ... 17
3.2 Walls under study ... 18
4. Results ... 28
4.1 Standard LCA ... 28
4.2 Dynamic LCA ... 30
5. Discussion ... 37
5.1 Comparison of results obtained with static LCA, dLCA and simplified dLCA .. 37
5.2 Remark on the limits of carbon analysis of biogenic materials ... 39
5.3 Impact of a change of practice towards biobased walls in the French building sector ... 40
5.4 Available resources: timber from sustainable managed forest and/or annual
plants? ... 44
Conclusion ... 47
References ... 50
List of the symbols and abbreviations
CaO Calcium oxide
CH4 Methane
CO Carbon monoxide
CO2 Carbon dioxide
CO2e Carbon dioxide equivalent dLCA Dynamic life cycle analysis DOC Degradable organic carbon
DOCf Degradable organic carbon fraction EoL End of life
EPD Environmental Product Declarations
EU European Union
FU Functional unit
GHG Greenhouse gases
GWIinst Instantaneous global warming impact GWIcum Cumulative global warming impact GWP Global warming potential
GWP100 Global warming potential at the 100-year time horizon LCA Life cycle assessment
MCF Methane correction factor N2O Dinitrogen oxide
R Thermal resistance
RF Radiative forcing SF6 Sulphur hexafluoride SWDS Solid waste disposal site
List of Figures
Figure 1 : Planetary Boundaries (from [5]) ... 1 Figure 2 : Lashof method example: instantaneous impact for the emission of 1 kg of CO2 at year 1 or year 71, and a time horizon of 100 years. ... 14 Figure 3: Radiative forcing of 1 kg of CO2 emitted at year 1 or year 25 to determine correction factors at a 100-year time horizon in simplified dLCA ... 16 Figure 4 : System boundaries of the LCA model for the two types of walls ... 18 Figure 5: Wall compositions referring to Table 3; conventional wall (left), biosourced wall (right) ... 21 Figure 6: comparison between concrete production processes in Ecoinvent 3.2, a reconstituted concrete and mean impact found in the literature review. ... 23 Figure 7: Results of standard LCA for (a) a conventional wall and (b) a biobased wall using EPD or Ecoinvent data, with details of the impacts of materials processes - (in the biobased wall 50% of the straw is composted and 50% is incinerated) ... 29 Figure 8: dLCA of biobased and conventional scenarios from the Functional Unit .. 32 Figure 10 : comparison of construction and demolition at one site of biobased and conventional housing with a 50- or 100-year lifespan over a 300-year time period 33 Figure 11 : Instantaneous and cumulative radiative forcing in the EPD and Ecoinvent scenarios. 75-year life span of housing - CO2e data used for Ecoinvent scenarios .. 34 Figure 12 : Influence of CO2e and differentiated GHG Ecoinvent emissions data on dLCA for conventional and biobased - 75 years lifetime housing. ... 35
Figure 13: “GWP100” comparison of conventional and biobased walls using the 3
assessment methods and a 75-year life span for housing. CO2e data were used for Ecoinvent scenarios. ... 39 Figure 14: Instantaneous radiative forcing over a period of 500 years for conventional and biobased walls and their linearization (left), and difference between the two impacts (right). ... 43
List of Tables
Table 1: Overview of the current French building stock [12], [25], [26] ... 5 Table 2 : Impact of shifting of 1 kg of CO2 GWP adjusted to a 100-year time horizon. The original table from [69] is in Appendix 3 ... 16 Table 3: Materials inventory for the two types of wall construction according to Ecoinvent database and literature - Ecoinvent scenario ... 21 Table 4: Processes chosen in Ecoinvent 3.2 to ensure their impact matches the literature review ... 22 Table 5: GHG emissions during the manufacturing of building materials (GWP at the 100-year horizon [59]: CO2 = 1, CH4=29.7, N20=264.8, CO=4.06, SF6=23506.8). * mean carbon storage is not shown here ... 25 Table 6: CO2, CH4 and N20 emission scenarios (min and max) for composted straw and landfilled wood, both with 15% moisture content, at a 100-year time horizon. Details can be found in Appendix 2 ... 27 Table 7 : Outcome of wood and straw biogenic carbon sequestration and emission for the FU ... 30
Table 8: relative Global Warming Potential calculated as “static” with LCA or “dynamic” with dLCA -75 years lifetime housing (straw’s EoL is here 50% composted
- 50% incinerated). ... 36 Table 9: Impact of conventional and biobased construction from Table 8 and deduction of saved CO2 emissions over the life cycle if 20% or 50% of yearly
construction were biobased instead of conventional. ... 42 Table 10: Radiative forcing (RF) saved if 100% of practices change to biobased wall, if 100% of the housing stock is biobased, this means it is passive. (38.106 m² are built
per year, the stock extends over 2011.106 m²; French RF=0.023 W/m²; French
building sector RF=0.0053 W/m²) ... 44 Table 11: yield per hectare and carbon storage in bio-sourced materials used for construction in France ... 46
1
Introduction
As the Great Acceleration study showed, we are living an exponential period of : energy use, population, GDP, transportation, fertilizer consumption, greenhouse gases emissions, tropical forest loss and so on [1]. Environmental limits within which humanity can safely operate are getting crossed (see Figure 1). Our global industrialized civilization is too complex, generates too much pollution, and is then likely in an already begun process of collapse ([2]–[4]).
Figure 1 : Planetary Boundaries (from [5])
Global warming is one increasing risk parameter to deal with. In this context, European Union (EU) has signed the Paris Agreement at COP21. EU members
recognised the need to “hold the increase in the global average temperature to well
below 2°C above pre-industrial levels and pursue efforts to limit the temperature
increase to 1.5 °C”, that “sustainable lifestyles and sustainable patterns of
consumption and production [...] play an important role in addressing climate
change” and aimed to “achieve a balance between anthropogenic emissions by sources and removals by sinks of greenhouse gases in the second half of this century”
2
[6]. The EU has made quantified commitments such as at least 40 % cuts in greenhouse gas emissions (from 1990 levels) for the year 2030. France being part of it, has set objective to be carbon neutral by 2050, meaning reduce GHG emissions by 6 to 7 [7].
The building sector is a big contributor to global warming: worldwide, it consumes 30-40% of primary energy and contributes up to one-third of GHG emissions ([8]–
[10]). In France, this sector represents 43% of French energy consumption (660 TWh), and around 25% of carbon dioxide (CO2) emissions [4], [5]. Including both
construction and demolition, it accounts for 50% of all natural resources exploited, 40% of the waste produced and 16% of the water consumed [6].
The French metropolitan housing stock comprises around 34.5 million houses, of which 56% are individual homes and 44% are collective [1]. More than half were built before the first French thermal building regulations were introduced in 1974 [11], [12]. In addition, the tertiary activity park extends over more than 800 million m², one third of the total housing stock area ([12]–[14]).
Building new buildings and undertaking energy efficiency renovation of existing buildings will require a significant amount of work and the construction materials, together with their global warming impact (GWI) due to greenhouse gas emission from embodied energy need to be calculated. The embodied energy of a building material is the total energy consumed for its production, use and disposal, from the extraction of the raw materials to the end-of-life treatment. The embodied energy of a building technology is the embodied energy’s sum of its components, plus the
energy needed for transportation and construction/destruction.
The building sector is then a key sector in terms of mitigation potential. For this reason, biogenic materials have been identified by the French government as a sector to be developed, notably because it is able to reduce fossil origin raw material consumption, to capture emitted carbon and to create new economic fields [15].
3
Wood and straw products used in bio-based construction enable carbon storage due to photosynthesis. The proportion of carbon that may be released at the end of life, for instance if the materials are burned, is called temporarily stored carbon.
The global warming potential (GWP) of products or systems is calculated using Life Cycle Assessment (LCA). However, the main problem with this method is that it does not take the time scale into consideration: emissions within a set time horizon are treated equally. According to the the same logic, biogenic CO2 is generally considered
to be climate neutral, i.e. for wood there is balance between carbon sequestration at forest level and re-emission at end of life (EoL) of wood products [16], [17], and for straw short biomass cycle do not alter natural carbon cycle [18]. Temporary storage of carbon is totally neglected. Different authors have addressed these issues [19]–
[21]. Levasseur et al. ([22], [23]) used an interesting dynamic LCA (dLCA) methodology based on timing the capture and emission of greenhouse gases (GHG) on a year-by-year basis.
Robust methodologies are required to evaluate the environmental impacts of different materials for design guidance. In the present work, three different methods are compared: static LCA, dynamic LCA and simplified dynamic LCA. The three methods are applied to two walls, one representative of conventional building, and one composed of biobased materials (straw and timber). The present analysis focusses on the global warming potential (GWP). The results of the comparison of three LCA methodologies are discussed in terms of the lifespan of buildings, the time horizon at which GWP is calculated and the accuracy of CO2 equivalent as an indicator
of global warming. Then, the impact of different French strategies regarding the use of bio-based materials in buildings is evaluated.
4
1.
Bibliographic review
First, the French building context is presented to better understand the current needs of the sector. Then, data were collected to investigate whether a lifespan of 50 years for a building is representative of the real situation. Finally, reviews on carbon sequestration of timber and straw as well as GHG emissions due to decay of these biogenic materials and to cement and lime carbonation were done to properly assess carbon storage and release dynamics.
1.1 Housing stock in France
Currently, concrete buildings are very much the rule and the use of bio-sourced materials is exceptional in the building sector. In terms of structure, wood construction only accounts for 9% of new individual houses and 4% of new collective housing [24], only 7% of insulating materials are bio-sourced (50% are mineral wool and 40% are plastic foam). Table 1 gives an overview of the current building stock in France.
5
Table 1: Overview of the current French building stock [12], [25], [26]
Construction types
Number of existing
buildings
Construction period of existing housings
before 1948 1948-1974 1974-2000 after 2000 Residential (70% of the floor area - 2011.106 m² of which 33,8.106 m² built in 2017 (+1.7%)) Individual houses 19 million 33% 22% 33% 12% Collective housing 15 million 28% 41% 23% 8% Tertiary
(30% of the floor area - 862 106 m² of which 25.106 m² built in 2017 (+2.9%)) 1.46 million (before 1960) 10% (1960-1974) 35% 43% 12%
Mean area of houses 75 m² 75 m² 82 m² 80 m²
Main materials used in the respective time periods
Stone; solid brick; adobe ; timber frame
+ earth.
Stone ; solid and hollow brick ; Hollow concrete
block
Hollow concrete block Hollow and solid brick
Main insulating materials none Mineral wools
Synthetic foams Proportion of inefficiently
insulated houses (F and G in the Energy
Efficiency Rating)
Individual
houses 26% 44% 17% 2%
Collective
housing 38% 30% 11% 13%
1.2 Building lifespan and in-service life of products and systems
The longer the lifespan of a product or a building, the longer biogenic materials temporarily store the carbon, and the less petro-sourced materials are used. This parameter thus requires particular attention in LCA.The main issue is that estimating
a building’s lifespan does not only depend on ageing of the structure but also on social and aesthetic considerations. Data were gathered to evaluate if building lifespan of 50 years is a figure representative of the real situation.
The average increase in the construction of housing in France in the last 20 years has been about 1% [25]. Hence the replacement rate of existing buildings is around 0.7% of the housing stock, which represents 70% of the floor surface (see Table 1).
6
Assuming the average growth rate remains constant, the building stock will be completely renewed in 90 years, which can be considered as representative of the lifespan of a building. Another way to estimate the lifespan is the average age of existing buildings. In France, this is about 50 years ([25], [27], [28]), which means the average lifespan is clearly more than 50 years. In addition, two studies conducted in Norway propose a statistical way to define the lifespan: a Weibull distribution for housing with a lifespan of between 40 and 300 years, a median value of 100 years and a mean of 125 years ([29], [30]).
It thus seems reasonable to prescribe a lifespan of 50 years for tertiary buildings (offices and shops) and a lifespan of 100 years for residential buildings. Administrative buildings (town halls, libraries, museums) are generally thought to last more than 150 years. For unspecified buildings, a default value of 75 years is assigned.
During a building’s lifetime, the building materials will be changed, i.e., they have an in-service life. Brand theorized the notion of shearing layers of change: because of the different rates of change of its components, a building is always tearing itself apart [31]. He proposed “the six S’s”:
- Site which outlasts generations of buildings;
- Structure (foundation and load-bearing elements) whose lifetime ranges from 30 to 300 years;
- Skin which consist of exterior surfaces. They last around 20 years to keep pace with technology and trends;
- Services : electrical and communications wires, fluid network which last between 7 to 15 years ;
- Space plan : interior facings and non-load-bearing partitions. They last 3 years in commercial spaces and up to 30 in individual houses ;
- Stuff: chairs, desk, phones, pictures, kitchen appliances, lamps, and furniture that have high turnovers.
The lifespan of the component materials used in the types of wall studied here are inspired by this layer approach and their impacts are counted as many times as they
7
are replaced. As a building, they have both a physical lifespan and an in-service lifespan, the latter being shorter. The in-service lifespans is defined as follows:
- 100 years for the structure (concrete or timber beam);
- 50 years for the insulator (glass wool or straw bale compressed by timber battens) as well as for gypsum plasterboard;
- 25 years for renders made of cement, lime or earth; - 15 years for the paint.
1.3 Greenhouse gas dynamics linked to bio-based materials
1.3.1 Carbon sequestration
Biogenic materials play a fundamental role in the carbon sequestration, since the biomass absorbs carbon dioxide (CO2) during plant growth due to photosynthesis.
One kilogram of straw can sequester 1.34 to 1.5 kgCO2 ([32], [33]) and additional
literature data are summarized in Appendix 1. A straw carbon content of 45% is here considered. With 15% moisture content [34], this leads to a carbon uptake of 1.40 kgCO2/kg of wet straw.
Timber materials are often referred as being “carbon neutral” because the CO2
released at the EoL due to decay or incineration refers to the CO2captured during
plant growth. Wiloso & al. [35] showed that assuming biogenic carbon neutrality
leads to biases in the ‘true’ values based on a complete inventory. It can either underestimate or overestimate GWI, depending on the system boundaries chosen, the form of carbon emissions, and biomass valuation[35]. For instance, burning biomass for energy provision increases the amount of carbon in the air just like burning fossil fuels if harvesting the biomass reduces the amount of carbon stored in plants and soils [36]. He Hence, flows from carbon biomass are counted as inputs into and outputs from the system. Concerning inputs, carbon content of wood is considered to be negative if the wood was produced under sustainable forest management ([37], [38]). After a literature review (see Appendix 1), the carbon content of wood is considered to be 50.6%, and so carbon uptake is 1.86 kgCO2/kg of
8
Since decomposition of organic material derived from biomass sources is the primary source of CO2 released from waste [40], it should be carefully analysed. But EoL
impacts of biogenic materials are not clear in the literature. The following literature review was thus undertaken to assess the real impacts of biogenic carbon decay.
1.3.2 Reemission of captured biogenic carbon in landfill and composting sites
2006 IPCC Guidelines for National GHG Inventoriesaim to estimate greenhouse gas (GHG) emissions from the waste sector. For biogenic carbon decomposition of landfilled waste, these guidelines provide a default value for the fraction of degradable organic carbon that decomposes under anaerobic conditions (DOCf). DOCf equals 0.5 [40]. No methodology is provided for N2O emissions from SWDS
because they are not significant. The DOCf value seems to be overestimated, especially for wood [101], [102]. Eq. 1 inspired by [100] corrects the amount of estimated methane (CH4) emissions resulting from the decay of bio-based materials
in a managed composting site.
Eq. 1 𝐶𝐻4𝑥 = 𝑊 × 𝐷𝑂𝐶 × 𝐷𝐸𝐺𝑥 × 𝐷𝑂𝐶𝑓 × 𝑀𝐶𝐹 ×16
12× 𝑂𝑋
where CH4x is the mass of methane generated at year x, W the deposited mass of
waste, DOC the degradable organic carbon in the year of deposition, DEGx the percentage of degradation at year x, DOCf the DOC fraction that decomposes under anaerobic conditions, MCF the part of the waste that will decompose under aerobic conditions before the conditions become anaerobic in the SWDS, and OX is the oxidation factor.
Here, referring to semi-aerobic managed solid waste disposal sites, MCF is 0.5 and COR is 0.1 [40]. This leads to the following ranges of values:
- a carbon decomposition into the air as CO2 (50% to 77.5% of the carbon) and
as CH4 (22.5% to 50%);
9
Moreover, according to WisardTM software developed by Ecobilan/PwC for waste LCA
[41], landfilled wood is 15% degraded after 100 years. Hence, 15% of carbon contained in wood degrades as CO2 and CH4. After that, residual carbon is
permanently stocked in the soil of the SWDS.
When composted, 79% of the carbon in the straw is degraded at during the first year to form humus. The humus degradation rate is thus set at 0.8% per year for the 100-year horizon [42]. As a result, 9.5% of carbon straw remains in the soil. IPCC Guidelines also give default emission factors for composting sites : 10g CH4/kg of
treated waste and 0.6g N20/kg of treated waste on a dry weight basis [43]. It is
indicated that these values are based on a limited number of studies and it is thus good practice to use updated scientific information to improve emission factors. Hence, data from a literature review of industrial composting sites’ emissions were
preferred here. According to (Hermann, 2011) [42], without distinguishing short-term carbon storage, a mean of 97.55% of degradable carbon is released as CO2 and 2.45%
as CH4 with extra emission of 0.787 gram N20 per kilogram of carbon (gN2O/kgC). For
straw with 15% moisture content, this leads to 1 237 gCO2/kg of straw and 11.8
gCH4/kg of straw. These values are close to IPCC default values. Nevertheless,
(Hermann, 2011) criticized some values and chose 0.11% CH4 and 0.6 N2O emissions.
Moreover, French data gives 0.95 gCH4/kg of composted matter [44].
More details are in Appendix 2.
1.4 Carbonation process
CO2 present in gaseous state in the air penetrates materials like concrete or cement
and lime renders through porosity and cracks. In the presence of water (which is present at least in the smallest pores), it causes a chemical reaction with the hydrated paste cement known as carbonation [45]. This is a CO2 diffusion process, which is
controlled by the saturation of the capillary system by water [46].
The carbonation process can be described by the following chemical equations [46]: 1. CO2(g) + H2O = HCO3- +H+
10 2. HCO3- = CO32- + H+
3. The carbonate ion will react with Ca ions in the pore solution: Ca2+ + CO
32- = CaCO3
Thus, with carbonation, hydrates and particularly calcium hydroxide (portlandite) Ca(OH)2 will dissolve and calcium carbonate CaCO3 will precipitate until all of the
Ca(OH)2 is consumed.
As shown in Eq. 2, carbonation kinetics follows a square root law [46]–[48]:
Eq. 2 𝑑𝑐 = 𝑘 × √𝑡
where dc is the depth of carbonation, k the rate factor and t the time in years.
Thiery [49] proposed a law for the mass of CO2 uptake (see Eq. 3) :
Eq. 3 𝑀𝐶𝑂2
𝑀𝐶𝑂2𝑚𝑎𝑥=
𝑘×√𝑡
𝑒
where e the thickness of the wall
Finally, Eq. 4 is used to calculate the CO2 uptake year by year:
Eq. 4 𝐶𝑂2𝑢𝑝𝑡𝑎𝑘𝑒 =𝑀𝑎𝑥(𝐶𝑂2𝑢𝑝𝑡𝑎𝑘𝑒)×𝑘×√𝑡
𝑒
where Max(CO2uptake) is the total carbonation potential at t=0.
According to the Nordic Innovation Centre [46], the porosity of the carbonated concrete is related to the strength of the non-carbonated concrete. Hence, the authors propose k values which are determined by assigning the materials to categories based on strength as well as exposure conditions (buried, indoor, sheltered and outdoor).
11
In the EPD conventional wall scenario, concrete has a mechanical strength of 8 MPa and is exposed. The carbonation rate is then k=5 mm/year½. Carbonation is not taken
into account in the EPD scenario on mortar. In the conventional Ecoinvent scenario, only carbonation of cement render and mortar joints is considered during the use stage. Lime render is included in biobased carbonate as well.
To calculate the maximum uptake of carbon dioxide by cement-based materials, a mean of 64% of CaO in cement was used ([45], [50], [51]). It was assumed that hydration of lime has no impact on the carbonation process. Indeed, conversion of CaCO3 into CaO can occur above 900◦C where the resulting CaO rapidly hydrates.
Since Portland cement clinker is heat treated at 1 400 to 1 500◦C, it contains only a
small amount of uncombined or hard-burnt CaO (which seldom exceeds 1% in modern concretes) [50]. Thus, the 64% CaO content is assumed to carbonate. The same assumption concerning hydrated CaO applies to the hydraulic lime render, where CaO content is 70% ([52]–[54]).
Lastly it is considered that not all the Ca(OH)2 carbonates. Renders whose thickness
is limited to a very few centimetres can be considered as having reached their final carbonation levels, i.e. 80% to 92% within 1 to 2 years [55]. The final carbonation level was set to the average value 86%. For mortar joints, the final carbonation levels progress at a rate of 1.9 mm/year starting from the side which is not insulated [55]. In this study, this rate is assumed to be 2 mm/year to include the carbonation that takes place ahead of the carbonation front.
Hence, for all materials, the CO2 uptake in kg due to carbonation follow Eq. 5:
Eq. 5 𝐶𝑂2𝑢𝑝𝑡𝑎𝑘𝑒(𝑖) = 𝐶𝑎𝑂%(𝑖) × 0.86 ×𝑚(𝑖)∗𝑀(𝐶𝑂2)
𝑀(𝐶𝑎𝑂)
where i is cement or lime, m(i) is the mass of i in kg which comprises mortar or render, M(CO2) is the molar mass of carbon dioxide, 44 g/mol, and M(CaO) is the molar mass of calcium oxide, 56 g/mol.
12
2.
Methods
Global Warming Potential is a measurement that establishes the relative climate effects of greenhouse gases. The impact of a product on global warming is calculated using life cycle assessment (LCA). In this section standard LCA is first presented, followed by the dynamic LCA method and finally by a simplification of dynamic LCA.
2.1 Life cycle assessment (LCA)
As defined by ISO 14040, life cycle assessment is a compilation and evaluation of the inputs, outputs and the potential environmental impacts of a product system throughout its life cycle. Standard LCA is based on the ISO standards 14040:2006 and 14044:2006 [56], [57] and is therefore divided into four phases: 1) Goal and scope definition; 2) cycle inventory (LCI); 3) cycle impact assessment (LCIA); 4) Life-cycle interpretation.
All the referenced emission data for a given gas are first aggregated at year one. The aggregated emissions are then multiplied by the GWP of the gas at a given time horizon (usually 20, 100 or 500 years, as mentioned by the IPCC [58]), and converted into kilogram CO2 equivalent (kgCO2e). The overall impact is the sum of the GWI of
each GHG.
To conduct LCAs of different wall designs, LCI data were obtained from the Ecoinvent 3.2 database. Data were analysed using Open LCA 1.5 software. Standard LCA focusses on GWP100 based on the IPCC 2013 impact assessment method [59]. This method sets the 100-year time horizon GWP values of GHG relative to CO2. In the
present study, the main gases emitted are carbon dioxide (CO2), methane (CH4),
dinitrogen monoxide (N2O) with GWP100 values of 1, 28 and 264.8 kgCO2eq
respectively [58].
To make this study as local as possible, the Ecoinvent 3.2 dataset was sometimes manually modified to fit the French or European context.
13
The environmental impacts of building products manufactured by French companies are recorded in Environmental Product Declarations (EPD) (French acronym FDES). These declarations are established using the LCA approach according to the standard NF EN 15804+A1 [60] and are available in the INIES database (www.inies.fr). EPD are cradle-to-grave designed. EPD are designed to be cradle-to-grave. The EPD are filled in by the manufacturer and are then checked and validated by an accredited expert. Accordingly, the database contains several EPDs for similar products produced by different manufacturers. It is sometimes difficult to judge whether the differences between EPDs are due to different methodologies/hypothesis or to real differences in energy efficiency between producers.
For the purpose of comparison, LCA calculations were performed using both Ecoinvent database and the EPD database. As the Ecoinvent scenario is the reference, unless otherwise specified, the Ecoinvent database was used.
It has been observed that 50-year-lifespan buildings are mostly chosen as a standard for LCA without any explanations. The literature review showed this figure underestimate the lifespan of buildings.
2.2 Dynamic LCA (dLCA)
LCA results depend on an established time horizon, a time beyond which further impacts are no longer taken into consideration [22]. By convention, a 100-year time horizon is considered. Changing this time horizon will modify the GWP, since greenhouse gases have different lifetime in the atmosphere: CH4 stays 12.4 years,
N2O 121 years whereas more than 20% of emitted anthropogenic CO2 remains in the
atmosphere ([58], [61], [62]). Thus, the cumulative effective global warming due to a process that emits carbon will always increase with time. Moreover, a time horizon of 100 years is problematic if a building with a 101-year lifespan is studied, since EoL will fall outside its scope.
14
Consequently, a dynamic approach makes real sense. One of the first dynamic approaches is the Lashof method [63]. As shown in Figure 2, it consists of calculating benefits against a time horizon of temporary carbon storage that implies delayed emission, meaning a delay in radiative forcing.
Figure 2 : Lashof method example: instantaneous impact for the emission of 1 kg of CO2 at year 1 or year 71, and a time horizon of 100 years.
This method was criticized because it still needs a time horizon and delaying emissions has no real advantage as it simply postpones the problem [64]. Thus the dynamic LCA proposed by Levasseur ([22], [23], [65]) appears to be the most relevant to estimate the effect of the storage or emission of GHGs over time. It resembles the Lashof method extended to all kinds of GHGs and time horizons. Levasseur and her co-authors developed dynCO2, a spreadsheet which makes it possible to obtain
time-dependent curves of the impact on global warming due to radiative forcing throughout the lifecycle [66]:
- the instantaneous impact of global warming GWIinst in W.m-2 calculated with
Eq. 7 thanks to Eq. 6:
Eq. 6 𝐷𝐶𝐹𝑖𝑛𝑠𝑡𝐺𝐻𝐺(𝑡) = ∫ 𝑎𝐺𝐻𝐺𝐶𝐺𝐻𝐺(𝑡)𝑑𝑡 𝑡
15 Eq. 7 𝐺𝑊𝐼𝑖𝑛𝑠𝑡(𝑡) = ∑ ∑𝑡 𝑔𝐺𝐻𝐺(𝑖)
𝑖=0
𝐺𝐻𝐺 ∗ 𝐷𝐶𝐹𝑖𝑛𝑠𝑡𝐺𝐻𝐺(𝑡 − 𝑖)
where:
- DCFinstGHG(t) is the dynamic characterization factor of a specific GHG emission that
occurs at time t;
- aGHG is the instantaneous radiative forcing per unit mass present in the
atmosphere for a specific GHG ;
- CGHG(t) is the mass atmospheric load of a given GHG, t years after the emission;
- gGHG(i) is the dynamic inventory result for a given GHG in year i.
- the cumulative impact of global warming GWIcum in W.m-2 (see Eq. 8):
Eq. 8 𝐺𝑊𝐼𝑐𝑢𝑚(𝑡) = ∑𝑡
𝑖=0 𝐺𝑊𝐼𝑖𝑛𝑠𝑡(𝑡)
- the relative impact in kgCO2e, which refers to a “dynamic” GWP by
comparing GWIcum at year i with GWIcum of 1 kg of CO2 emitted in year 1.
Changes in GWP over the years are then available, instead of LCA values established at year 1 and integrated only over 20, 100 or 500 years. The time at which sequestration and emission occur are differentiated, which is indispensable if one is to evaluate the real impact of building material on global warming at different timescales. This interest to shift towards dLCA for the buildings has been shown [67], especially to address the biogenic carbon issue when bio-based materials are used ([54], [65], [68]).
2.3 Simplified dLCA
In France, a group of experts was brought together in 2019 to work out how to account for temporary carbon storage in environmental assessments in future French building regulations [69]. One idea that was put forward is to apply weight factors to the GWP100 indicator to depict shifts in time of GHG emissions that are generated over the course of the life cycle. This approach represents a simplified dLCA since
16
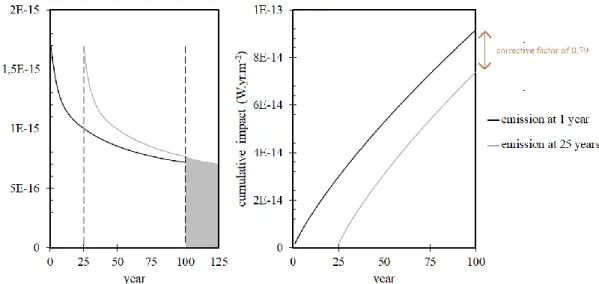
corrective factors are determined using the Lashof method through the simulation of 1 kg CO2 emission, but with a 100-year time horizon to fit with EPD data. Figure 3
shows that at the 100-year time horizon, the area under the grey instantaneous impact curve divided by the area of the black curve equals the corrective factor. The corrective factors used are listed in Table 2.The strong point of this method is that it is easy to use since only LCA data that are already available in EPD or in Ecoinvent are required.
Figure 3: Radiative forcing of 1 kg of CO2 emitted at year 1 or year 25 to determine correction factors at a 100-year time horizon in simplified dLCA
Table 2 : Impact of shifting of 1 kg of CO2 GWP adjusted to a 100-year time horizon. The original table from [69] is in Appendix 3
Emission/capture year 0 15 25 50 101
17
3.
Experimental
3.1 Functional unit and system definition & boundaries
The two types of studied exterior walls have the same functional unit (FU). According to NF EN 15804 [70] and NF EN 16783 [71], a FU has to contain a thermal resistance value (R) to be applied to an insulated wall and usually to a surface in panel-like systems. Thus, the FU is defined as follows:
- 1 m² of wall whose main function is to form a load-bearing structure;
- R value of 7.3 m².K.W-1 (U=0.137 W.m-2.K-1), which corresponds to passive
house standards; - a lifespan of 75 years.
The system with its boundaries refers to EN 15804 and is illustrated in Figure 4. It corresponds to a cradle-to-grave approach. The production of the wall known as module A includes five stages (A1 to A5): extraction of raw materials as well as biogenic captured carbon for bio-sourced materials, transport to the manufacturing plant, production, supply to the construction site, and construction of a 1m² wall. Given the scope of this analysis, in module B, only stage B1 (use due to carbonation) and stage B4 (replacement of some materials) were considered relevant. As part of B4, processes involved in the production of new materials and in replacing materials at the end of life (EoL) are counted. The EoL of the wall is included in module C (C1-C4). This module includes demolition of the wall, transport of the sorted materials to the proper waste treatment site, recycling processes in the case of recyclable materials, and disposal of non-recyclable materials. Module D covers benefits and charges that are beyond the system boundaries: production of aggregates from recycled concrete, of energy or chips from recycled wood, and of energy or compost from recycled straw. In standard LCA, this module is indicated as additional information but was not taken it into consideration in the comparison of LCA and dLCA.
During LCI some flows are excluded from the boundaries of the system. In accordance with EN 15804+A1, these flows are: lighting, heating and cleaning of workshops,
18
activities of administrative departments, workers’ transport, screws used in
construction processes, biomass residues, electricity consumption during construction and replacement.
INFORMATION ON THE LIFE CYCLE OF A BUILDING WALL
BENEFITS AND LOADS OUTSIDE THE SYSTEM
BOUNDARIES A1-A3 A4-A5 B1-B7 C1-C4 D PRODUCTION stage CONSTRUCTION stage USE stage ENF OF LIFE stage Reuse, Recovery, Recycling potential
Figure 4 : System boundaries of the LCA model for the two types of walls
In dynamic LCA, the production stage accounts for year 0 or 1, the construction stage for year 1, use for year 1 to year 75, and end of life from year 76. Carbon uptake by straw and wood products are counted the year before these products are used in the FU (i.e. year 0 or 49 in the case of product renewal). Indeed, assumptions of an equilibrium state for fields of annual crops and that French forests produce sufficient biomass in one year to offset the volumes harvested are made.
3.2 Walls under study
The first wall named “Concrete with internal thermal insulation” (conventional) and is composed of materials commonly used by the building industry. It is compared to a second wall named “Timber and bales of wheat straw” (biobased), which is one of the well-known low-tech biobased construction methods. For the assessments, materials of specified thickness that can be found in the market are used.
These two types of wall were compared through LCA and dLCA by using Ecoinvent 3.2 database. To be able to properly compare them with French EPD results, the processes chosen are based on the French and European context. The results are
incorporated in the “Ecoinvent scenario”. More details on the materials used can be found in the paragraph below. Ecoinvent process are detailed in Appendix 4
19
3.2.1. Materials
Concrete: due to the thickness of joints a little less than ten 20x20x50 cm hollow concrete blocks are used per FU. The density of a concrete block varies between 885 and 1 080 kg/m3 ([72], [73]). A density of 1 000 kg/m3 was set to obtain
a 20-kg concrete block as in the concrete EPD [74]. Since the selected concrete process gives a density of 2 315 kg/m3, a correction factor to enter the proper
concrete volume was applied. Concrete forms the structure of the conventional wall and has the same lifespan.
Cement mortar is used for the joints between the concrete blocks. The density of cement mortar varies between 1 800 kg/m3 and 2 200 kg/m3 ([75]–[77]). The usual
composition is 67% sand, 22% cement, 11% water [78], [79], which gives a density of 1 900 kg/m3. The mixing procedure is included in the Ecoinvent process. The
horizontal joints between two layers of concrete blocks are 1 cm thick. There are 4 horizontal layers per FU. The vertical joints between the concrete blocks are also counted. Mortar joints have the same lifespan as concrete.
Cement render is used on the outside of conventional walls. The render is made of aerated mortar, whose density is 1 500 kg/m3. It is 2 cm thick. The render has a
lifespan of 25 years, but EPD recommends and French law requires renovation of the facade every 10 years in some municipalities including Paris [80].
Glass wool is an inorganic insulator made of silica and recycled glass by fusion up to 1 400 °C, centrifugation and extrusion [81]. A density of 25 kg/m3 and a thermal
conductivity of 0.035 W.m-1.K-1 were set [82], [83]. Several different lifespans can be
found in the literature: 30 years [81], 40 years[19], 50yrs [84]. A lifespan of 50 years was chosen according to NF EN 16783. This also corresponds to what is observed in the field: in France, buildings built before 1974 are subject to thermal renovation. Current installation of internal insulation in new buildings are considered to last as long as possible. No information was found in the literature on how performances might change during the lifetime of the material due to ageing or unexpected situations.
20
Gypsum plasterboard is a standardized product with a thickness of 12.5 mm. Its in-service life is 50 years [85].
Paint is only applied inside the building. The yield of typical paints available on the market is 0.1 L/m². The density was set at 1 500 kg/m3 [86]. The solvent is water at
10 w%. Two to three layers are applied, which leads to 0.35 kg/FU. Paint’s lifespan is
15 years [87].
Straw: wheat straw grown in intensive farming system was chosen. Two-string bales of straw 47x37x100 cm in size are usually used in building applications. The minimum required density is 85 kg/m3 [88] and density can go up to 180 kg/m3, but is often
around 100 kg/m3, which is enough to ensure material homogeneity as well as lighter
to carry for workers. Its thermal conductivity is 0.052 W.m-1.K-1 ([32], [89]). The
lifespan was set at 50 years to match the NF EN 16783 norm.
Wood: softwood was chosen such as Douglas fir, a species whose wood does not require treatment. Its density at 15% moisture content is 550 kg/m3 [90]. Two
220x45 mm beams and three 27x32 mm battens are made out of it. Beam lifespan is the same as the wall, since it is the bearing element. The function of the battens is to compress the bales of straw bales and they thus have the same lifespan.
Clay plaster is composed of 55% clay, 25% sand and 20% water in weight [91], its density is 1 800 kg/m3. Its thickness is 3cm and it has a 25-year lifespan. The mixing
procedure is included in the Ecoinvent process.
Lime render: the process was created. According to building site data, the composition of render (in weight) is 12% hydrated lime, 70% sand and 18% water, giving a density of 1 400 kg/m3. The mixing procedure is the same as for clay. The
render is then applied in a 2-cm thick layer. Its lifespan is 25 years.
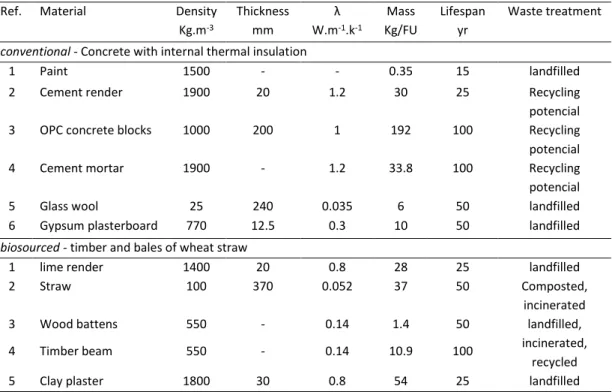
Table 3 gathers figures for each component of the walls presented in Figure 5. Figures found in EPDs for each constitutive materials of biobased and conventional walls are in Appendix 5.
21
Figure 5: Wall compositions referring to Table 3; conventional wall (left), biobased wall (right)
Table 3: Materials inventory for the two types of wall construction according to Ecoinvent database and literature - Ecoinvent scenario
Ref. Material Density
Kg.m-3 Thickness mm λ W.m-1.k-1 Mass Kg/FU Lifespan yr Waste treatment
conventional - Concrete with internal thermal insulation
1 Paint 1500 - - 0.35 15 landfilled
2 Cement render 1900 20 1.2 30 25 Recycling
potencial
3 OPC concrete blocks 1000 200 1 192 100 Recycling
potencial
4 Cement mortar 1900 - 1.2 33.8 100 Recycling
potencial
5 Glass wool 25 240 0.035 6 50 landfilled
6 Gypsum plasterboard 770 12.5 0.3 10 50 landfilled
biosourced - timber and bales of wheat straw
1 lime render 1400 20 0.8 28 25 landfilled
2 Straw 100 370 0.052 37 50 Composted,
incinerated
3 Wood battens 550 - 0.14 1.4 50 landfilled,
incinerated, recycled
4 Timber beam 550 - 0.14 10.9 100
5 Clay plaster 1800 30 0.8 54 25 landfilled
Considering the thermal resistances of the interior and exterior surfaces, Rsi and Rse, as 0.13 and 0.04 m².K.W-1, the global R values are 7.36 for the conventional wall and
22
3.2.2 Impacts of the materials on climate change – production and construction stages
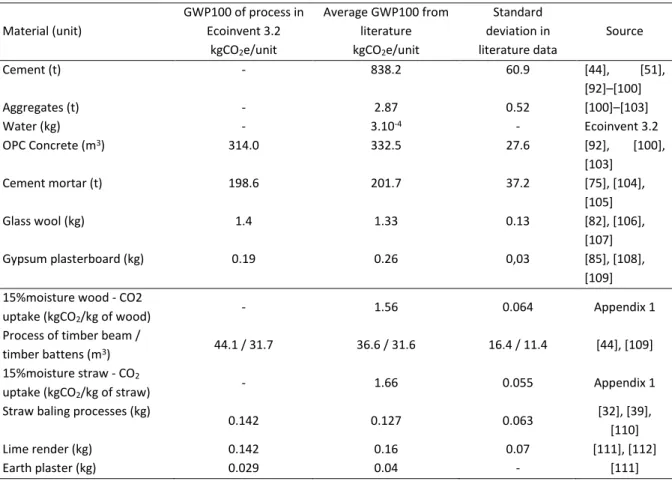
Some of the materials used in the FU involve several processes in the Ecoinvent 3.2 database. In order to ensure the GWP of the materials is consistent, the values were compared with values in the literature. Table 4 shows there are few discrepancies between the Ecoinvent processes and the literature.
Table 4: Processes chosen in Ecoinvent 3.2 to ensure their impact matches the literature review Material (unit) GWP100 of process in Ecoinvent 3.2 kgCO2e/unit Average GWP100 from literature kgCO2e/unit Standard deviation in literature data Source Cement (t) - 838.2 60.9 [44], [51], [92]–[100] Aggregates (t) - 2.87 0.52 [100]–[103] Water (kg) - 3.10-4 - Ecoinvent 3.2 OPC Concrete (m3) 314.0 332.5 27.6 [92], [100], [103] Cement mortar (t) 198.6 201.7 37.2 [75], [104], [105] Glass wool (kg) 1.4 1.33 0.13 [82], [106], [107] Gypsum plasterboard (kg) 0.19 0.26 0,03 [85], [108], [109] 15%moisture wood - CO2
uptake (kgCO2/kg of wood) - 1.56 0.064 Appendix 1
Process of timber beam /
timber battens (m3) 44.1 / 31.7 36.6 / 31.6 16.4 / 11.4 [44], [109] 15%moisture straw - CO2
uptake (kgCO2/kg of straw)
- 1.66 0.055 Appendix 1
Straw baling processes (kg)
0.142 0.127 0.063 [32], [39],
[110]
Lime render (kg) 0.142 0.16 0.07 [111], [112]
Earth plaster (kg) 0.029 0.04 - [111]
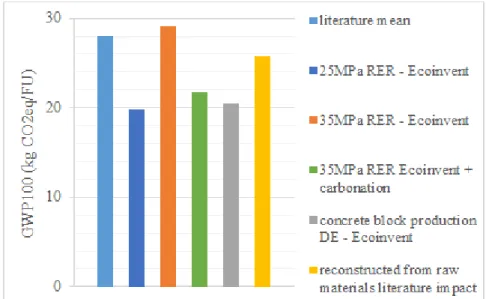
Due to cement, concrete will have a high environmental impact in the conventional wall. Figure 6 compares concrete production processes in Ecoinvent 3.2, reconstituted concrete and mean impact taken from the literature. For concrete production, a volume of matter was determined to form a hollow concrete block. Some data were modified to fit the European context.
23
Since the production of concrete of 25 MPa and 35 MPa in Ecoinvent is not destined for hollow blocks, Eq. 9 was applied the get the proper mass per FU. “Reconstructed concrete” was obtained by mixing the mean impact of cement, aggregates and water in the literature (see Table 4) at respective proportions of 9%, 86% and 5% , and then adding transport and manufacturing.
The 35 MPa concrete process matched the average in the literature. Moreover, with carbonation its impact was similar to that in low impact Ecoinvent processes.
Figure 6: comparison between concrete production processes in Ecoinvent 3.2, a reconstituted concrete and mean impact found in the literature review.
For concrete production, a volume of matter has been determined to form hollow concrete block (cf. Eq. 9). Some data have been modified to fit with the European context. Reconstructed concrete”
has been obtained by mixing mean literature impact of cement, aggregates and water (cf. Table 4) with a proportion of 9%, 86% and 5% respectively, and by adding transport and manufacturing
Eq. 9 𝑖𝑚𝑝𝑎𝑐𝑡𝑐𝑜𝑛𝑐𝑟𝑒𝑡𝑒25 35𝑀𝑃𝑎 = 𝑖𝑚𝑝𝑎𝑐𝑡𝐸𝑐𝑜𝑖𝑛𝑣𝑒𝑛𝑡 25 35𝑀𝑃𝑎 × 𝑑ℎ𝑜𝑙𝑙𝑜𝑤𝑐𝑜𝑛𝑐𝑟𝑒𝑡𝑒𝑏𝑙𝑜𝑐𝑘 𝑑𝑒𝑐𝑜𝑖𝑛𝑣𝑒𝑛𝑡𝑐𝑜𝑛𝑐𝑟𝑒𝑡𝑒2535𝑀𝑃𝑎
where d is the density in kg/m3.
The impact of growing the wheat straw was allocated based on the knowledge that straw represents 10% of income from the sale of wheat [113]. Hence, the impact of
wheat straw is 10% of “soft wheat grain” one, a process included in the French
24
comprising pressing, grouping and storage using diesel powered baling machines and including fertilisers so as to model nutrient losses from the field caused by exporting straw. These losses are 7 kg nitrogen (N), 1.2 kg phosphorous (P2O5) and 12.3
potassium (K20) per ton of exported straw [39].
As stated before, carbon uptake of biogenic materials are: 1.40 kgCO2/kg of wet straw
1.86 kgCO2/kg of dry wood.
For each type of wall, a 16–32 metric ton truck, EURO4, is used for transport in sub-module A4. For the conventional wall, transport concerns the delivery of concrete blocks from the ready-mix plant to the construction site (200 km [114]) and cement mortar transported from the packing facility to the construction site, which is assumed to be located at a distance of 50 km [19]. Plasterboard and insulator are also transported over a distance of 50 km. For the biobased wall, the reference distance for French Douglas fir wood is 200 km [115]. As clay is a locally available material, it is conservatively assumed that it is transported for 50 km. Lime is assumed to be transported over a distance of 500 km [116]. An exception was made in the means of transport for straw: 50% of the straw is assumed to be transported 10 km by tractor, 40% 40 km by truck and 10% 80 km by truck ([89], [113]). The electricity consumed at the building site and for the transport of the workers are not included.
Table 5 lists the amounts of CO2, CH4, N2O, CO and SF6 generated by the materials
25
Table 5: GHG emissions during the manufacturing of building materials (GWP at the 100-year horizon [59]: CO2 = 1, CH4=29.7, N20=264.8, CO=4.06, SF6=23506.8). * mean carbon storage is not shown here
Material production
quantity u
% CO2
emission kg CO2/u kg CH4/u kg N20/u kg CO/u kg SF6/u CO2e/u
Concrete 1 kg 97% 3,04.10-1 2,52.10-4 2,13.10-6 3,33.10-4 5,34.10-9 0.314 Mortar 1 kg 95% 1,88.10-1 2,67.10-4 1,95.10-6 4,26.10-4 5,07.10-9 0.199 Glass wool 1 kg 74% 9,82.10-1 3,92.10-3 7,55.10-4 2,23.10-3 1,47.10-7 1.330 Gypsum plasterboard 1 kg 90% 2,34.10 -1 6,57.10-4 1,21.10-5 2,56.10-4 2,21.10-8 0.260 Painting 1 kg 87% 4,58 1,27.10-2 4,79.10-4 3,32.10-2 2,67.10-7 2.240 Transport 1 t x km 96% 1,63.10-1 1,56.10-4 3,08.10-6 3,52.10-4 2,89.10-9 0.170 Diesel burned 1 MJ 95% 8,97.10-2 7,22.10-5 3,12.10-6 3,24.10-4 8,00.10-10 0.094 Straw bale* 1 kg 49% 7,13.10-2 1,05.10-4 2,64.10-4 8,53.10-5 2,11.10-9 0.146 Wood beam* 1 kg 79% 6,33.10-2 1,84.10-4 6,27.10-6 2,34.10-3 6,14.10-9 0.080 Wood batten* 1 kg 79% 4,84.10-2 1,37.10-4 2,87.10-6 1,96.10-3 2,87.10-9 0.061 Clay 1 kg 91% 2,67.10-2 7,22.10-4 7,90.10-7 6,89.10-3 2,26.10-9 0.029 3.2.3 Use stage
In this study, only carbon uptake due to cement and lime carbonation and the impact of replacement materials influence the use phase. It is considered that cement and lime render carbonate in 2 years and mortar joints render carbonate at a rate of 2 mm/year. Carbonation reactions are detailed in 1.4.
Materials whose lifespan is shorter than that of the wall are replaced. Replacement is simulated using the same process as that used to produce the wall. As specified in EN 15804+A1:2014, end-of-life processes of replaced materials are also included in B4. Transport is modelled by a 16–32 metric ton truck, EURO4. For each material, truck distances include the transport of the material supplied plus waste disposal. As prescribed by FD norm P01-015, waste with no potential and compostable waste are landfilled at a distance of 30 km from the construction site, whereas recycled waste is treated at a distance of 100 km from the construction site [74].
3.2.4 End of Life stage
Demolition of the conventional wall is performed by a high load diesel machine whose power is more than 74.57 kW, e.g. a Volvo EC 300DL 170 kW. A 100-m²-house with
26
4-metre high walls, e.g. 160 m² walls, takes 3 to 4 hours to demolish. A 1-minute-operation is attributed to the FU demolition and the sorting of materials. A diesel power saw is used for the demolition of the biobased, wall for 0.1 h/m² [113]. Waste transport is the same as in 3.2.3.
Glass wool is eliminated on landfill sites ([84], [117], [118]) along with painted gypsum plasterboard ([118], [119]). In France, 68% of concrete blocks are recycled and 32% are landfilled [117]. Recycled concrete is crushed to be used as a base layer in road construction. The mortar and cement render applied to the concrete blocks are assumed to be recycled the same way. Physical allocation with the mass of used material is applied. Taken together, for the conventional construction mode, 173.4 kg(waste)/FU are recycled, and 97.6 kg(waste)/FU are landfilled. Complete carbonation of concrete blocks can be rapid, since the blocks are in contact with air and crushed. Since mortar did not totally carbonate during the use phase, the rest is added at this stage. Total carbonation in conventional EoL is 8.3 kgCO2e, while in the
use phase, it is 10.9 kgCO2e.
For the demolition of the biobased, carbonation of the wall lime is 1.56 kgCO2e and
is attributed to the use phase. In the EoL, clay plaster and lime render are landfilled. Wood beams and battens follow the mean French EoL scenario for wood building products prescribed by FCBA: 17.3% is dumped in solid waste disposal sites (SWDS), 25.5% is incinerated, and 57.2% is reused as raw material by wood chip panel plants [41]. According to recommendation by the sector, wheat straw is incinerated or composted [33]. Thus, there are two end of life scenarios for biobased:
- “composted”, meaning 100% of straw is composted; - “incinerated”, meaning 100% of straw is incinerated.
From the review about GHG emissions at EoL of biogenic materials, two emissions scenarios (min and max) for composted straw and landfilled wood are used in this study to respect the broad range of GHG emission data in the literature (see Table 6). These modifications were made to Ecoinvent processes which already include other
27
GHG emissions. This makes two curves, min and max, for each “biobased GHG” curve. As a result, some Ecoinvent processes were modified (see Appendix 6).
Table 6: CO2, CH4 and N20 emission scenarios (min and max) for composted straw and landfilled wood, both with 15% moisture content, at a 100-year time horizon. Details can be found in Appendix 2
3.2.5 Reuse, recovery and recycling potential
As described by EN 15 804, benefits due to reuse as a new source for material or for energy production are affected in module D. Hence, recycled concrete is counted as crushed gravel with a negative impact. The same goes for recycled wood counted as chips: the benefits are avoided embodied energy of forest management and of the sawmill. Incineration of biowaste cogenerates heat and electricity. These benefits are counted by calculating the net outgoing energy flow that replaces production by the downstream energy system. In France, waste incineration provides 293.6 kWh of electricity per ton of waste and 583 kWh of thermal energy per ton of waste [120]. Avoided emissions due to this co-generation are 79 gCO2/kWh of produced electricity
(French mix) and 279 gCO2/kWh of produced thermal energy (European mix) [44].
28
4.
Results
4.1 Standard LCA
The impacts of materials at each stage of their life cycle are shown in Figure 7. Ecoinvent and EPD scenarios are both shown. The GHG emissions profile is quantified in terms of CO2 equivalent.
29
Figure 7: Results of standard LCA for (a) a conventional wall and (b) a biobased wall using EPD or Ecoinvent data, with details of the impacts of materials processes - (in the biobased
wall 50% of the straw is composted and 50% is incinerated)
Conventional LCA results give a GWP100 of 63.1 kgCO2e in the EPD scenario and 79.8
kgCO2e in the Ecoinvent scenario. For the biobased wall, the GWP100 is 4.1 kgCO2e
in the EPD scenario and 25.5 kgCO2e in the Ecoinvent scenario. In both cases, the
Ecoinvent scenario has a higher impact but the two scenarios show similar trends. The material with the most impact in the conventional wall is concrete, which accounts for 35.3 of the overall impact, transport and carbonation included. Construction professionals can mitigate the impact of a concrete building by choosing aerated, porous concrete blocks with optimised cement content. In this case, by selecting the 25-MPa-concrete process instead of the 35-MPa-concrete, the impact of concrete in the FU drops by 15%. Nonetheless, concrete remains a source of carbon emissions, whereas using wood as an alternative structural material would stock carbon. Glass wool and paint have a high impact in terms of their mass in the FU.
In the biobased wall, wheat straw drives both carbon uptake and carbon release and wood plays a smaller role in both scenarios (see Table 7). This is partly due to the difference in mass per FU between the two materials. Lime and mortar renders differ significantly in the Ecoinvent and EPD scenarios, notably due to the difference in their lifespan: 25-year-lifetime renders are used in the Ecoinvent scenarios and 50-year lifespans are used in EPD to more accurately reflect building sector practices. This highlights the importance of double checking if the input data matches the practices in the geographical region being studied. Carbonation significantly reduces the
impact of renders. Most of the lime render’s impact is due to transport. Here, clay
plaster has a significant impact according to the Ecoinvent database. Since clay plaster might be made with local materials and almost no processing, the process in the Ecoinvent database is a conservative one.
The EoL of biomaterials is stated in terms of GHG emissions due to biogenic carbon decay and needs to be precisely described in LCA. There is no consensus on GHG
30
emissions, first, due to the composting process: IPCC guidelines give a wide range for composted materials ([0.08-20] gCH4 per kg of waste), while Hermann gives (0.11%
to 5.1% carbon degraded as CH4). In practice, compost needs to be aerated on a
regular basis at composting sites. Second, emissions from landfilled wood are not clearly defined in the literature: methane emissions range from 10% [121] to 50% [40] of carbon content.
Like for the conventional wall, EoL processes have a low impact, but apart from concrete, cannot be recycled.
Biobased Module D is significant in terms of negative carbon impacts. Bio-sourced materials have high reuse, recovery or recycling potential which is not yet fully exploited.
Table 7 : Outcome of wood and straw biogenic carbon sequestration and emission for the FU
Uptake (kgCO2) Landfilled wood (17.3%) composted straw (100%) (kgCO2e)/FU Incinerated wood (25.5%) incinerated straw (100%) (kgCO2e)/FU Recycled wood (57.2%) (kgCO2e)/FU Biogenic carbon assessment (sum) (kgCO2e)/FU Wood (12.32 kg) -19.48 min: 1.64 max: 2.96 4.62 0 min: -13.42 max: -11.90 Straw (37 kg) -51.89 min: 53.79 max: 66.40 51.89 - 100% compost: [1.9 ; 14.51] 100% incineration: 0 4.2 Dynamic LCA
The results of LCA integrated in the dynCO2 tool are given here. First, conventional
and biobased constructions are compared from the point of view of the FU. Second, the influence of the building lifespan is presented. Also, biobased and conventional results are compared using the EPD database. Last, results when emissions are in CO2
equivalent are plotted. Module D is not considered since it is beyond the system boundaries.
31
4.2.1 Results of the functional unit - EoL influence
Comparison of the two types of construction are presented in Figure 8. The two EoL biobased scenarios are plotted. The instantaneous impact curve shows the effects on radiative forcing of replacing materials.
Biobased curves with instantaneous radiative forcing have both negative areas under the curve until the EoL of the building, whereas areas under conventional curves are directly positive. Hence the cumulative impact clearly distinguishes between the two types of construction: the conventional wall contributes to climate change, whereas the biobased wall has a cooling effect, at least for several decades. This information is new compared to standard LCA results.
Moreover, the longer the time horizon, the bigger the difference in impact between the two types of construction. Also, when straw is incinerated, the min and max scenarios are very similar. There is a bigger difference between the minimum and maximum biobased wall when the straw is composted. Lastly, one can observe that composting straw has a higher impact in the first decades, but a lower impact in the long term. This is due to significant CH4 emissions at 50 and 75 years, which have a
higher GWP but do not last long in the atmosphere compared to CO2.
Overall, dLCA curves highlight the importance of distinguishing time trends when storage and emission of CO2 occur, especially for biogenic carbon in biobased
32
Figure 8: dLCA of biobased and conventional scenarios from the Functional Unit
From now on, based on the cumulative impact curves, the specification is made that
“biobased min” will be the lower curve of “biobased - composted”, and “biobased
max” will be the higher curve of “biobased - incinerated”.
4.2.2 Influence of the building’s lifespan
In this subsection, the following FU is considered: 1m² of wall (R=7.3 m².K.W-1) that
perform the housing function at the same site for 300 years.
Figure 9 shows the impact of construction and demolition of biobased and conventional walls over a period of 300 years with either a 50-year or 100-year building lifespan. This figure shows that the differences in impact on global warming between the two types of construction are even more significant than the 75-year building lifespan comparison. In the case of a conventional wall, the longer the wall
33
lasts, the lower the impact. A biobased wall with a 50-year lifespan has less impact than a biobased wall with a 100-year lifespan, which seems strange. In fact, in the present study, wood stores more carbon than it releases, thus by increasing the use of timber beams, the impact is reduced.
Figure 9 : comparison of construction and demolition at one site of biobased and
conventional housing with a 50- or 100-year lifespan over a 300-year time period
4.2.3 Influence of the database
Figure 10 shows dLCA results for the EPD and Ecoinvent scenarios. It is important to note that in both scenarios GHG emissions are modelled as CO2 equivalent since EPD
data are all in CO2e. EPD data seem to underestimate the impact of materials, since
both conventional and biobased EPD scenarios have lower impacts than their equivalent with Ecoinvent data. But analysis of EPD or Ecoinvent data does not affect the difference between the two types of construction: the difference in cumulative radiative forcing in conventional and biobased walls is very similar in the two scenarios.
34
Figure 10 : Instantaneous and cumulative radiative forcing in the EPD and Ecoinvent scenarios. 75-year life span of housing - CO2e data used for Ecoinvent scenarios
4.2.4 Influence of CO2 equivalent emissions
Almost all LCAs use CO2 equivalent data. Figure 11 compares the results of the FU
with CO2equivalent results. “CO2e” means that CO2 equivalent LCA data were used
directly. “GHG” means that impacts resulting from LCA have been discretized into
CO2, CH4, N2O, CO and SF6 emissions. Figure 11 highlights the fact that results in CO2e
always show higher impacts, especially in the long term. This is due to the fact that part of CO2 remains in the atmosphere which is not the case of the other GHGs
studied.
These results underline the fact that the choice of time horizon is decisive for assessments made using CO2e data. Here, the CO2e curve does not overestimate
conventional constructions in the long term, whereas it overestimates biobased constructions when straw is composted because significant amounts of CH4 are released.
Nevertheless, Figure 11 shows that, by focusing on a 200-year horizon, conventional and biobased walls (with both incinerated or composted straw) can reasonably be compared with dynamic CO2e results. In this case, the 100-year time horizon, which
![Figure 1 : Planetary Boundaries (from [5])](https://thumb-us.123doks.com/thumbv2/123dok_us/1770609.2751754/10.892.197.711.421.782/figure-planetary-boundaries-from.webp)
![Table 1: Overview of the current French building stock [12], [25], [26]](https://thumb-us.123doks.com/thumbv2/123dok_us/1770609.2751754/14.892.147.820.166.746/table-overview-current-french-building-stock.webp)


![Table 5: GHG emissions during the manufacturing of building materials (GWP at the 100-year horizon [59]: CO2 = 1, CH4=29.7, N20=264.8, CO=4.06, SF6=23506.8)](https://thumb-us.123doks.com/thumbv2/123dok_us/1770609.2751754/34.892.149.818.215.527/table-ghg-emissions-manufacturing-building-materials-gwp-horizon.webp)

