Singapore Management University Singapore Management University
Institutional Knowledge at Singapore Management University
Institutional Knowledge at Singapore Management University
Research Collection Lee Kong Chian School OfBusiness Lee Kong Chian School of Business
10-2017
Do security analysts learn from their colleagues?
Do security analysts learn from their colleagues?
Kenny PHUA T. Mandy THAM
Singapore Management University, [email protected] Chi Shen WEI
Singapore Management University, [email protected]
Follow this and additional works at: https://ink.library.smu.edu.sg/lkcsb_research
Part of the Finance Commons, and the Finance and Financial Management Commons Citation
Citation
PHUA, Kenny; THAM, T. Mandy; and WEI, Chi Shen. Do security analysts learn from their colleagues?. (2017). 2017 Annual Meeting in Financial Management Association (FMA), Boston, October 11-14. Research Collection Lee Kong Chian School Of Business.
Available at:
Available at: https://ink.library.smu.edu.sg/lkcsb_research/6580
This Conference Paper is brought to you for free and open access by the Lee Kong Chian School of Business at Institutional Knowledge at Singapore Management University. It has been accepted for inclusion in Research Collection Lee Kong Chian School Of Business by an authorized administrator of Institutional Knowledge at
* Corresponding author: Chishen Wei ([email protected]) +65 6828-9650. Phua is at Nanyang Business School, Nanyang Technological University, Singapore. Tham is at Wealth Management Institute (Singapore). Wei is at the Lee Kong Chian School of Business, Singapore Management University. We are grateful for helpful comments from Gennaro Bernile, Ekkehart Boehmer, Steve Dimmock, Umit Gurun, Jarrad Harford, Harrison Hong, Byoung-Hyoun Hwang, Chuan-yang Hwang, Roger Loh, Abhiroop Mukherjee, Chayawat Ornthanalai, Rui Shen, Avanidhar Subrahmanyam, Rong Wang, Bohui Zhang, Zhuo Zhong, and seminar and conference participants at the Asian FA Conference (Bangkok), CICF (Xiamen), Complexity Institute at NTU, EFA (Oslo), FIRCG (Melbourne), University of Melbourne, Nanyang Business School, Singapore Management University, and SFS Cavalcade (Nashville). All errors are our own.
Do security analysts learn from their colleagues?
Kenny Phua, Mandy Tham, and Chishen Wei*
July 31, 2017
Abstract
We examine how learning from colleagues affects security analyst forecast outcomes. We represent the brokerage house as an information network of analysts connected through industry overlaps in their coverage portfolios. Analysts who are more centrally connected in their brokerage network produce more accurate forecast estimates and generate more influential forecast revisions. Consistent with learning, more central analysts tend to unwind their colleagues’ recent forecast errors in their forecast revisions. Learning appears to benefit all colleagues, as working at more interconnected brokerages (i.e., denser networks) improves forecast accuracy for all analysts.
JEL Classification Code: D83, G17, G24
Do security analysts
learn from their colleagues?
ABSTRACT
We examine how learning from colleagues affects security analyst forecast outcomes. We represent the brokerage house as an information network of analysts connected through industry overlaps in their coverage portfolios. Analysts who are more centrally connected in their brokerage network produce more accurate forecast estimates and generate more influential forecast revisions. Consistent with learning, more central analysts tend to unwind their colleagues’ recent forecast errors in their forecast revisions. Learning appears to benefit all colleagues, as working at more interconnected brokerages (i.e., denser networks) improves forecast accuracy for all analysts.
A large body of research shows that securities analysts play an important role as information intermediaries in financial markets. For example, security analysts supply valuable information (e.g., Womack, 1996; Chen, Francis, and Jiang, 2005; Bradley, Clarke, Lee, and Ornthanalai, 2014; Loh and Stulz, 2011, 2017) and shape the information environment (e.g., Balakrishnan, Billings, Kelly, and Ljungqvist, 2014; Lou, Cohen, and Malloy, 2014; Merkley, Michaely, and Pacelli, 2017).1 This naturally raises the question
of how forecast estimates are generated (e.g., Bradshaw, 2011). Extant studies find that forecast accuracy is a function of individual attributes including experience, personal characteristics, personal ties, and professional connections. However, even the best security analysts do not work in isolation. Their brokerage houses provide not only operational and back-office resources, but also a group of colleagues. These colleagues provide a potentially valuable network of knowledge and information.
For example, an analyst covering Google may provide useful industry insights to a colleague2 covering Apple. This type of information sharing is valuable because evidence
suggests that industry knowledge helps produce better forecast estimates.3 Indeed, our
conversations with analysts suggest that colleagues often workshop ideas and solicit feedback from their colleagues. Lehman Brother’s research department in the early 1990s is an example of the importance of knowledge sharing. To foster communication and learning, Lehman Brothers instituted a policy that every analyst’s presentation must reference the work of at least two other colleagues. During that period, Lehman Brothers was regularly ranked among the top brokerage firms.4
We hypothesize that analysts produce higher-quality equity research if they are better able to tap into the knowledge base of their in-house colleagues. To test our hypothesis, we map the information network within a brokerage house using industry overlaps among analyst coverage portfolios. Brown et al. (2015) write, “Industry knowledge is the single
1 Securities analyst also influence financial policy and valuation (e.g., Lang, Lins, and Miller, 2004; Chang, Dasgupta, and Hilary, 2006; Derrien and Kecskes, 2013).
2
Throughout the paper, we use colleague to refer to analysts that work at the same brokerage house. 3
See for example Boni and Womack (2006), Clement, Koonce, and Lopez (2007), Kadan, Madureira, Wang, and Zach (2012), Hilary and Shen (2013), Brown et al. (2015), Bradley, Gokkaya, and Liu (2017).
most useful input to analysts’ earnings forecasts and stock recommendations.” Our premise is that information exchange is more likely to occur between a pair of analysts if there is industry sector overlap in their coverage portfolios.
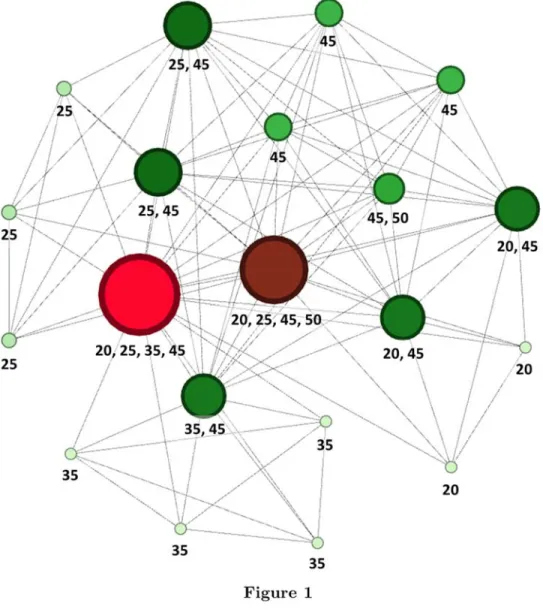
Figure 1 provides an example of an actual brokerage network in our sample. A larger node represents an analyst who shares more overlaps in industry coverage relative to a periphery colleague represented as a small node. For example, the largest node in red represents an analyst with direct connections with every other colleague in the network, whereas the smallest node is only connected to five other nodes. To measure each analyst’s position in their brokerage network, we create an Analyst Centrality score that encapsulates four individual established network measures that capture various aspects of knowledge exchange. An analyst located in a central nodal position has a high Analyst
Centrality score and is at the epicenter of information exchange within the brokerage
network. If analysts can learn from their colleagues, we hypothesize that central analysts are in the best position to benefit from such knowledge exchange.
Our first set of tests indicate that analysts with higher Analyst Centrality scores produce better equity research. Central analysts make more accurate forecasts and their forecasts are more influential. Economically, an analyst who is in the 75th percentile of
Analyst Centrality is about 10.5% more accurate than one in the corresponding 25th
percentile (relative to the median forecast error).5 Conditional on the deviation from the
consensus forecast, an inter-quartile increase in Analyst Centrality is also associated with a 0.39% higher abnormal return to revision announcements. Our test specifications include firm-year fixed effects to ensure that our findings are not due to underlying heterogeneity in the coverage firm. We also conduct tests with brokerage-year fixed effects. This specification is important because it rules out common alternative explanations relating to brokerage prestige, sector specialization, resources, and other important yet unobservable brokerage level characteristics. The evidence is consistent with the view that
5
To put this into perspective, a similar inter-quartile increase in General Experience corresponds to a 14.8% improvement in forecast accuracy.
analysts with higher Analyst Centrality have better access to the information transmitted through their brokerage network.
Analysts face other incentives that temper the benefits of in-brokerage information exchange. Although colleagues never cover the same company, they do compete for bonus pools or promotions within the brokerage. This type of tournament competition may weaken cooperation and diminish the incentives to share knowledge between colleagues. We find that such competitive pressures, which are more prominent at large investment banks, generally weaken the relation between analyst centrality and research quality.
We design additional tests to understand the nature of information sharing among colleagues. Central analysts are better able to forecast earnings on complex companies as measured by multi-industry segments (e.g., Cohen and Lou, 2012). This suggests that central analysts are experts at piecing together information from different industries. In addition, central analyst can more accurately forecast hard-to-value firms as measured by R&D. This is consistent with the view that central analysts acquire more difficult to uncover insights from their colleagues.
Next, we explore a possible way that central analysts learn such insights following the following learning paradigm (Clement, Hales, and Xu, 2011). In this paradigm, an analyst observes the ex-post forecast errors of her colleagues and in response, revises her own forecasts to incorporate the newly revealed information and to unravel the information previously gleaned from her colleagues. Consistent with this paradigm, we find that analysts with higher Analyst Centrality are more likely to issue revisions that adjust for their colleagues’ ex-post forecast errors. This evidence shows a potential channel of information propagation through the network as central analysts take into account their colleagues’ mistakes.
An interesting question remains whether information flows among all analysts in the brokerage network. Using a network measure, we estimate the amount of interconnection among colleagues (i.e., ‘density’ per network theory). We also expect greater information
flow in brokerages with higher Consistent with this hypothesis, we find that denser brokerages produce more accurate forecasts.
An unaddressed issue is the matching process between the analyst and the brokerage house. Concerns relating to brokerage characteristics are partially addressed in our main tests with the inclusion of brokerage-year fixed effects in our baseline specification. However, it remains that an analyst with expertise in a particular industry is more likely to match with a brokerage that specializes in that industry. To explore the causal relation between Analyst Centrality and forecast accuracy, we exploit shocks to Analyst Centrality
using a sample of brokerage mergers (e.g., Hong and Kacperczyk, 2010; Kelly and Ljungqvist, 2012) from years 2000 to 2007. These mergers introduce exogenous changes to the acquirer’s brokerage structure, shocking the Analyst Centrality scores of existing analysts. We find that analysts who experienced increases in their Analyst Centrality
scores subsequently issued more accurate forecasts relative to analysts whose Analyst
Centrality scores declined. Results from a generalized difference-in-difference model (Autor,
2003) show that 1) increases/declines in Analyst Centrality are effectively random with respect to pre-treatment forecast accuracy, and 2) gaps in forecast accuracy between both groups exist only in the post-treatment periods.
One may wonder to what extent the Analyst Centrality measure reflects an analyst’s ability or effort. Of course, developing higher centrality is completely consistent with greater talent or skill. What distinguishes our learning hypothesis is that Analyst
Centrality has incremental explanatory power beyond measures of ability or effort found
in the prior literature. Notably, our main specifications include proxies for ability (i.e., experience) and effort (i.e., revision frequency). In addition, we proxy for analyst ability using analyst membership in the Institutional Investor All-America Research Team (i.e. All-American status). The effect of Analyst Centrality on forecasting outcomes is unchanged with the inclusion of this control in our main tests.
Our paper contributes to a growing literature that seeks to penetrate the ‘black box’ of information generation of sell-side financial analysts (e.g., Bradshaw, 2011; Brown et al., 2015). Extant studies find that forecast accuracy is a function of experience, location,
personal characteristics, personal ties, and professional connections. 6 Our paper
emphasizes the value of information transfer between colleagues. Related to our findings is the evidence in Hwang, Liberti, and Sturgess (2016) of information transmission among in-house analysts in the mergers and acquisition setting. Equity analysts may also acquire information from their colleagues in debt/macro research (Hugon, Lin, and Markov, 2016; Hugon, Kumar, and Lin, 2016), on the asset management side (Irvine, Simko, and Nathan, 2004), and on the brokerage trading desk (Li, Mukherjee, and Sen, 2017). In contrast, we measure the general propensity of an analyst to receive information from her equity research colleagues using a network theoretic approach.
Our study also links to a literature that explores how analyst incorporate various signals into their forecasts. Chen and Jiang (2006) show how analysts weight public and private information into their forecasts. Clement, Hales, and Xu (2011) find that analysts revise forecast following the revisions of their direct competitors who cover the same company. Our evidence suggests that colleagues are a valuable source of information.
Our findings also contribute to the growing literature on information transmission through networks in financial markets. Venture capitalists and stock market investors who hold central positions in the network generate better investment returns (Hochberg, Ljungqvist, and Lu, 2007; Ozsoylev, Walden, Yavuz, and Bildik, 2013). Anjos and Fracassi (2015) find that internal information markets help conglomerates deliver more innovative and greater value. Studies also identify information transmission through workplace connections, personal networks, and social connections using educational backgrounds or social affiliations.7
6 See for example Clement (1999), Jacob, Lys, and Neale (1999), Malloy (2005), Bae, Stulz, and Tan (2008), Bradley, Gokkaya, and Liu (2017), Chen and Jiang (2006), Chen and Matsumoto (2006), Clement, Koonce, and Lopez (2007), Cohen, Frazzini, and Malloy (2010), Kumar (2010), Clement, Hales, and Xue (2011), Hilary and Shen (2013), Law (2013), Green, Jame, Markov, and Subasi (2014a, 2014b), Malloy (2005), Soltes (2014), Jiang, Kumar, and Law (2016). For a recent review, see Bradshaw (2011).
7
For example, social ties with management affect both analyst forecast behavior and coverage decisions (e.g., Westphal and Clement, 2008; Cohen, Frazzini, and Malloy, 2010; Brochet, Miller, and Srivinasan, 2014). Information also transmits through social networks among investors (e.g., Hong, Kubik, and Stein, 2004, 2005; Pool, Stoffman, and Yonker, 2015), between boards and managers (e.g., Kuhnen, 2009), between corporate and bank managers (Engelberg, Gao, and Parsons, 2012), across corporate boards (e.g., Shue,
1.
Sample and network definitions
This section describes our methodology and variable construction. We discuss our data and present summary statistics on our sample.
1.1. Defining Network Connections
Studies show that industry-specific information is valuable in making accurate earnings forecast.8 Therefore, we presume that information transfer and dissemination is likely to
occur between analysts that share industry sector overlaps in their coverage portfolios. This may occur for direct economic reasons. First, given the significant benefits of industry knowledge, there is economic value to discuss and solicit feedback from colleagues in the same industry. Second, given economies of scale in underlying resources such as sharing support staff, research assistants, and data sources, these types of interactions are likely to naturally develop among analysts in the same sector. Our study focuses primarily on these channels of information dissemination, but we discuss the possibility of other related channels in the next section.
We construct the connections within-brokerage network based on the forecast data for fiscal year one from the Detailed History file of I/B/E/S. We use the Global Industrial Classification Standard (GICS) codes to classify industries because these are commonly used among practitioners (e.g., Bhojraj, Lee, and Oler, 2003). To ensure that our networks are meaningfully large, we require that a brokerage in a given year has at least 5 analysts. We allow the network structures within the brokerage to vary through time to allow for changes in an analyst’s coverage portfolio. For example, consider two analysts, A and B, at the same brokerage. A connection exists in year t if A makes forecasts in GICS sectors 20 and 45, and B makes forecasts in GICS sector 45. By construction, the
2013; Larcker, So, and Wang, 2013, Fracassi, 2016), and between corporate boards and mutual fund managers (Cohen, Frazzini, and Malloy, 2008).
8
See: Boni and Womack (2006), Clement, Koonce, and Lopez (2007), Kadan et al. (2012), Hilary and Shen (2013), Brown et al. (2015), Bradley, Gokkaya, and Liu (2017). Brown, Call, Clement, and Sharp (2015) write, “industry knowledge is the single most useful input to analysts’ earnings forecasts and stock recommendations.”
connection weight is independent of the number of unique firms covered in the overlapping GICS sectors by either analyst. While it is reasonable to expect that the intensity of information exchange increases with the number of firms covered in the overlapping sectors of connected analysts, our simple counting approach is more parsimonious and conservative.
[Insert Figure 1]
As an example, we illustrate the network structure of a brokerage (I/B/E/S identifier: 481) in the year 2005. Each circular node represents an analyst in the brokerage network. The numbers below each node identify the GICS sectors covered by the analyst. Most analysts in this brokerage network cover up to two sectors, and only two analysts span four sectors in their coverage portfolios. A line between a pair of nodes denotes a direct connection between a pair of analysts. Nodes that are larger in size and illustrated with more intense colors (progressively, from light green to bright red) have more direct connections.9 Figure 1 shows that analysts can have different levels of connectedness even
if they cover the same number of economic sectors. For example, an analyst who covers GICS sectors 25 and 45 has more direct connections than her colleague who covers GICS sectors 45 and 50.10 This suggests that the relation between an analyst’s coverage portfolio
complexity and potential for information exchange is non-linear and dependent on the composition of her colleagues’ coverage portfolios.
1.2. Defining Analyst Centrality
There are many dimensions of the information exchange process. Aside from different types of information (e.g., firm-specific, industry news, and macroeconomic news), there is variation in the amount (i.e., volume) and speed of information transmission. Our approach uses the four most common measures of network centrality to describe
9
While we focus on direct connections in Figure 1, network theory informs us that a node’s connectedness is also influenced by her indirect connections in the network. In the next section, we explore some measures that account for dynamics arising from analysts’ indirect connections.
10
This difference arises because there are more analysts in the brokerage network who cover GICS sector 25 than the ones who cover GICS sector 50.
information exchange (e.g., Larker, So, and Wang, 2013). Each measure of network centrality captures a distinct feature of connectivity and information exchange. As such, any single measure is unlikely to capture all facets of information exchange (Newman, 2003). Characterizing the information exchange process can be challenging (Borgatti, 2005), but we describe below the intuition behind the types of inter-colleague information exchange that each measure is likely to capture and reserve the details for Appendix I.
Degree Centrality (Newman, 1979) and Eigenvector Centrality (Bonacich, 1972) are
conventionally used to capture information flow in a network (Borgatti, 2005). Degree
centrality counts the number of directly connected neighbors. An analyst with more
direct connections has more opportunities for interaction and is likely to receive more information. Since our analysts are connected by industry overlaps, degree centrality likely captures information that is industry-specific or related to competition dynamics.
Eigenvector Centrality is a close cousin of Degree Centrality but places more weight
on neighbors who are themselves more central whereas Degree Centrality places equal weight. This captures more relevant or valuable industry-specific information and additional information flow that is more macroeconomic in nature.
Closeness Centrality (Freeman, 1979) captures the speed (time-to-arrival) of receiving
information that is produced anywhere in the network (Borgatti, 2005). In financial markets, the value of information is time-sensitive, and speed of information exchange helps an analyst incorporate colleagues’ information into her forecasts in a timely fashion.
Betweenness Centrality (Freeman, 1979) captures the relative position of analyst
within the network structure. It captures cross-industry information exchange11 that
is valuable to the analyst and relates to the positional benefit of ‘strategic complementarity’ in information production from colleagues working in different industries.An analyst with high Betweenness Centrality is more likely to reap cross-industry synergistic gains from her colleagues’ information production. Technically, such cross-industry synergies are unlike the canonical type of information exchange
(i.e., degree and eigenvector centrality). Where there is an opportunity for an analyst to exploit synergies between two industries, the information exchange should be targeted and not via a circuitous path.12
A large literature has stressed the importance of information transmission through informal or social connections. In contrast, we focus on professional linkages based on sector overlap in their coverage portfolios. It is likely that the analysts we study are connected socially too, beyond these professional relations (e.g., Hwang and Kim, 2011). Data limitations prevent us from capturing these non-professional ties, but we argue that information exchange outside of our constructed networks is likely to work against finding empirical support for our hypothesis.
1.3. Principal Component Analysis
Given the complexity of information in a network, any single measure of network centrality is unable to completely capture analyst connectedness (Newman, 2003; Valente, Coronges, Lakon, and Costenbader, 2008). Each measure of centrality may be better at capturing different types of information exchange, which we further discuss below.
Our four centrality measures have cross-correlations ranging from 30.2% to 89.1%. Simultaneously using all four centrality measures is likely to induce multicollinearity issues. Therefore, we perform a principal component analysis (PCA) on degree, betweenness, closeness, and eigenvector centrality. From the first principal component, we extract its standardized factor score and define it as Analyst Centrality. We report more details of the PCA in Section 1.6.
1.4. Forecast Accuracy
Following Clement (1999), we construct Normalized Forecast Error from the latest firm-year forecast values by calculating the absolute difference between the analyst’s firm-firm-year
12
Borgatti (2005) makes clear that, due to the algorithmic implications of betweenness centrality, it is incompatible with the canonical type of untargeted information exchange. We also do not adopt the typical interpretation that betweenness centrality represents information brokering capacity. Instead, we stress that analysts with synergistic coverage portfolios will mechanically be situated between many colleagues.
forecast value and the corresponding earnings-per-share (EPS) of the firm-year, scaled by the firm-year mean absolute forecast error for comparability across observations. For analyst covering firm in year , we define her Normalized Forecast Error as in (1).
1 , , , , , , , , , , | | f t i i f t f t N f t f f t j f t j t
EPS Forecast Actua
Normalized Forecast Error
EPS Forecast Actu
l E al N EPS PS
(1) 1.5. Control VariablesWe include controls for the determinants of forecasting performance found in prior research.13 We provide a brief description of the key variables and provide full construction
details in Appendix II. All continuous variables are winsorized at the 1st and 99th percentile
values to limit the influence of outliers.
To control for forecast characteristics associated with accuracy, we include proxies for revision activity (Revision Frequency), timeliness based on the closeness to the actual earnings announcement (Horizon), lowballing behavior (Lowball) 14, and deviation from
the consensus forecast (Boldness). As lowballing behavior is associated with forecast accuracy, we also create a lowball measure following Hilary and Hsu (2013). Since centrality is likely associated with ability, we proxy for analyst ability using total work experience (General experience) and experience covering the firm (Firm Experience). To account for the analyst’s portfolio complexity, we measure number of unique firms (Firm
Breadth) and the number of 2-digit GICS sectors (Industry Breadth) covered by the
analyst during the year. We measure Brokerage Size as the logarithm of the number of analysts employed by the brokerage.
13
See for example, Mikhail, Walther, and Willis (1997); Clement (1999); Jacob, Lys, and Neale (1999); and Brown (2001), Ivković and Jegadeesh (2004).
14
Hilary and Hsu (2013) show that analysts strategically increase forecast error consistency via lowballing behavior for firms with high institutional ownership. The lowballing strategy inevitably decreases forecast accuracy. Appendix II contains full details of the construction of lowball.
We also account for the influence of firm heterogeneity on forecasting outcomes by controlling for the number of analysts (Analyst Coverage), market capitalization, book-to-market ratio, leverage, ROA volatility, and negative earnings (Loss)15.
1.6. Descriptive Statistics
Our sample comprises 5539 firms, 317 brokerages, 9170 analysts, and 274,671 firm-year forecasts from the years 1996 to 2014 using the I/B/E/S vintage from WRDS in May 2015. Panel A presents summary statistics of unique analyst-year pairs. The average (median) analyst has 17 (12) connections and covers 1.68 (1) GICS sectors. The median brokerage employs 44 unique analysts. By definition, Degree Centrality, Closeness
Centrality, Betweenness Centrality, and Eigenvector Centrality are non-negative. However,
many analysts in the sample have negative values of Analyst Centrality because we used standardized variables in the PCA-extraction.16
[Insert Table 1]
Panel B of Table 1 presents Pearson correlations between the network centrality measures and analyst/brokerage characteristics. Naturally, Analyst Centrality is positively correlated with its component measures (54.6% to 94.9%). Analyst Centrality is also positive correlated with Industry Breadth (57.1%), but weakly related to Firm Breadth
(16.5%), as analysts generally tend to cover firms in the same industry. Analyst Centrality
has low correlations with measures of experience including General Experience, Firm
Experience, and Brokerage Experience. Interestingly, Analyst Centrality is negatively
correlated with All-American status, which suggests that central analyst are unlikely to be voted as All-Americans.
Panel C reports a principal component analysis of the four network centrality measures. The first principal component captures approximately 66.5% of the variance in the four network centrality measures and is the only eigenvalue greater than one. The incremental variance explained by the next principal component is only about 20.9%. Other loadings
15
See Hwang, Jan, and Basu (1996) and Brown (1997; 1998).
on some centrality measures turn negative in principal components, thus making interpretation difficult. In light of these considerations, we construct Analyst Centrality
based on the first principal component.
[Insert Figure 2]
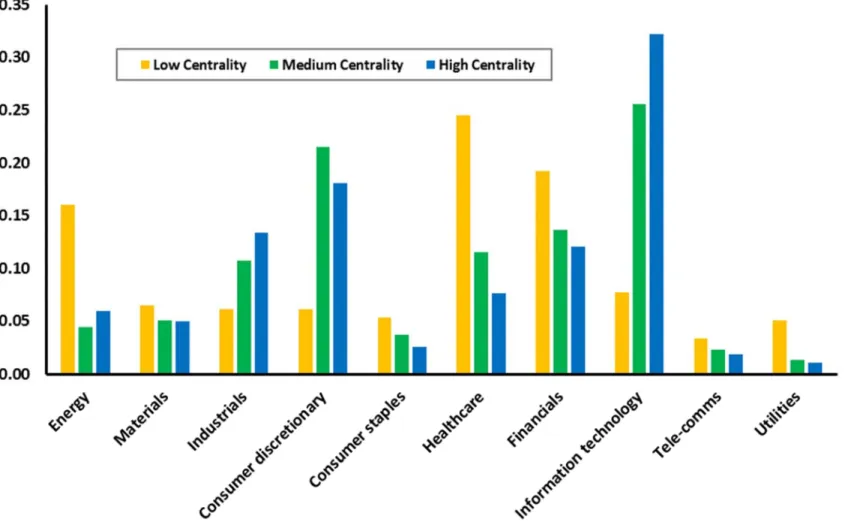
1.7. Central analysts and industry coverage
As discussed above, central analysts cover more industries but not necessarily more firms. Figure 2 shows the types of industries that central analyst cover. Analysts with high centrality primarily cover information technology, consumer discretionary, and industrials. In contrast, low centrality analysts tend to focus on health care, financials, and energy.
2.
Do central analysts produce better forecasts?
Our learning hypothesis proposes that analysts generate better equity research if they can learn valuable information from their colleagues. In this section, we test the learning hypothesis by focusing on the analyst’s centrality in the network. Our main prediction is that central analysts make better forecasts because they have better access to intra-brokerage information flow. We test this along two dimensions: 1) forecast accuracy, and 2) market reactions to revision announcements.
2.1. Forecast accuracy
We test whether central analyst produce more accurate forecasts by estimating specification (2).
Normalized Forecast Errori,f,t = α + β1∙Analyst Centralityi,t + ϑ∙Controlsi,f,t + εi,f,t (2)
Our forecast accuracy measure is Normalized Forecast Error which allows for comparability across firms. The control variables include forecast horizon, revision frequency, forecast boldness, analyst experience, coverage experience, lowballing behavior, and complexity of coverage portfolio (i.e., firm breadth of coverage and industry breadth of coverage). Additionally, we include the following firm characteristics: earnings volatility,
transitory earnings, leverage, growth opportunities, firm size, and analyst coverage (e.g., Heflin, Subrahmanyam, and Zhang, 2003; Hilary and Hsu, 2013).
Our baseline specification includes brokerage-year fixed effects to capture unobserved brokerage characteristics such as prestige and resources (e.g., Stickel, 1995; Clement, 1999; Hugon, Kumar, and Lin, 2016). We also estimate a specification with firm-year fixed effects to absorb unobserved heterogeneity of the coverage firm that affects all analysts’ forecasting performance in the firm-year. We carefully estimate the standard errors as follows. Since fixed effects do not fully capture correlations of regression residuals, we cluster the standard errors along two dimensions following Petersen (2009) and Gow, Ormazabal, and Taylor (2012). First, we cluster by analyst-firm because an analyst’s forecast error on a particular firm may be correlated over time. The second clustering dimension is either 1) firm-year to capture dependence in forecast errors of competing analysts in a firm-year or 2) brokerage-year to capture correlations of analysts’ forecasting performance within each brokerage-year.
[Insert Table 2]
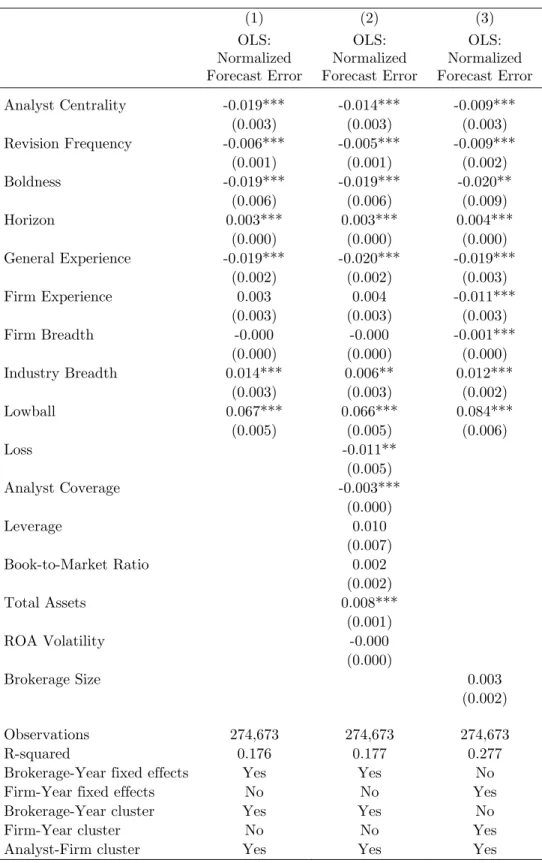
The results in Table 2 show that central analysts produce more accurate forecasts than their periphery colleagues. The specification in Column (1) shows that, controlling for analyst characteristics, central analysts produce more accurate forecasts than their periphery colleagues in the same brokerage. In Column (2), we show that the positive relation between forecast accuracy and Analyst Centrality is robust to the inclusion of controls for firm characteristics. Economically, an analyst in the 75th percentile of Analyst
Centrality is 10.5% more accurate (relative to the median forecast error) than an analyst
in the 25th percentile. For comparison, an interquartile increase (p25th to p75th
corresponding to an interquartile range from 23 months to 90 months) in General
Experience corresponds to a 14.8% improvement in forecast accuracy.17 Column (3) shows
17
From Table 1, the difference in Analyst Centrality between the 75th
and 25th
percentiles of its distribution is 1.337. This difference corresponds to a decrease in Normalized Forecast Error of 1.337 × 0.014 = 0.019. We de-normalize this value by the mean raw forecast error to obtain 0.019 × $0.222 = $0.0042, or about 10.5% of the median raw forecast error ($0.04). An interquartile increase in General Experience (from 23 months to 90 months) is a 290% increment. This has an impact of -0.020 × log (1+2.9) = 0.027 decrease
that the results are similar with the inclusion of firm-year fixed effects which necessarily omits controls for firm characteristics. The results suggest that central analysts make more accurate forecasts than their competitors who cover the same firm in the year.
Consistent with prior literature, we find that forecast accuracy is associated with shorter forecasting horizons, more firm-specific experience, bolder forecasts, less low balling behavior (e.g., Clement and Tse, 2005; Hilary and Hsu, 2013). Greater effort, as proxied by higher revision frequency is also associated with greater accuracy. Higher analyst coverage also creates greater accuracy, consistent with greater competition spurring more effort. (e.g., Merkley, Michaely, and Pacelli, 2017; Loh and Stulz, 2017).
We also find that analysts that cover more industries (Industry Breadth) tend to have greater forecast errors as their coverage portfolio becomes more complex (e.g., Clement, 1999; Clement and Tse, 2005). This is noteworthy because Analyst Centrality measure is related to Industry Breadth, but the two measures have opposing effects on forecast accuracy. An interquartile increase in Industry Breadth reduces accuracy by 3.3% relative to the median forecast error.18 This is consistent with a tradeoff between the benefits of
intra-brokerage information exchange and the costs of undertaking more complex tasks. Overall, the evidence is consistent with the view that analysts with higher values of
Analyst Centrality have greater information advantages. The findings suggest that central
analysts are likely learning valuable information from their intra-brokerage colleagues. The relation is unlikely due to unobservable brokerage-related factors or heterogeneity in coverage-firm specific characteristics.
2.2. Forecast revision informativeness: Market reactions
in Normalized Forecast Error. On average, this translates to 0.027 × $0.222 = $0.0059, or about 14.8% of the median raw forecast error ($0.04).
18
From Table 1, the difference in Industry Breadth between the 75th
and 25th
percentiles of its distribution is 1. This difference corresponds to an increase in Normalized Forecast Error of 1 × 0.006 = 0.006. We de-normalize this value by the mean raw forecast error to obtain 0.006 × $0.222 = $0.0013, or about 3.3% of the median raw forecast error ($0.04).
If central analysts benefit from information exchange, we expect that their forecast revisions contain more novel and value-relevant information that will attract greater market reactions. We test this prediction by estimating specification (3).
AbsCAR [-1,+1]r,i,f,t = α + β1∙Analyst Centralityi,t +
β2∙Analyst Centralityi,t×Consensus Deviation + ϑ∙Controlsi,f,t + εi,f,t
(3)
The unit of analysis is each forecast revision on a firm by a particular analyst. Standard errors are double-clustered by year-week to capture common time-varying macroeconomic shocks and also by firm because market reactions to forecast revisions may be correlated over time for a given firm. We control for Consensus Deviation because we expect stronger market reactions when the analyst’s revision significantly deviates more from the prevailing consensus forecast (e.g., Clement and Tse, 2003; Hilary and Shen, 2013).
Consensus Deviation is the absolute difference between an analyst’s revision value and
the prevailing forecast consensus, normalized by the absolute value of the forecast consensus. We also control for stock performance during the run-up to the forecast revision date to capture potential auto-correlation in returns.
[Insert Table 3]
Table 3 shows that central analysts command larger market reactions around their forecast revisions. Column (1) shows a statistically positive association between Analyst
Centrality and 3-day market reactions around forecast revisions. Furthermore, the
interaction term shows that, conditional on the deviation from the consensus forecast, the revisions of a central analyst command higher market reactions than those of a peripheral analyst. This suggests that the market perceives the revisions of central analysts to contain more relevant and novel information, even after controlling for Consensus Deviations.
The results are similar in Column (2) with the inclusion of controls for analyst characteristics and stock performance during run-ups to the forecast revisions. Evaluated at the median Consensus Deviation, an inter-quartile increase in Analyst Centrality is
associated with higher returns of about 0.39% over 3 days.19 Consistent with Bradley,
Gokkaya and Liu (2017), the forecast revisions of analysts who have higher general experience and who work in larger brokerages also attract larger market reactions. Overall, the evidence is consistent with the view that analysts with higher centrality possess more novel and value-relevant information.
A potential concern is that confounding events including material firm announcements may coincide with analysts’ forecast revisions. To alleviate this concern, we collect all dates on which firms file SEC Form 8-Ks20 from the EDGAR database. Thereafter, we
drop a forecast revision from our sample if a Form 8-K is filed in the (-1, +1) day window of the revision. Additionally, we exclude a forecast revision from our sample if the firm has earnings announcements in the (-1, +1) day window of the revision. These filters reduce our sample size by about 48%, suggesting that analysts’ revisions are often motivated by the disclosures of new information by firms. We repeat our analysis in this reduced sample and present the results in Column (3). Notwithstanding a marginal drop in economic magnitude, we continue to find that the forecast revisions of central analysts attract larger market reactions.
Finally, we repeat our analysis on a further-reduced sample of standalone forecast revisions (Gleason and Lee, 2003; Chen and Matsumoto, 2006).21 Under the caveat that
this filter inevitably introduces a look-ahead bias, we continue to find a positive relation between Analyst Centrality and market reactions around forecast revisions in Column (4).
Despite our exclusions of forecast revisions that coincide with issuances of Form 8-Ks and earnings announcements, an alternative explanation remains that central analysts only issue forecast revisions around significant news events. We address this possibility
19
The difference between the 25th
and 75th
percentiles of the Analyst Centrality distribution is 1.337. The median Consensus Deviation in the sample is 0.046. Evaluated at the median level of Consensus Deviation, an inter-quartile increase in Analyst Centrality corresponds to an increase in market reactions of 0.009×0.046×1.337+0.288×1.337=0.358%
20
In addition to annual and quarterly reports, public companies are required to report certain material corporate events on a more current basis via the Form 8-K. A comprehensive list of the event types that trigger a firm’s obligation to file a Form 8-K is available on the SEC website.
by replacing Consensus Deviation with Self Deviation in our model. The latter variable captures the magnitude of deviation between an analyst’s revision and her previous forecast value. Our results in Table 1 of the Internet Appendix show that, conditional on the magnitudes of such deviations, central analysts still command larger market reactions. Notably, we also find that market reactions to forecast revisions increase unconditionally with Analyst Centrality. Overall, the results are consistent with the view that central analysts have access to better information and learn from their brokerage colleagues. As a result, they make more informative forecast revisions that generate larger market reactions.
2.3. Competition and learning
Sell-side analysts work in highly competitive environments. Our main tests control for cross-brokerage competition effects using the number of analysts who covers the same firm (e.g., Merkley, Michaely, and Pacelli, 2017; Loh and Stulz, 2017). However, analysts also face direct in-house competition for year-end bonus or promotions (e.g. Groysberg, Healy, and Maber, 2011). Under intense competition within the brokerage, analysts may abstain from collaboration or withhold feedback, and thus weaken information exchange. To explore these dynamics, we proxy for the intensity of in-house competition using the existence of large investment banking businesses. We rank investment banks (IB) by their IPO and SEO deal values in every year using data from SDC platinum. Investment banks are added to the Large IBs pool sequentially until the pool accounts for 75% of the total deal value in the market of that year.22 The remaining brokerages (i.e. smaller IBs
and non-IBs) are assigned to the Non-Large IBs pool.
[Insert Table 4]
22
We perform this ranking procedure separately for IPO and SEO deals so that a brokerage with substantial IPO deal flow but weak SEO deal flow (or vice versa) is still classified as a Large IB. The market for underwriting services is dominated by a few IBs – the 15 Large IBs out of 101 IBs in our sample account for at least 75% of the IPO/SEO market share.
The results in Table 4 are consistent with the notion that the learning mechanism weakens in highly competitive environments. In Panel A, we find a positive relation between Analyst Centrality and forecast accuracy in the Non-Large IBs sample in Column (1); however, this relation is absent among the largest IBs in Column (2). This suggests that central analysts do not benefit strongly from inter-colleague information exchange at the large investment banks. We also use Brokerage Size as an alternative measure for in-house competition because larger brokerages tend to offer higher compensation and employment prestige. In every year, we sort brokerages into terciles according to their size. Columns (3) through (5) present results on sub-samples increasing in Brokerage Size. The link between Analyst Centrality and forecast accuracy appears to increase in the first
two Brokerage Size terciles, but diminishes among the largest brokerages.
We repeat the above analysis on market reactions surrounding analysts’ forecast revisions in Panel B. In a sample that excludes revisions around issuances of Form 8-Ks and earnings announcements, we find that the positive relation between market reactions
and Analyst Centrality is present among Non-Large IBs but not among the largest IBs.
Similar to the patterns in Panel A, we also find that the effect of Analyst Centrality decays with Brokerage Size in the context of market reactions.
Overall, these findings support the salience of competition as a factor in designing an optimal collaborative structure for information exchange among workers.
3.
The learning channel
Our evidence thus far is consistent with the view that intra-brokerage information transfer affects forecast performance. In this section, we examine the potential learning channel more carefully.
3.1. Learning information on hard-to-value stocks
We hypothesize that central analyst are more likely to learn information that is more complex in nature from their colleagues. Koh and Reeb (2015) show that firms that fail
to report R&D expenditures have higher uncertainty about their true level of innovation and future growth prospects. Information incorporation is also more complicated for firms with highly dispersed operations across numerous industry segments (Cohen and Lou, 2012).
We construct High R&D, which is an indicator equal one if either the R&D intensity of the firm is above the yearly median or the firm has missing R&D expenditure data in Compustat23, and Conglomerate, which is the Herfindahl index of a firm’s sales across its
industry segments. To facilitate interpretation, we multiply the Herfindahl index by minus one so that higher values of Conglomerate correspond to higher firm complexity. We interact Missing R&D and Conglomerate with Analyst Centrality respectively to examine incremental effects of colleague learning on stocks that are difficult to value.
Table 5 shows that central analysts are better able to forecast earnings for such hard-to-value stocks. Column (1) of Table 5 shows a statistically negative coefficient on the interaction term Analyst Centrality x High R&D. Column (2) shows similar results using
Firm Complexity measure. Column (3) shows that our conclusions are unchanged when
including both High R&D and Firm Complexity (and their interactions with Analyst
Centrality) in the same specification. Interestingly, the statistically negative loadings on
both interaction terms suggest that High R&D and Firm Complexity proxy for different dimensions of valuation for difficult-to-value stocks.
This evidence provides some color on the nature of information analysts learn from their colleagues. The findings suggests that central analyst are able to gain particularly valuable and rare insights to help forecast uncertain or complex firms.
3.2. Learning from our colleague’s mistakes
We examine whether central analysts are able to learn from their colleague’s mistakes under the following paradigm. A central analyst observes the ex-post forecast errors of her colleagues when actual earnings are announced in the colleague’s coverage portfolio.
23
R&D intensity is defined as the ratio of R&D expenditures to total assets. Our results also hold if we require sample firms to have non-missing R&D expenditure data.
In response, the central analyst revises her own forecasts to incorporate the newly revealed information in her colleagues’ forecast error. We hypothesize that after a colleague’s forecast is revealed to be optimistic, the central analyst is likely to learn from this mistake and revise her forecast downwards. Our test focuses on an analyst’s revision behavior upon the revelations of ex-post forecasting performance of her brokerage colleagues.
To measure the re-adjustment of the analyst’s prior forecast, we construct Analyst
Revision, a signed measure defined as the difference between an analyst’s forecast revision
value and her prior forecast value, deflated by the absolute value of the latter. Therefore, a positive (negative) value of Analyst Revision reflects an increase (a decrease) in the analyst’s forecast value from her previous forecast.
For a forecast revision of a given analyst, we collect all instances of her colleagues’ realized forecast errors that occurred within the past 30 days. We only retain the realized forecast errors of 1) colleagues who are directly connected to the analyst (i.e. who cover the same industries), and 2) colleagues who cover either the major suppliers or major customers of the analyst’s firms.24 Each realized forecast error is classified as optimistic if
the forecasted value is above the actual reported EPS. We define Colleague Optimism as the proportion of optimistic forecast errors in the 30-day window. Given an analyst in brokerage covering firm and making a forecast revision on date , we let , equate to unity if colleague has a realized forecast error 30 days prior to with the below characteristics, and equate to zero otherwise.
, , , , , i f d j d j i j G j d optimistic revisions total rev ColleagueOptimis isions m (4)24 We identify customer and supplier pairs from the business segment files of Compustat. In accordance with SFAS 14, public firms are required to disclose sales to their principal customers, defined as customers that contribute to at least 10 percent of the total revenue of the firm or if sales to a customer are material to the business of the firm. Principal customer names are manually matched to Compustat GVKEYs following the approach in Fee, Hadlock, and Thomas (2006). For customer names that are abbreviated, we hand-match and use industry affiliations to determine whether the customer is in Compustat. For the remaining unmatched customers, we check their corporate websites in the Directory of Corporate Affiliation (DCA) database to determine if the customer is a subsidiary of a listed firm. If so, we assign the customer to its parent’s GVKEY. To ensure accuracy, we discard any customer name that cannot be unambiguously matched to a GVKEY.
To test the learning channel, we estimate specification (5). 1 2 3 , , , , , , , , , , i f d i t i d i d i t i f t i f t
Analyst Revision α β Centrality Optimism
β Optimism β Centra Analyst Collea lity θ Cont gue Colleague Analys r ε t ols (5)
To assess the conditional effect of Analyst Centrality on Analyst Revision, we include the interaction of Analyst Centrality with Colleague Optimism as the key variable. While analysts may unconditionally revise their forecasts downwards after their colleagues’ forecasts are revealed to be optimistic, we expect this effect to be stronger for central analysts because they participate in inter-colleague information exchange more intensely. We include controls for analyst and brokerage characteristics, and the stock performance of the firm leading up to the forecast revision. Standard errors are double-clustered by year-week and firm to capture dependence in analysts’ revisions.
[Insert Table 6]
Table 6 shows that central analysts are more likely to re-adjust their forecasts in response to their colleagues’ ex-post forecasting mistakes. Column (1) shows that
Colleague Optimism predicts more negative forecast revisions. This suggests that,
unconditionally, analysts’ forecast revisions tend to be more negative in response to a higher incidence of optimistic errors made by their colleagues. In Column (2), the interaction between Analyst Centrality and Colleague Optimism is significantly negative. This implies that central analysts issue more negative revisions in response to their colleagues’ revealed optimism. This suggests that central analysts may have previously incorporated more of their colleagues’ information in their forecasts and now unravel erroneous information.
An alternative interpretation is that when an industry shock occurs, central analysts are too busy to update their forecast due to the complexity of their coverage portfolio. Their revisions would then appear to lag their colleagues’ revisions. However, given that the revisions of central analysts generate larger market reactions (see Table 3), they are more likely to contain novel information. If the revisions of central analysts are delayed
after the news shock, it is unlikely that those revisions would generate significantly larger market reactions.
The results may also reflect a central analyst’s superior ability to process public information because ex-post forecast errors are publicly available information. To rule out the information-processing hypothesis, we introduce Global Optimism, the global analog
of Colleague Optimism. To construct Global Optimism, we collect all realized forecast
errors 1) in the 30 days leading up to the analyst’s revision, and 2) that are not made by the analyst’s colleagues. Global Optimism is the proportion of optimistic forecast errors made by non-colleagues in the 30-day window.25
We add Global Optimism and its interaction with Analyst Centrality to our specification in Column (3). Unconditionally, analysts’ revisions tend to be more negative
as Global Optimism increases. This is unsurprising because realized forecast errors, even
those made by non-colleagues, may be informative. However, the interaction between
Analyst Centrality and Global Optimism no longer predicts the analyst’s revision activity.
This shows that central analysts do not re-adjust their forecasts incrementally to forecast errors outside their brokerages. This finding is inconsistent with the hypothesis that central analysts have superior ability to process public information. In contrast, the interaction between Analyst Centrality and Colleague Optimism remains negative and statistically significant, supporting the learning hypothesis.
3.3. Do all analysts within a brokerage benefit from information exchange?
An interesting question is whether gains from learning also accrue to periphery analysts. Both central and periphery analysts may collectively benefit via two-way feedback in a brokerage. To examine the collective benefit from learning, we create a Network Density
measure (Newman, Watts, and Strogatz, 2002).26 A network is dense (sparse) if its nodes
are strongly (weakly) interconnected among one another, thus allowing for higher
25
We provide additional evidence in Internet Appendix Table 2 that our results hold when we increase the window length from 30 days to 60 days in the constructions of Colleague Optimism and Global Optimism. 26 Appendix I presents the technicalities of Network Density and working examples.
information exchange and flow (Smith-Doerr and Powell, 2010; Gibbert and Durand, 2009). Higher Network Density is likely to improve analyst performance as the rate of information exchange increases among analysts.
For each analyst-year, we construct Outperformance (%) as the proportion of her forecasts with realized forecast errors that are lower than their firm-year averages.27
Analysts with higher values of Outperformance (%) are more accurate than their competitors from other brokerages. We estimate a Tobit model following equation (6) and include controls for analyst experience and portfolio complexity. By construction, Network
Density is normalized by network size but we also explicitly control for brokerage size.
We cluster standard errors at the brokerage-year level.
Outperformance (%)i,t = α+β1·Analyst Centrality i,t-1 + β2·Network Density i,t-1 +ε i,t (6)
[Insert Table 7]
The evidence in Table 7 suggests that both central and periphery analysts benefit from inter-colleague information exchange. In Column (1), we verify that our baseline findings hold at the analyst-year level. We find a positive and significant association between
Analyst Centrality and Outperformance (%). Consistent with our earlier findings, central
analysts have higher forecast accuracy than their periphery colleagues. We include
Network Density to the specification in Column (2) and find that analysts who reside in
denser brokerage networks are more accurate than competing analysts in sparser brokerage networks. This suggests that analysts benefit from a network structure that promotes inter-colleague information exchange for both central and periphery analysts. The positive loading on Analyst Centrality in Column (2) suggests that, while analysts benefit collectively from information exchange, the gains to central analysts are greater than those to their peripheral colleagues.
27
This construction helps to account for firm-specific heterogeneity of forecast difficulty across analysts in a brokerage. In untabulated results, our findings are qualitatively and quantitatively similar when we measure an analyst’s performance as her median Normalized Forecast Error in the year.
By virtue of our network construction methodology, brokerages that cover only one or fewer 2-digit GICS sectors will have mechanically high values of Network Density. To alleviate this concern, we repeat our analysis in Column (3) on a reduced sample of brokerages that cover at least three 2-digit GICS sectors.28 We find that our results in
Column (3) remain quantitatively and qualitatively similar.
Overall, we show that brokerage structures that facilitate inter-colleague information exchange benefit not only central analysts but also their periphery colleagues. However, central analysts benefit disproportionately more from learning in brokerage networks.
4.
Causal effects of analyst centrality on forecast accuracy
An unaddressed issue is the matching process between the analyst and the brokerage house. Concerns relating to brokerage characteristics discussed above are partially addressed in our main tests with the inclusion of brokerage-year fixed effects in our baseline specification. However, it remains that an analyst with expertise in a particular industry may be more likely matched with a brokerage that specializes in that industry. To establish a causal relation between Analyst Centrality and forecast accuracy, we exploit brokerage mergers (Hong and Kacperczyk, 2010; Kelly and Ljungqvist, 2012) from years 2000 to 2007 as exogenous shocks to Analyst Centrality scores.29 For each merger event,
we track all analysts who work at the same acquirer brokerages pre-event and post-event. We further require that each analyst covers the same firm before and after the merger. Therefore, our unit of observation in this quasi-natural experiment is an analyst-firm. Derrien and Kecskes (2013) find that most brokerage mergers are usually motivated by business reasons, suggesting that analysts who leave post-merger, if any, are not systematically different in forecast accuracy. Further, we exclude closures because it is plausible that only high-ability analysts manage to find new employment post-closure. Restricting our analysis to analysts in brokerage mergers alleviates concerns of selection
28
Our results are quantitatively and qualitatively similar when we adopt different values for this arbitrary cutoff.
29
In Appendix III, we document the list of 17 brokerage mergers that we are able to match to our final sample.
bias due to unobserved analyst ability. Essentially, the shocks to Analyst Centrality of analysts emanate from changes in their within-brokerage network structure due to the mergers.
The treatments in this test are Analyst Centrality Up and Analyst Centrality Down.
Analyst Centrality Up is an indicator that equal to one if the analyst’s average
post-merger Analyst Centrality is higher than her average pre-merger value, and to zero otherwise. Analyst Centrality Down is defined symmetrically. Since brokerage mergers are scattered temporally, we use a difference-in-difference model, generalized to accommodate multiple treatment groups, and multiple shocks across time, following Autor (2003). We estimate the specification in (7).
0 , , , , , n g t g t j g t g t g t j m jNormalized Forecast Error γ τ β D t k j θ δ ε
(7)where represents the group (analyst-firm) fixed effects and represents the year fixed effects. is the time at which the brokerage merger occurs, the term , is an indicator which switches to one in year if the group receives the treatment. Note that this generalized model allows to vary in different . This is important because brokerage mergers in our sample occur at various points in time. We let 0 because we skip the year of the brokerage merger. Visual inspection of the parallel trend assumption is tenuous in a model with shocks spread across time. Therefore, we include temporal leads and lags of the treatment in the model to test the assumption econometrically. Building leads and lags of the treatment effect into the model allows us to estimate the pre-treatment dynamics ( leads) and post-pre-treatment dynamics ( lags). The parallel trend assumption is fulfilled if is not statistically significant for 0 – this suggests the absence of anticipatory effects of the treatment.
We use a 6-year window centered on the brokerage merger event. We choose
Normalized Forecast Error as the dependent variable because it is a normalized measure
that allows for comparison of forecast accuracy across different analyst-firms. The key independent variables are the three temporal leads (Pre-Treatment) and three temporal
lags (Post-Treatment) of the treatment. The mth temporal Pre-Treatment is an indicator
that equates to unity only in the mth year before the brokerage merger and only if the
analyst-firm is treated, and zero otherwise. Similarly, the nth temporal Post-Treatment is
an indicator that equates to unity only in the nth year and only if the analyst-firm is
treated, and zero otherwise. Apart from year dummies and analyst-firm dummies, we also add analyst time trends to help control for confounding heterogeneity.
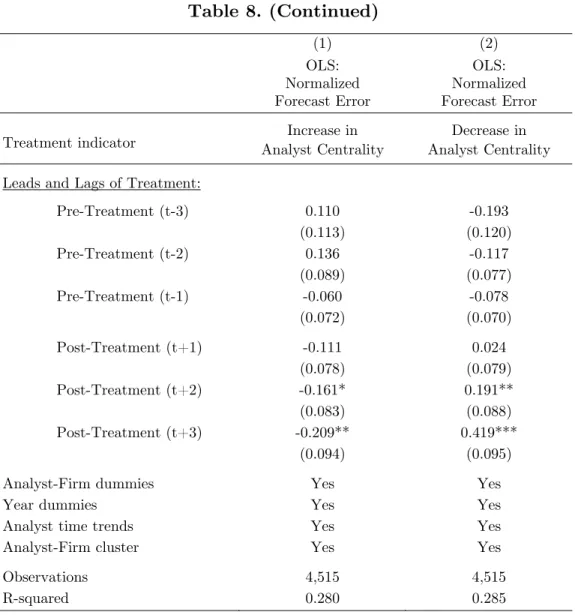
[Insert Table 8]
We present results from the generalized difference-in-difference model in Table 8. In Column (1), we find that the coefficients of the Pre-Treatment indicators are statistically insignificant. This implies that before employment shocks, analysts who experienced
Analyst Centrality Up display no systematic differences in forecast accuracy compared to
analysts whose centrality scores did not improve. Econometrically, anticipatory effects of the treatment are unlikely to be the spurious driver of our results – this helps us to validate the parallel trend assumption. Crucially, this suggests that the assignment of analysts, into more central or less central network positions subsequent to the brokerage mergers, is independent on their pre-shock performance. On the other hand, we find that the positive effects of higher Analyst Centrality on forecast accuracy occur only after treatment has been administered. The weak statistical significance of the t+1
Post-Treatment indicator suggest the presence of post-merger adjustment costs which delay
the gains to learning.
Switching the treatment to Analyst Centrality Down in Column (2) yields symmetrically similar conclusions. In summary, our findings suggest that analysts who experience an increment in Analyst Centrality display higher forecast accuracy than those who did not. Moreover, we show that the differences in forecast accuracy manifest largely in the post-treatment period, and not in the pre-treatment period.
5.
Discussion and robustness tests
In this section, we discuss and analyze alternative explanations to the learning hypothesis. We also perform a series of tests to ensure that our results are robust.
5.1. Does individual ability or talent explain our findings?
Analyst Centrality is likely to capture a component of talent or ability as a talented
analyst may develop high centrality after surviving intense labor market competition. High-ability analysts are also likely to acquire greater coverage responsibilities over time. Therefore, our main tests include control for measures of analyst ability (i.e., experience and lowballing frequency).
To further disentangle the learning hypothesis from the ability explanation, we proxy for another dimension of ability with membership in the All-American Research Team (e.g., Leone and Wu, 2007). Studies show that membership in the Institutional Investor All-American Research Team (All-American) reflects analyst ability.30 We re-estimate the
forecast accuracy and market reaction tests presented in Tables 2 and 3. Due to our limited data on All-American Research Team membership, we end the sample period in 2008 for these additional tests.
[Insert Table 9]
Table 9 shows that our main results are unchanged after controlling for All-American status. In Column (1) of Panel A, we first show that our main centrality results hold in this subsample period. Column (2) includes the All-American indicator. The coefficient estimate on Analyst Centrality remains significantly negative and the economic effect is not statistically distinguishable across Columns (1) and (2). Consistent with prior literature, we also find that All-American analysts are more accurate. The market reaction tests in Panel B yield similar inferences. We first show in Column (1) that during this
30
All-American analysts produces more accurate forecasts (Stickel, 1992), elicit stronger market reactions around their forecasts (Gleason and Lee, 2003), exhibit performance persistence (Leone and Wu, 2007), and attract more investment banking deal flows (Clarke et al., 2007)
sub-sample, central analysts command larger market reactions around their forecast revisions. Column (2) shows our main conclusions are unchanged with the inclusion of the
All-American indicator.
Together, the results suggest that the superior performance of central analyst is unlikely to be completely driven by greater individual ability or talent alone. Of course, it is plausible that talented and highly-skilled analysts acquire higher centrality over time. For instance, the management may design a brokerage network around high-ability analysts to leverage on their expertise. What distinguishes our learning hypothesis is that
Analyst Centrality has incremental explanatory power beyond measures of ability found
in the prior literature.
5.2. Regulation Fair Disclosure
Regulation Fair Disclosure (Reg. FD) eliminated the practice of selective disclosure of information. As access to non-public communications with firm managers was traditionally an important information acquisition channel of analysts, the implementation of Reg. FD posed a paradigmatic shift in analysts’ operations. Mohanram and Sunder (2006) argues that, in the post-Reg. FD regime, analysts may heighten information discovery efforts to offset the impact of reduced access to firm management. Following this argument, insights from inter-colleague information exchange may fill the void that emerged after Reg. FD.
[Insert Table 10]
Table 10 shows how the effect of Analyst Centrality changes with the implementation of Reg. FD. In Column (1), we find that, controlling for brokerage-year fixed effects, central analysts do not exhibit higher forecast accuracy than their periphery colleagues in the pre-Reg. FD period. In contrast, Column (2) shows that Analyst Centrality has a positive and statistically significant impact on forecast accuracy after the implementation of Reg. FD. Economically, the effect of Analyst Centrality in Column (2) is about 17 times the size that in Column (1).
We repeat the split-sample analysis on market reactions to analysts’ forecast revisions. Following our empirical setup in Table 3, we also exclude forecast revisions if they coincide with issuances of Form 8-Ks or earnings announcements for this test. Columns (3) and (4) show that the forecast revisions of central analysts command higher market reactions both before and after the implementation of Reg. FD. Furthermore, the effect of Analyst
Centrality on market reactions, conditional on deviations from the consensus forecast is
also higher in both regimes. However, we do not find statistically significant pre- and post- difference in the effect of Analyst Centrality.
5.3. Are only direct connections important?
Analysts typically issue forecast revisions upon receiving value-relevant information. If information sharing occurs within a brokerage, this information shock is likely to diffuse to other colleagues. Such information may even flow when colleagues are more than ‘one-step’ away. As information propagates through the network, revision-activity may diffuse like a wave through the network. The information propagation may weaken with distance because 1) the information shocks become less value-relevant further away from the origin and 2) analysts have limited information-processing capacities and may not ‘pass on’ the information with fidelity.
Following Ahern and Harford (2014), we construct a measure called
Closeness-weighted Revision Activity that captures these waves of revision activity. For each
analyst-brokerage pair, we find the earliest and latest forecast announcement dates. In between these two dates, we divide the analyst’s tenure at the brokerage by months. We exclude the first and last months of her tenure at the brokerage from our sample to avoid truncation issues. In each month, we construct Revision Count as the total number of forecast revisions made by the analyst. Next, we compute Closeness-weighted Revision