Tobacco and health
in Wales
level, are available at:
www.publichealthwalesobservatory.wales.nhs.uk/tobaccoandhealth
Project team (analysis and writing): Hugo Cosh, Gareth Davies, Ioan Francis, Elinor Griffiths, Leon May, Cath Roberts, Claire Tiffany, Margaret Webber
Project board: Mererid Bowley, Nathan Lester, Cindy Marsh, Cath Roberts, Jane Wilkinson
Acknowledgements
Thanks to the following people for their contribution to this report: Rose Allgeier, Joanna Arthur, Susan Belfourd, Lloyd Evans, Deirdre Hickey, Ciarán Humphreys, Louise Megrath, Isabel Puscas, Salah Sharif (NHS Information Centre)
Contact details
Public Health Wales Observatory 14 Cathedral Rd
Cardiff CF11 9LJ
Email: publichealthwalesobservatory@wales.nhs.uk Website: www.publichealthwalesobservatory.wales.nhs.uk
For further information or to request printed copies of this report, please contact us.
Publication details / copyright statement
Title: Tobacco and health in Wales
Publisher: Public Health Wales NHS Trust / Welsh Government
Date: June 2012
Key messages 5
1 Introduction 6
2 The prevalence of tobacco use 7
2.1 Adults 7
2.1.1 Adults with mental health problems 15
2.2 Maternity, children and young people 16
3 Exposure to second-hand smoke 20
3.1 Adults 20
3.2 Children 22
4 Prevention and cessation 24
4.1 National prevention initiatives 24
4.2 How many smokers would like to quit, and why? 25 4.3 People using Stop Smoking Wales to help them quit 25
4.4 Use of medicines to help people stop smoking 28
5 Impact of tobacco use on health and health services 30
5.1 Maternity, children and young people 30
5.1.1 Hospital admissions in children attributable to second-hand smoke 31
5.2 Adults 33
5.2.1 Smoking-attributable mortality 33
5.2.2 Contribution of smoking to overall inequality in mortality rates 38 5.2.3 Mortality from specific causes of death related to smoking 40
5.2.4 Smoking-attributable hospital admissions 42
6 Affordability 48
7 Examples of successful tobacco control policy from California 49 and Singapore
8 Implications for public health 51
Figure 1 Estimated annual consumption of tobacco products in UK males and females aged 15+, kilograms per adult, 1905-1987 page 6
Figure 2 Percentage of adults who reported smoking daily, OECD countries, 2009
page 8
Figure 3 Percentage of adults who reported smoking daily or occasionally, by country, 2010 page 8
Figure 4 Percentage of adults who reported smoking daily or occasionally, Wales, 1978-2010 page 9
Figure 5 Percentage of adults who reported smoking daily or occasionally, Wales, 2003/04-2010 page 10
Figure 6 Percentage of adults who reported smoking daily or occasionally, Wales, by age and sex, 2003/04 and 2010
page 10
Figure 7 Percentage of adults reporting specific smoking status, by sex, 2010 page 11
Figure 8 Percentage of adults who reported smoking daily or occasionally, by local authority and health board, age-standardised, 2009-10 page 12
Figure 9 Percentage of adults who reported smoking daily or occasionally, by Upper Super Output Area (USOA), age-standardised, 2003/04-2009 page 13
Figure 10 Percentage of adults who reported smoking daily or occasionally, by deprivation fifth (Welsh Index of Multiple Deprivation 2008), age-standardised, 2003/04-2010 page 14
Figure 11 Percentage of adults who reported smoking daily or occasionally, by household National Statistics Socio-economic Classification, age-standardised, 2003/04-2010 page 14
Figure 12 Percentage of mothers, by UK nation, who: a) smoked throughout pregnancy and b) were smokers but gave up before or during pregnancy page 16
Figure 13 Percentage of mothers in Wales, by individual National Statistics Socio-economic Classification, who: a) smoked throughout pregnancy and b) were smokers but gave up before or during pregnancy page 17
Figure 14 Percentage of mothers in Wales, by age, who: a) smoked throughout pregnancy and b) were smokers but gave up before or during pregnancy page 17
Figure 15 Percentage of 15 year-olds who smoke at least once a week by country and sex, 2009/10 page 18
Figure 16 Percentage of 11-16 year-olds who smoke at least once a week by health board, 2009 page 19
Figure 17 Percentage of 15 years-olds in Wales who smoke at least once a week by sex, 1990-2009 page 19
Figure 18 Percentage of non-smoking adults who reported being regularly exposed to other people’s tobacco smoke, 2010 page 20
Figure 19 Percentage of non-smoking adults who reported being regularly exposed to other people’s tobacco smoke, 2003/04-2010
page 21
Figure 20 Percentage of children living in households where adults smoke, by household National Statistics Socio-economic Classification, 2009-10
page 22
Figure 21 Percentage of 11-16 year-olds exposed to smoke in cars by health board, 2009
page 23
Figure 22 Percentage of adult smokers citing specific reasons for wanting to give up smoking, 2010 page 25
Figure 23 Use of Stop Smoking Wales: i) given an appointment, ii) attended assessment, iii) attended treatment, iv) quit at four weeks (self-reported), 2005/06-2010/11 page 26
Figure 24 Quit rate after four weeks (self-reported), percentage of all smokers attending at least one treatment session,
2005/06-appointment, and b) attended treatment, age-standardised rate per 1,000 estimated smokers in Wales, by deprivation fifth (Welsh Index of Multiple Deprivation 2011)
page 27
Figure 26 Quit rate after four weeks, 2011, a) self-reported and b) CO-validated, age-standardised percentage of all smokers attending at least one treatment session, by deprivation fifth (Welsh Index of Multiple Deprivation 2011) page 28
Figure 27 Annual NHS primary care prescribing expenditure in Wales on pharmacotherapy for smoking cessation, 2006-2011 page 28
Figure 28 Age-specific hospital admission rates per 100,000 for selected childhood diseases attributable to second-hand smoke exposure, Wales residents by deprivation fifth (Welsh Index of Multiple Deprivation 2011), 2008-10 page 32
Figure 29 Breakdown of deaths attributable to smoking for selected causes, age 35 and over, 2010 page 34
Figure 30 Smoking-attributable mortality, age 35 and over, age-standardised rate per 100,000, all persons, English Regions and Wales, 2007-09 page 35
Figure 31 Smoking-attributable mortality, age 35 and over, Wales and most/least deprived fifth (Welsh Index of Multiple Deprivation 2011), age-standardised rate per 100,000, 2001-03 to 2008-10 page 36
Figure 32 Smoking-attributable mortality, age 35 and over, local authorities and health boards, age-standardised rate per 100,000, 2008-10
page 37
age-standardised rate per 100,000, 2008-10 page 38
Figure 34 Percentage of inequality in mortality attributable to smoking, age 35 and over, 2001-03 to 2008-10 page 39
Figure 35 Mortality from key causes of death, age under 75, UK, Wales and most/least deprived fifth (Welsh Index of Multiple Deprivation 2011), age-standardised rate per 100,000, 2001-03 to 2008-10 page 41
Figure 36 Counts of hospital admissions attributable to smoking for selected causes, age 35 and over, 2010 page 43
Figure 37 Smoking-attributable hospital admissions, age 35 and over, age-standardised rate per 100,000, English Regions (2009/10), Wales (2009) page 44
Figure 38 Smoking-attributable hospital admissions, age 35 and over, Wales and most/least deprived fifth (Welsh Index of Multiple Deprivation 2011), age-standardised rate per 100,000, 2001-03 to 2008-10 page 45
Figure 39 Smoking-attributable hospital admissions, age 35 and over, local authorities and health boards, age-standardised rate per 100,000, 2008-10 page 46
Figure 40 Smoking-attributable hospital admissions, age 35 and over, Upper Super Output Areas (USOAs), age-standardised rate per 100,000, 2008-10 page 47
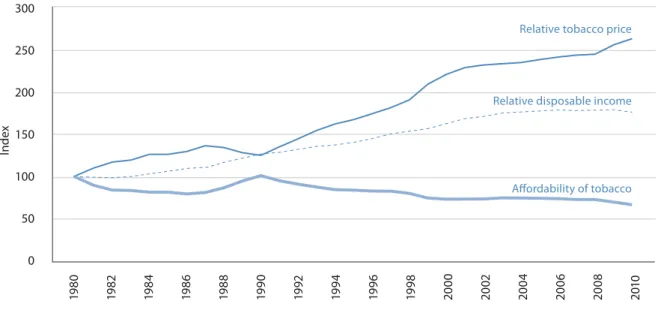
Figure 41 Change in affordability of tobacco over time, UK, 1980-2010 page 48
Table 1 Number of peer supporters trained by ASSIST programme, 2008/09-2010/11
page 24
Table 2 Number of community pharmacies providing smoking cessation services by health board, 2011 page 29
Table 4 Counts and percentages of deaths
attributable to smoking, age 35 and over, by cause and deprivation fifth (Welsh Index of Multiple Deprivation (WIMD) 2011), 2010
page 33
Table 5 Counts and percentages of hospital admissions attributable to smoking, age
This report lays bare the impact of tobacco on health in Wales. Over half a century since Doll and Hill demonstrated the harmful effect of smoking on health, smoking continues to be the single greatest avoidable cause of death causing almost one in five deaths in Wales. Almost one in four adults continue to smoke in 2010 and over 27,500 admissions to hospital were due to smoking. One in five children are regularly exposed to indoor tobacco smoke causing around 500 children to be admitted to hospital each year.
Reducing smoking prevalence and exposure to second-hand smoke is a priority of Our Healthy Future, the public health strategic framework for Wales. A Tobacco Control Action Plan has now been developed. This has the key aim of reducing the prevalence of smoking in Wales to 16 per cent by 2020. The ban on smoking in enclosed public spaces introduced in 2007 has already begun to pay dividends as demonstrated by the significant reductions in exposure to second-hand smoke shown in this report. However, there are clear challenges. Some sections of society, such as those of lower socio-economic groups have shown little or no reduction in smoking prevalence in recent years.
Recent work by the Public Health Wales Observatory, Measuring Inequalities: Trends in mortality and life expectancy, highlighted the widening and unacceptable inequalities in health between the most deprived and least deprived areas of our country. Fairer Health Outcomes for All sets out the Welsh Government’s strategy for reducing health inequities. This report reveals how smoking is estimated to cause around 30 per cent of the total inequality in death rates between the most and least deprived areas in Wales. To tackle these inequalities we must look beyond smoking itself, to the ‘causes of the causes’. Differences in the prevalence of smoking can be attributed to social determinants of health such as education and employment. If we are to be successful in further reducing the prevalence of smoking in Wales we must target those wider social determinants.
Other countries have shown that with bold and sustained action, the prevalence of smoking can be reduced to the levels aspired to in the Tobacco Control Action Plan. Government, the health service and wider society must commit to realising this aspiration.
We congratulate our colleagues at Public Health Wales and the Welsh Government for producing the most comprehensive picture of tobacco and health in Wales to date. It shows how far we have come. It demonstrates how much further we need to go.
t 4NPLJOHDPOUJOVFTUPCFUIFHSFBUFTUTJOHMFDBVTFPGBWPJEBCMFNPSUBMJUZJO8BMFT*OQFPQMF aged 35 and over, smoking causes nearly one in five of all deaths and around one third of the inequality in mortality between the most and least deprived areas.
t 5XFOUZUISFF QFS DFOU PG BEVMUT EFTDSJCFE UIFNTFMWFT BT DVSSFOU TNPLFST JO 5IJT JT considerably lower than in the 1970s, but the fall in rates has slowed down in recent years. Considerable efforts are therefore required to meet the Welsh Government’s target of 16 per cent by 2020.
t 0WFSBMMTNPLJOHJTNPSFDPNNPOJONBMFTUIBOJOGFNBMFTBMUIPVHIJODIJMESFOBOEZPVOH people the reverse is true. Rates of smoking in males aged 25-34 and 35-44 are particularly high (37 per cent and 31 per cent respectively) and have not reduced appreciably in the last seven years. Latest estimates suggest that around one in six girls aged 15-16 are regular smokers, compared to one in nine boys. Smokers in this age group reported starting at an average of just 12 years of age.
t 4NPLJOHSBUFTBSFIJHIFTUJOUIFNPTUEFQSJWFEBSFBTPG8BMFT.PSFUIBOQFSDFOUPGQFPQMF who have never worked or are unemployed are current smokers, with no recent signs of this figure decreasing. Smoking rates in managerial and professional groups continue to fall. These trends are likely to contribute to widening health inequalities in the future.
t "SPVOE POF JO TJY GFNBMFT MJWJOH JO 8BMFT TNPLF UISPVHIPVU QSFHOBODZ UIF IJHIFTU SBUF PG all UK nations, though this has fallen since 2005. Older mothers and those in managerial and professional groups are most likely to give up smoking during pregnancy.
t 5IFCBOPOTNPLJOHJOFODMPTFEQVCMJDQMBDFTIBTMFEUPDPOTJEFSBCMFGBMMTJOQFPQMFT exposure to second-hand smoke. However, 39 per cent of children live in households where at least one adult is a current smoker, and 20 per cent report recent exposure to second-hand smoke in cars. Exposure is most likely in children of parents who are unemployed or in routine and manual occupations, and children living in more deprived areas are more likely than their less deprived peers to be admitted to hospital for diseases associated with second-hand smoke. t *OTFWFOPVUPGUFOTNPLFSTSFQPSUFEUIBUUIFZXPVMEMJLFUPHJWFVQBOEBSPVOETJYPVU
of ten smokers receiving support from Stop Smoking Wales reported success at the four-week point.
t 0WFSBMMSBUFTPGEFBUIGSPNTNPLJOHBSFGBMMJOHCVUTPDJPFDPOPNJDJOFRVBMJUJFTBSFXJEFOJOH due to faster falls in the least deprived parts of Wales than in the most deprived. Lung cancer mortality rates in females have risen in Wales and the UK over the last ten years, whereas in males they have fallen slightly. This is likely a reflection of the differences in the historical patterns of smoking between males and females in the late 20th century.
t 4NPLJOH JT FTUJNBUFE UP DBVTF BSPVOE IPTQJUBM BENJTTJPOT FBDI ZFBS JO 8BMFT 5IJT represents a considerable burden on the health service.
t 5PCBDDPJTBSPVOEQFSDFOUMFTTBGGPSEBCMFUIBOJOCVUUIFFGGFDUJWFOFTTPGQSJDFBTB control measure is diminished by continued access to smuggled products.
t .BKPS SFEVDUJPOT JO TNPLJOH QSFWBMFODF BSF BDIJFWBCMF HJWFO FWJEFODF GSPN $BMJGPSOJB and Singapore.
The current impact of tobacco use on the health in Wales has its origins in the 20th century, which saw the rise and fall of the smoking epidemic in the UK as a whole. Men were already commonly using tobacco in the 1900s, when manufactured cigarettes were not yet widespread, and as figure 1 shows, consumption rose rapidly and reached a peak around the Second World War. In 1948, an estimated 80 per cent of men were tobacco users1. Having been considered
socially unacceptable prior to the liberation of women associated with the Suffragette movement in the 1920s2, tobacco use in women started later than in men, with estimated prevalence
reaching 45 per cent in 19661.
The realisation in the 1950s and 1960s that smoking causes major harm to health, thanks in part to the long-term study of male British doctors carried out by Richard Doll and colleagues3,
led to falling tobacco consumption in the UK in the latter part of the 20th century.
However, the impact of long-term smoking on the young adults of the 1960s and 1970s, when around half the population were tobacco users, continues to be visible in high rates of lung cancer and other smoking-related diseases today.
Furthermore, whilst great strides have been taken in the lowering of smoking prevalence to around one in four adults in Wales, and exposure to second-hand smoke has been reduced by the ban on smoking in enclosed public places in 2007, considerable challenges remain in the drive to stop young people starting to smoke and to help smokers to stop. Dependence on tobacco remains a serious form of drug addiction2, appearing to offer an escape from the stress
of socio-economic deprivation whilst exacerbating it by draining income and harming health4.
These challenges are recognised by Our Healthy Future5, Wales’ current strategy for improving
health, which made reducing levels of smoking one of its ten priority outcomes and advocated the development of the recently-published Tobacco Control Action Plan for Wales6.
This report provides a range of information to support the implementation of this action plan, updating Smoking in Wales: Current Facts which was published in 2007 by the Welsh Government and Wales Centre for Health. An accompanying technical guide detailing data sources, methods and caveats is available on the Public Health Wales Observatory website, along with interactive spreadsheets containing additional data.
1 Introduction
Figure 1
Estimated annual consumption of tobacco products in UK males and females aged 15+, kilograms per adult, 1905-1987
2
The prevalence of tobacco use
Manufactured filter cigarettes remain the most popular form of tobacco product in Great Britain. However, whereas 25 per cent of male smokers and 8 per cent of female smokers in 1998 reported using mainly hand-rolled cigarettes, these figures rose to 39 and 23 per cent respectively in 20107. This may reflect the increased use of smuggled hand-rolling tobacco due
to its substantially lower cost (see section 6).
In minority ethnic groups, different tobacco products are used more commonly than in the general population8. Smokeless tobacco comes in a variety of forms, including chewing tobacco,
which a survey found to be particularly common in Bangladeshi women9.The packaging of
these alternative forms of tobacco is less likely to have appropriate health warnings and their use is embedded in South Asian culture8, which presents considerable challenges to cessation
services.
The smoking of waterpipes (also known as shisha), which originated in the Middle East and parts of Asia and Africa, is becoming more popular in Europe and can give a misleading impression of being a “safe” alternative to cigarettes since the smoke passes through water first10.According
to the British Heart Foundation, a single puff of shisha is equivalent to inhaling the smoke from a whole cigarette11.
2.1 Adults
This section analyses the smoking behaviour of adults (those aged 16 and over) and the prevalence amongst different population sub-groups. The information is taken from surveys where adults may or may not tell the truth about their smoking status. This could lead to bias in the results, for example if certain sub-groups are less likely to admit to smoking than others due to perceptions of social acceptability.
The variation shown between the results of the Welsh Health Survey and the General Lifestyle Survey is likely to be due to differences in their methods, definitions and sample sizes. For example, the Welsh Health Survey has an annual sample size of around 15,000, compared to less than 1,000 in the case of the General Lifestyle Survey. It should also be noted that figures quoted from the General Lifestyle Survey include cigarette smokers only, and may exclude a small number of people who smoke only a pipe or cigar.
International and Great Britain smoking rates
Comparability between international smoking rates is likely to be limited by methodological differences in health surveys across countries. There may be differences in the question wording, the response categories, the age groups covered and the related administrative methods. However, using daily smoking rates of other Organisation for Economic Co-operation and Development (OECD) countries as a guide for comparison, Wales ranks roughly in the middle (figure 2). An outline of tobacco control measures in countries with comparatively low smoking prevalence can be found in section 7.
Figure 2
Percentage of adults who reported smoking daily, OECD countries, 2009
Source: OECD; Welsh Health Survey (Welsh Government)
(a) Note that international comparability is limited due to the lack of standardisation in the measurement of smoking habits in health interview surveys across OECD countries. There is variation in the wording of the question, the response categories, the age groups covered and the related administrative methods.
(b) OECD countries with missing data for 2009 have been omitted from the chart.
Figure 3
Percentage of adults who reported smoking daily or occasionally, by country, 2010
Smoking is less common in England than in Wales and Scotland. Around one in four adults in Wales and Scotland reported themselves to be cigarette smokers in 2010, compared to one in five in England (figure 3).
Smoking trends in Wales
Information on smoking behaviour among adults has been reported since the 1970s through the General Lifestyle Survey. Caution is needed in interpreting the results of this survey due to the small sample size for Wales, but the overall percentage of the population who smoke cigarettes has generally decreased over the period shown in figure 4, from 40 per cent in 1978 to between 20 and 25 per cent in recent years.
Figure 4
Percentage of adults who reported smoking daily or occasionally, Wales, 1978-2010
Source: General Lifestyle Survey (Office for National Statistics)
(a) Weighting applied by ONS to compensate for non-response. Technical reports from the survey show that the weighted percentage of smokers has been around one per cent higher than the unweighted percentage from 1998 onwards.
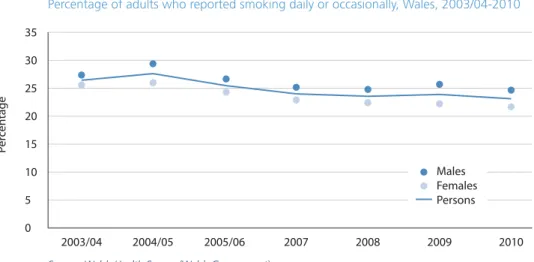
Figure 5 shows trend data for adult smokers from the Welsh Health Survey. This has a much larger sample size than the Welsh sample of the General Lifestyle Survey and the results are therefore less subject to random fluctuation and can be analysed in more detail. The chart shows that smoking remains slightly more common in males than females over this period. The relatively slow pace of decline in smoking rates in recent years, to 23 per cent in 2010, represents a considerable challenge given the target of reaching 16 per cent by 2020 set by the Tobacco Control Action Plan for Wales6.
Most age groups have seen a slight decline in smoking rates since 2003/04, although most of the decreases are not statistically significant (figure 6). The rates of male smokers aged 25-34 and 35-44 in 2010 remain at similar levels to 2003/04, however, female smoking rates have decreased for these age groups. The rates of male smokers aged 45-54 and 75+ have decreased since 2003/04, but there has been little change in the 65-74 age group. It can be seen that the prevalence of smoking decreases with age.
Figure 5
Percentage of adults who reported smoking daily or occasionally, Wales, 2003/04-2010
Figure 6
Percentage of adults who reported smoking daily or occasionally, Wales, by age and sex, 2003/04 and 2010 Source: Welsh Health Survey (Welsh Government)
Smoking status
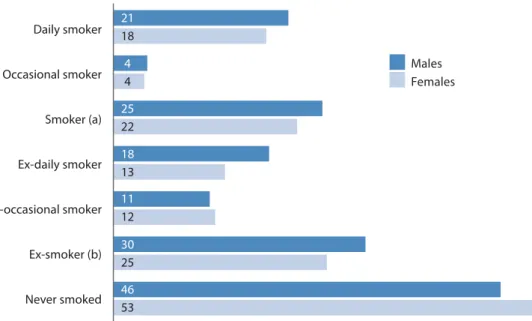
In the 2010 Welsh Health Survey, 23 per cent of adults reported that they currently smoke, 27 per cent reported that they used to smoke, and 50 per cent reported that they have never smoked. This suggests that around 570,000 adults in Wales smoke (either daily or occasionally).
Figure 7 illustrates that a slightly higher proportion of males reported themselves to be smokers (25 per cent) compared with females (22 per cent). The percentage of adults who have never smoked is higher amongst females than males. However, the fact that around half of people surveyed had tried smoking at some point illustrates the challenge of preventing people from taking up this highly addictive habit.
Figure 7
Percentage of adults reporting specific smoking status, by sex, 2010
Source: Welsh Health Survey (Welsh Government)
(a) ‘Smoker’ indicates those who smoke either daily or occasionally. (b) ‘Ex-smoker’ indicates those who used to smoke either daily or occasionally.
Figure 8
Percentage of adults who reported smoking daily or occasionally, by local authority and health board, age-standardised, 2009-10
Source: Welsh Health Survey (Welsh Government) Horizontal lines ( ) show 95 per cent confidence interval
Smoking by geographic area
Combining data from the 2009 and 2010 Welsh Health Surveys, adult smoking rates were highest in the South Wales Valleys areas of Blaenau Gwent and Rhondda Cynon Taf (figure 8). These areas experience high levels of deprivation12 and as shown in figures 10 and 11, smoking
rates in the most deprived areas of Wales rise to around 35 per cent. The variation between levels of smoking across Wales is a key contributor to health inequalities (section 5.2). In 2009-10, nine percentage points separated the smoking rates of Blaenau Gwent and Monmouthshire.
Source: Welsh Health Survey (Welsh Government)
The map in figure 9 shows adult smoking rates using Upper Super Output Areas (USOAs), a statistical geography. Wales has 94 USOAs with a consistent population size of around 30,000. Welsh Health Survey data from 2003/04 to 2009 was combined to increase the sample size for these areas and improve the precision of the estimates. Smoking rates are high across the South Wales Valleys regions, and also in parts of Cardiff, Barry (in The Vale of Glamorgan) and North West Wales. Greater variation can be seen across USOAs in Wales compared to local authority and health board areas (figure 8), with rates ranging from around 14 to 35 per cent.
Figure 9
Percentage of adults who reported smoking daily or occasionally, by Upper Super Output Area (USOA), age-standardised, 2003/04-2009
USOA boundary Local authority boundary
31.5 to 35.8 (4) 27.1 to 31.5 (30) 22.7 to 27.1 (33) 18.3 to 22.7 (25) 13.9 to 18.3 (2)
© Crown Copyright and database right 2012. Ordnance Survey 100044810
Source: Welsh Health Survey, Welsh Index of Multiple Deprivation (Welsh Government)
As suggested by figures 8 and 9, adult smoking rates are highest in the most deprived parts of Wales (figure 10). This analysis has been carried out by combining small areas across Wales into five groups (‘fifths’), based on ranked deprivation scores from the Welsh Index of Multiple Deprivation 2008. All fifths have experienced a slight decline in smoking rates since 2003/04, however, the inequality between the most and least deprived areas (groups 5 and 1) in 2010 remains similar to 2003/04, with rates in the most deprived areas remaining more than twice as high as the least deprived.
Source: Welsh Health Survey (Welsh Government) Figure 11
Percentage of adults who reported smoking daily or occasionally, by household National Statistics Socio-economic Classification, age-standardised, 2003/04-2010
Figure 10
Percentage of adults who reported smoking daily or occasionally, by deprivation fifth (Welsh Index of Multiple Deprivation 2008), age-standardised, 2003/04-2010
The magnitude of the challenge to reduce smoking rates to 16 per cent in Wales by 2020 is illustrated by figure 11. In households headed by someone who has never worked or who is long term unemployed, 44 per cent of adults reported to be smoking. This is based on a fairly small number of respondents, showing fluctuation over time, but there is little sign of a downward trend. Smoking rates have dropped slightly among adults in routine/manual households, to around 30 per cent, but not as much as those in managerial/professional households. This has resulted in an increasing inequality between the smoking rates of adults in managerial/ professional households and routine/manual and never worked/long term unemployed households between 2003/04 and 2010.
This pattern, if allowed to continue, is likely to contribute to widening health inequalities in the future. For this reason, cessation services such as Stop Smoking Wales aim to target people in more deprived areas13. However, if tobacco use begins as an attempt to relieve the stress of
socio-economic deprivation4, then action to improve education, employment and the physical
environment is also required to help people stop smoking.
People with mental health problems are more likely to smoke, and also to smoke more heavily, than the general population14. This may be due to tobacco use offering the illusion
of reducing stress and anxiety15. It may also be that increased socio-economic deprivation
acts as a confounding factor, contributing to increased prevalence of both mental illness and smoking; each are considerably more common in the most deprived areas of Wales than in the least deprived16. Around 14 per cent of current smokers in Wales report being treated
for a mental illness, compared to 8 per cent of people who used to or have never smoked (age-standardised percentages)17.
Life expectancy in people with schizophrenia is thought to be 20 per cent lower than the general population, a difference which has been partly attributed to high rates of smoking18.
This places an imperative on the health service to ensure that both patients’ physical and mental health are looked after19.
The prevalence of smoking is thought to be as high as 70 per cent amongst inpatients in mental health units20. In Wales, these units are exempted from the 2007 ban on smoking in enclosed
public places, whereas in England an initial exemption was withdrawn in July 2008, one year after the implementation of smoke-free legislation.
Smoking in pregnancy
The Infant Feeding Survey is run every five years in the UK, collecting information about the smoking and drinking behaviour of mothers before, during and after pregnancy.
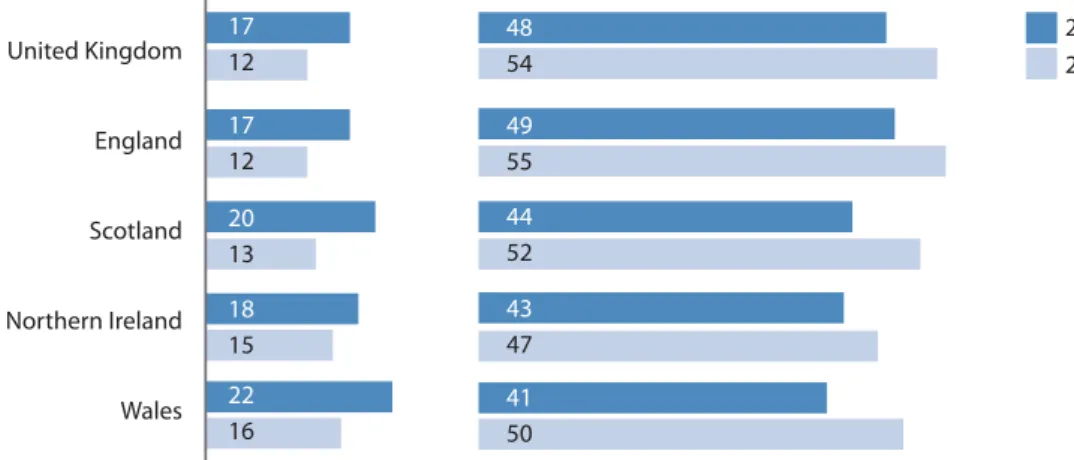
Figure 12 shows that in 2010, the proportion of mothers smoking throughout pregnancy was highest in Wales at 16 per cent, although this is lower than the figure of 22 per cent in 2005. Half of mothers in Wales who were previously smokers had given up before or during pregnancy in 2010, whereas in 2005 the corresponding figure was 41 per cent.
Echoing the pattern shown in figure 11, smoking throughout pregnancy is most common in the routine/manual and never worked groups, whereas the proportion who gave up is highest in the managerial/professional group (figure 13). However, the proportion of mothers in the routine/manual group who stopped smoking has increased from 33 per cent in 2005 to 49 per cent in 2010.
2.2 Maternity, children and young people
Figure 12
Percentage of mothers, by UK nation, who:
a) smoked throughout pregnancy b) were smokers but gave up before or during pregnancy
Figure 13
Percentage of mothers in Wales, by individual National Statistics Socio-economic Classification, who:
a) smoked throughout pregnancy b) were smokers but gave up before or during pregnancy
*Data should be treated with caution due to small sample size Source: Infant Feeding Survey (NHS Information Centre)
Although the overall proportion of mothers who smoked during pregnancy in Wales is 16 per cent, this is much higher in the lower age groups at 32 per cent and 27 per cent for the under 20 and 20-24 age groups respectively in 2010 (figure 14). However, the former figure has fallen from 51 per cent in 2005, which is a positive sign. Older mothers were generally more likely to stop smoking than younger mothers.
Figure 14
Percentage of mothers in Wales, by age, who:
a) smoked throughout pregnancy b) were smokers but gave up before or during pregnancy
Girls in Wales are more likely to report smoking weekly than their male counterparts (figure 15). The numbers of boys (11 per cent) and girls (16 per cent) smoking in Wales are similar to their counterparts elsewhere in Great Britain and Ireland.
Smoking in children and young people
One of the key priority areas for the Welsh Government is to address smoking among children and young people6. Smoking behaviour often starts during adolescence and affects health in
later life. The average age at which children aged 15 in Wales start to smoke is just 12 years old21, with eight out of ten smokers starting before the age of 197.
The charts below illustrate results from the Health Behaviour in School-aged Children (HBSC) survey. This is an ongoing international study with a consistent protocol; the latest survey in Wales received 9,194 completed questionnaires from secondary school children between October 2009 and January 2010 (see online technical guide for more information).
Figure 15
Percentage of 15 year-olds who smoke at least once a week by country and sex, 2009/10
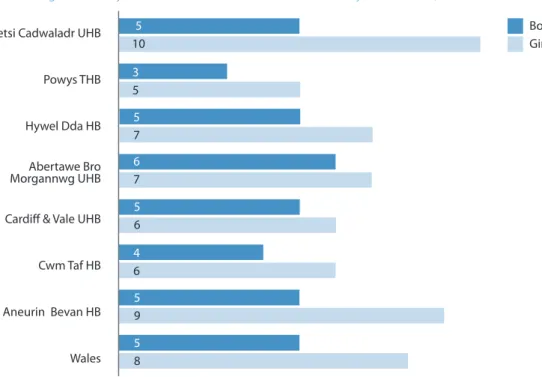
Figure 16 shows that girls are consistently more likely to smoke than boys across all health board areas in Wales. This is particularly evident in Aneurin Bevan and Betsi Cadwaladr University health boards where girls are approximately twice more likely to smoke than boys. Children and young people living in these areas are also almost twice as likely to smoke regularly than those living in Powys Teaching Health Board. It is noteworthy that whereas adult smoking prevalence is highest in Cwm Taf (figure 8), rates in young people are comparatively low, although this may reflect the relatively small sample size by health board.
Figure 16
Percentage of 11-16 year-olds who smoke at least once a week by health board, 2009
Figure 17
Percentage of 15 years-olds in Wales who smoke at least once a week by sex, 1990-2009
Source: Health Behaviour in School-Aged Children survey (World Health Organisation/Welsh Government)
The legislation passed in April 2007 to ban smoking in enclosed public places in Wales was intended to reduce people’s exposure to second-hand smoke, which appears to have been successful (section 3.1).
The further reduction of exposure to second-hand smoke is the fourth action area within the Welsh Government’s Tobacco Control Action Plan. Setting an example for other organisations, health boards in Wales are gradually making their hospital grounds completely smoke-free. National work is also planned by Public Health Wales and ASH Wales to review smoke-free homes initiatives and encourage local promotion of appropriate schemes.
Figure 18 shows that of all adult non-smokers, 15 per cent reported being exposed to other people’s smoke in other people’s homes, 7 per cent in their own homes, 6 per cent whilst travelling by car, and 6 per cent in other places indoors. Adults’ reported exposure to second-hand smoke decreased with age, and this applied for all the places specified.
In 2010, 21 per cent of adult non-smokers reported being regularly exposed to other people’s tobacco smoke indoors, and 33 per cent indoors or outdoors.
3
Exposure to second-hand smoke
3.1
Adults
Source: Welsh Health Survey (Welsh Government) Figure 18
Percentage of non-smoking adults who reported being regularly exposed to other people’s tobacco smoke, 2010
Figure 19
Percentage of non-smoking adults who reported being regularly exposed to other people’s tobacco smoke, 2003/04-2010
Source: Welsh Health Survey (Welsh Government)
The trend in exposure to second-hand smoke (figure 19) reflects a question change on the Welsh Health Survey in 2008. Prior to this, there was no specific guidance to respondents about recording exposure to smoke outdoors. From 2008, the question was revised and asked about exposure indoors and outdoors separately. It also revised the locations asked about in order to reflect the ban on smoking in public places implemented during 2007.
The chart shows that the percentage of non-smokers regularly exposed to second-hand smoke dropped considerably from 66 per cent in 2005/06 to 42 per cent in 2007, coinciding with the implementation of the smoking ban in Wales which came into force on 2nd April 2007, ending smoking in enclosed and substantially enclosed public places. Since 2008, second-hand smoking rates have remained fairly constant, for those exposed indoors or outdoors and indoors only.
Figure 20
Percentage of children living in households where adults smoke, by household National Statistics Socio-economic Classification, 2009-10
Initial concerns that banning smoking in enclosed public places would lead to increased smoking at home, and therefore increased exposure of children to second-hand smoke, appear to have been unfounded. Studies of primary school children in Wales22 and Scotland23 found no
increase in exposure, and even suggested a slight decrease, possibly due to parents responding to smoke-free legislation by smoking less at home.
Children living in households where adults smoke
In 2010, results from the Welsh Health Survey showed that 39 per cent of children lived in households where at least one adult was a current smoker, and 17 per cent of children lived in households where at least one adult had smoked in their home in the past seven days.
The percentage of children living in households where at least one adult was a current smoker increases considerably from managerial and professional households through to households headed by someone who had never worked/was long term unemployed (figure 20). Similarly, the percentage of children living in households where an adult had smoked at home in the previous week was five times higher in routine and manual households (25 per cent) compared with managerial and professional households (5 per cent).
Figure 20 also appears to indicate differences in the propensity of adult smokers to smoke in homes where children are present. In managerial and professional households, 21 per cent of children lived with at least one current smoker, yet only 5 per cent of children in these households lived with an adult who had recently smoked in the home. In households headed by someone who had never worked/was long term unemployed, 62 per cent of children lived with a current smoker and 38 per cent with an adult who had recently smoked in the home.
Analysis by area of residence using the Welsh Index of Multiple Deprivation showed similar results, with over twice as many children in the most deprived areas living in households where
3.2
Children
Children exposed to smoking in cars
Although the ban on smoking in public places introduced in 2007 protects people from second-hand smoke when travelling on public transport, the same level of protection does not apply when travelling by car. Unlike adults, children are often unable to control whether or not they are exposed to second-hand smoke in cars.
Whilst the smoking ban has had a positive impact in reducing exposure to second-hand smoke in enclosed public places and workplaces, the proportion of children who report being exposed to smoking in cars remains high at 20 per cent (figure 21). The Welsh Government launched a campaign in February 2012 called Fresh Start Wales, calling on adults to keep their cars smoke free to protect children, with a pledge to consider legislation if this does not lead to falls in exposure.
Children living in the Betsi Cadwaladr health board area are more likely to be exposed to second-hand smoke in cars when compared to other health board areas in Wales (figure 21). In fact, nearly one in three girls living in the Betsi Cadwaladr health board area said that they were exposed to smoking the last time they travelled by car. Conversely, one in six boys and girls living in the Cardiff and Vale health board area reported exposure to smoke during their last car journey. Findings for other health board areas are comparable to the Welsh average.
Figure 21
Percentage of 11-16 year-olds exposed to smoke in cars by health board, 2009
Table 1
Number of peer supporters trained by ASSIST programme, 2008/09-2010/11
Source: Public Health Wales
Reducing the uptake of smoking and lowering smoking prevalence are two of the key action areas within the Welsh Government’s Tobacco Control Action Plan. Considerable efforts will be required, both in preventing young people from starting to smoke and helping smokers to quit, in order to meet the target set within the Action Plan of reducing the adult prevalence of smoking in Wales to 16 per cent by 2020.
The health benefits of both these strategies are clear. A major study of cigarette smoking found that quitting at age 60, 50, 40, or 30 years old gained an estimated 3, 6, 9, or 10 years of life expectancy respectively3.
The ASSIST programme24 aims to stop young people starting to smoke by training influential
year 8 students as peer supporters. Having been nominated as ‘respected’ and ‘looked up to’ by other students, these peer supporters are given initial training and follow-up support to discourage smoking within their year group through informal conversations about the risks of tobacco use.
The programme, which is run by Public Health Wales, trained 1400 peer supporters from 46 schools in 2010/11 (table 1), which represents 21 per cent of the 223 schools in Wales. This is a considerable increase from the 500 peer supporters from 17 schools trained in 2008/09.
Smokefree Class25 and Smokebugs! are two further national smoking prevention projects for
children and young people. The former is a European initiative run in years 7 and 8, with pupils pledging as a class to remain smoke free. Smokebugs! is a club for younger children (years 4 to 6) which had around 9,400 members in November 2011. Newsletters and activity packs are sent to members, aiming to help them choose not to start smoking, along with discounts for local attractions.
4
Prevention and cessation
4.1 National prevention initiatives
2008/09 2009/10 2010/11 17 39 46 500 1100 1400 Year of schoolsNumber supporters (approx)Number of peer
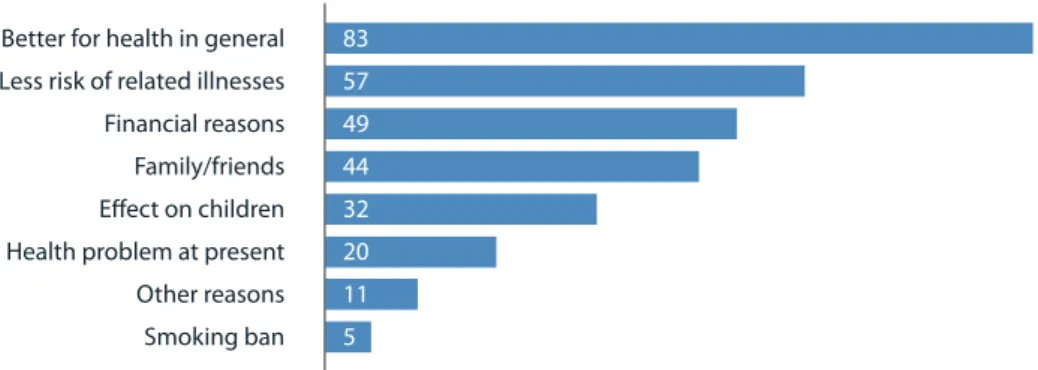
In Wales in 2010, 70 per cent of adult smokers reported that they would like to give up smoking, while 38 per cent of adult smokers had tried to give up in the last year. Figure 22 shows that the main reason reported by adult smokers for wanting to give up was better health (83 per cent), although nearly half also cited financial reasons.
Stop Smoking Wales is a national service provided by Public Health Wales. Trained advisors deliver an evidence-based six-week behavioural support programme to smokers who want to give up, usually in a group setting, across more than 200 sites in Wales. Evidence-based cessation services such as Stop Smoking Wales have been shown to be a cost-effective way of helping smokers to quit26. Current priorities for Stop Smoking Wales include preoperative and
maternity smoking cessation.
Figure 23 shows that in recent years, an annual average of around 16,000 people contact the service and are given appointments with an advisor. In 2010/11, three-quarters of these appointments were delivered in closed groups, with most of the remainder undertaken on a one-to-one basis to accommodate clients’ specific needs. Around 200 people received telephone support. Closed groups have demonstrated a higher rate of successful quitters than one-to-one appointments27.
The number of smokers going on to attend the initial assessment session fell from around 13,300 in 2006/07 to 11,100 in 2010/11. In 2006/07, when the impending ban on smoking in enclosed public places was perhaps providing smokers with additional motivation to quit, around 60 per cent of people contacting the service went on to attend at least one treatment session. In subsequent years, this figure fell to between 45 and 50 per cent.
4.2 How many smokers would like to quit, and why?
4.3 People using Stop Smoking Wales to help them quit
Figure 22Percentage of adult smokers citing specific reasons for wanting to give up smoking, 2010
Figure 23
Use of Stop Smoking Wales: i) given an appointment, ii) attended assessment, iii) attended treatment, iv) quit at four weeks (self-reported), 2005/06-2010/11
Figure 24
Quit rate after four weeks (self-reported), percentage of all smokers attending at least one treatment session, 2005/06-2010/11
Source: Stop Smoking Wales (Public Health Wales)
The drop in self-reported quit rate in 2006/07 (figure 24) coincides with the higher numbers of smokers attending assessment treatment during this period (figure 23). This may indicate that the 2007 ban on smoking in enclosed public places provided an initial motivation to quit which smokers were then unable to maintain. Since 2007/08, the quit rate has remained fairly steady at around 60 per cent. This compares to a figure of 49 per cent reported in England over the same period28, although the method of service delivery is slightly different and this may affect
the measurement of quit rates.
It should be noted that these trends may be influenced by changes in the reliability of self-reported data. Carbon monoxide (CO) testing provides a more accurate measure of the success of treatment programmes, but not all quitters attend the final treatment session in which this is carried out. Quit status is then confirmed by telephone follow-up.
The estimated proportion of smokers being given an appointment with Stop Smoking Wales increases with deprivation (figure 25a). This pattern has the potential to start to address inequalities in mortality between the most and least deprived areas (figure 31). However, continuation to treatment appears less likely in the most deprived groups. The rate of treatment is 12 per 1,000 in the most deprived males, compared to 27 per 1,000 who are given an appointment; in the least deprived males, 10 per 1,000 attend treatment compared to 19 per 1,000 given an appointment.
Although women are generally more likely to use the service than men, the proportion of female smokers attending treatment is similar in the least (14 per 1,000) and most deprived areas (16 per 1,000).
People living in more deprived areas are likely to find it harder to stop smoking than their less deprived peers29. Self-reported quit rates in Wales (figure 26a) are slightly lower in the most
deprived males than in the least deprived (58 vs 62 per cent), with the gap between females slightly larger (53 vs 59 per cent). However, there is not a great deal of variation across the five groups. The same is true using CO-validated data (figure 26b), where quit rates are only one per cent lower in the most deprived males than in the least deprived.
Figure 25
Smokers who contacted Stop Smoking Wales in 2011 and a) were given an appointment, and b) attended treatment, age-standardised rate per 1,000 estimated smokers in Wales, by deprivation fifth (Welsh Index of Multiple Deprivation 2011)
25a) given an appointment 25b) attended treatment
Source: Stop Smoking Wales (Public Health Wales) Horizontal lines ( ) show 95 per cent confidence interval
Figure 26
Quit rate after four weeks, 2011, a) self-reported and b) CO-validated, age-standardised percentage of all smokers attending at least one treatment session, by deprivation fifth (Welsh Index of Multiple Deprivation 2011)
26a) self-reported 26b) carbon monoxide – validated
Source: Stop Smoking Wales (Public Health Wales) Horizontal lines ( ) show 95 per cent confidence interval
Research has shown that pharmacotherapy can considerably increase a smoker’s chances of quitting30. The medicines used to support smoking cessation are: nicotine replacement therapy
(NRT) (available in several formulations on prescription, over-the-counter in pharmacies, and on general sale), varenicline and bupropion (both are prescription-only medicines). Varenicline was introduced into the UK in 2006. NRT, varenicline and bupropion have all been approved by National Institute for Health and Clinical Excellence as options for people trying to quit smoking. In 2007, over £5m was spent on prescriptions of these medicines via primary care, an increase of 62 per cent from 2006. This is consistent with the introduction of the ban on smoking in public places in Wales in April 2007. Overall, the expenditure on these medicines has fallen in the years since 2007 with £3.3m spent in 2011. In this four-year period of time, expenditure on varenicline increased by 41 per cent and on bupropion decreased by 75 per cent.
4.4 Use of medicines to help people stop smoking
Figure 27
Annual NHS primary care prescribing expenditure in Wales on pharmacotherapy for smoking cessation, 2006-2011
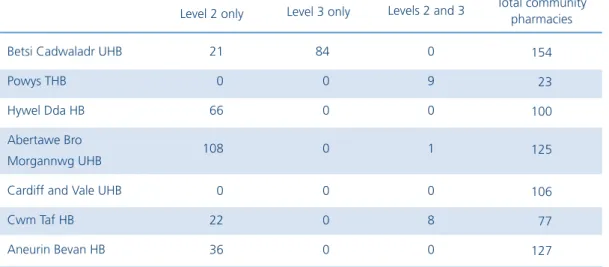
Community pharmacy NHS smoking cessation services have been developed in Wales, potentially reaching large numbers of smokers in the community who may already visit the pharmacy for other reasons. Figure 27 does not include NHS expenditure on NRT through the pharmacy-based services due to the unavailability of complete data for Wales. Health boards may commission community pharmacy enhanced smoking cessation services at two levels (box 1). NRT can be supplied directly to smoking cessation clients who access either level of service. Table 2 shows the number of community pharmacies commissioned by each health board to provide these services.
Abertawe Bro Morgannwg University Health Board, which has over 100 community pharmacies offering level 2 or 3 smoking cessation services, spent £274,466 on NRT through pharmacy smoking cessation services in financial year 2011, which was considerably more than the £156,534 spent via prescription in 2011. In other areas, prescribing accounts for most of the primary care expenditure on NRT. Hywel Dda Health Board, for example, spent £35,027 on NRT via the pharmacy services and £179,303 via prescriptions in 2011.
Level two:
t1SPWJEF/35BOEBEEJUJPOBMTVQQPSUUPDMJFOUTUBLJOHQBSUJOUIF4UPQ4NPLJOH8BMFT intensive behavioural support programme.
t&OTVSFDMJOJDBMTVJUBCJMJUZPG/35 Level three:
t"TTFTTDMJFOUPOPOFUPPOFCBTJTUIFOTUBSUTVQQMZPGBQQSPQSJBUF/35 t.POJUPSVTFPG/35BOEQSPWJEFPOHPJOHBEWJDFBOETVQQPSU
Betsi Cadwaladr UHB Powys THB
Hywel Dda HB Abertawe Bro Morgannwg UHB Cardiff and Vale UHB Cwm Taf HB Aneurin Bevan HB 21 0 66 108 0 22 36 84 0 0 0 0 0 0 0 9 0 1 0 8 0 154 23 100 125 106 77 127 Level 2 only Level 3 only Levels 2 and 3 Total community
pharmacies
Box 1
Levels of enhanced smoking cessation services provided by community pharmacies
Table 2
Number of community pharmacies providing smoking cessation services by health board, 2011
The health effects of tobacco use are well known and are examined in this section, with a focus on mortality and hospital admissions. Further information regarding the incidence of specific smoking-related cancers is provided online by the Welsh Cancer Intelligence and Surveillance Unit at www.wcisu.wales.nhs.uk.
The full impact of tobacco use on health and health services is hard to quantify in that it is so wide-reaching: fertility can be affected, as well as health in utero; nearly 200 fires in homes in Wales are known to have been caused by smoking materials in 2010/1131.Furthermore, the
estimates within this section of deaths and hospital admissions due to smoking in adults are likely to be underestimates, given that they do not take into account exposure to second-hand smoke. Lifetime non-smokers have been found to experience approximately 20 per cent higher rates of death from coronary heart disease when exposed to second-hand smoke on a daily basis32.
It has been estimated that smoking costs NHS Wales around £1 million per day, which is seven per cent of total expenditure on healthcare33.
Smoking in pregnancy increases the risk of miscarriage and complications in pregnancy and labour. The risk of infant mortality is increased by an estimated 40 per cent. More low birth weight babies are born to mothers who smoke, with greater consumption of cigarettes leading to greater reduction in birth weight. Low birth weight has also been associated with ill health in adulthood. Babies born to mothers who smoke are more likely to develop middle ear infections, respiratory infections and asthma. Exposure to second-hand smoke during pregnancy can reduce foetal growth and increase the risk of preterm birth34. Under its Institute function, Public
Health Wales is currently investigating interventions to improve maternal health through its Reproductive and Early Years Pathfinder Programme.
As well as mortality and health issues, there are also cost implications. Using estimates from a report by the Public Health Research Consortium35, smoking in pregnancy costs NHS
Wales between £352,000 and £2,816,000 per year prior to birth and a further £528,000 to £1,034,000 in the first year of life36.Stop Smoking Wales is working with midwifery departments
to strengthen referral pathways for pregnant females. It has been reported that spending between £13.60 and £37.00 on smoking cessation interventions per pregnant smoker would yield positive cost savings for the NHS35.
The patterns shown in figures 15, 16 and 17 are of particular concern as research suggests that habits established early on affect health-related outcomes in later life37.Children and young
people who smoke regularly before the age of 15 at least double their risk of lung cancer compared to those starting after the age of 2538.
There are a range of inter-related factors involved when children and young people decide to take up smoking which range from influences such as the individual, family, social, community and society. It is believed that children whose parents or siblings smoke are around 90 per cent more likely to become smokers themselves6.
5
Impact of tobacco use on health and health services
Exposure to second-hand smoke in childhood is strongly associated with a range of respiratory illnesses and serious diseases, including sudden infant death syndrome and meningitis40,41.
Given the levels of exposure shown in figures 20 and 21, this represents a major risk to the health of children. Children have little control over their environment and are often unable to remove themselves from the risk of exposure to tobacco smoke. They are also more vulnerable to the effects of second-hand smoking than adults, possibly because they have higher breathing rates40.
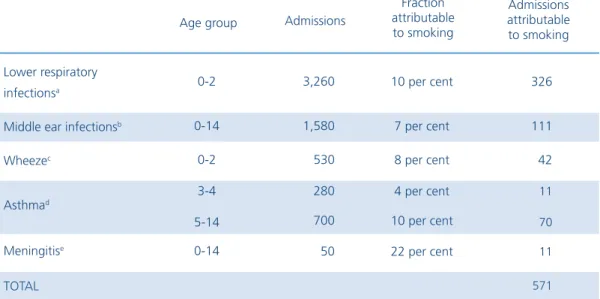
Table 3 shows that around 570 admissions in Wales residents were attributable to second-hand smoke exposure in 2010, with the majority due to lower respiratory infections. Around 10 cases of meningitis, which can seriously endanger health, could also have been caused by second-hand smoke. These figures were calculated using a method published by the Royal College of Physicians40, in which systematic reviews and meta-analysis were analysed to estimate the
fraction of hospital admissions for particular diseases that could be attributed to second-hand smoking. It should be noted that the fractions are based on a range of data which is not directly sourced from the Wales population.
5.1.1 Hospital admissions in children attributable to
second-hand smoke
Table 3
Hospital admissions in children aged 0-14 for selected childhood diseases attributable to second-hand smoke exposure, Wales residents, 2010
Lower respiratory infectionsa
Middle ear infectionsb
Wheezec Asthmad Meningitise TOTAL 0-2 0-14 0-2 3-4 5-14 0-14 3,260 1,580 530 280 700 50 10 per cent 7 per cent 8 per cent 4 per cent 10 per cent 22 per cent 326 111 42 11 70 11 571 Age group Admissions
Fraction attributable to smoking Admissions attributable to smoking
a Acute bronchitis (ICD-10 code J20), acute bronchiolitis (J21), unspecified acute lower respiratory infection (J22); b Non-suppurative (H65) and suppurative and unspecified otitis media (H66); c Code R062; d Asthma (J45) and status asthmaticus (J46);
e Meningococcal meningitis (A39.0), and bacterial meningitis (G00)
Source: Patient Episode Database for Wales (NHS Wales Informatics Service); passive smoking-attributable fractions published by Royal College of Physicians40
The association between socio-economic group and second-hand smoke exposure in the home (section 5.2) suggests that children living in more deprived areas will have a higher level of exposure than children living in less deprived areas. This could be a contributory factor in the patterns shown in figure 28, where admission rates increase with deprivation for all childhood diseases listed in table 3. These findings are similar to those reported by the Tobacco Advisory Group using data from England40.There is a particularly large difference between least and most
deprived groups for meningitis, although the numbers of admissions are comparatively low (as indicated by the wide confidence intervals) and interpretation of these rates should therefore be carried out with caution.
Figure 28
Age-specific hospital admission rates per 100,000 for selected childhood diseases attributable to second-hand smoke exposure, Wales residents by deprivation fifth (Welsh Index of Multiple Deprivation 2011), 2008-10 Lower respiratory infections (0-2 years) Middle ear infections Wheeze (0-2 years)
(0-14 years)
Source: Patient Episode Database for Wales (NHS Wales Informatics Service); mid-year population estimates (Office for National Statistics); Welsh Index of Multiple Deprivation 2011 (Welsh Government); passive smoking-attributable fractions published by Royal College of Physicians40
Horizontal lines ( ) show 95 per cent confidence interval
Smoking is the largest single cause of avoidable early death in Wales. In 2010, around 5,450 deaths in people aged 35 and over were caused by smoking, which is 17.8 per cent of all deaths in this age group. A similar proportion of deaths in England (18.1 per cent) were caused by smoking in 201042.
A higher proportion of deaths in males than in females can be attributed to smoking (23.0 vs 13.1 per cent, table 4). These figures rise to 25.5 per cent and 16.4 per cent in the most deprived areas of Wales for males and females respectively, reflecting the differences in smoking prevalence shown in figure 10.
Since smoking often leads to premature death, these differences across the genders may be a key reason why women live longer than men. Recent research suggests that smoking causes around 60 per cent of the gender gap in UK mortality rates43. Our analysis, using a more
detailed measure of smoking-attributable mortality and counting deaths at age 35 and over (rather than at all ages), gives a lower figure of 46 per cent for Wales in 2008-10.
5.2
Adults
5.2.1 Smoking-attributable mortality
Table 4
Counts and percentages of deaths attributable to smoking, age 35 and over, by cause and deprivation fifth (Welsh Index of Multiple Deprivation (WIMD) 2011), 2010
Source: Annual District Deaths Extract (Office for National Statistics); Welsh Index of Multiple Deprivation 2011 (Welsh Government); smoking-attributable fractions published by NHS Information Centre
Wales
All causes All cancers
All circulatory disease All respiratory disease All diseases of the digestive system 5 - most deprived 4 3 - middle 2 1- least deprived 14,520 4,450 4,990 1,990 760 16,030 4,160 5,310 2,330 850 3,040 3,110 3,130 2,830 2,410 3,290 3,330 3,550 3,160 2,700 23.0 36.0 18.5 39.9 4.3 13.1 21.1 9.6 29.2 3.8 25.5 24.2 22.7 22.3 19.8 16.4 13.1 12.9 11.8 11.1 3,350 1,600 920 790 30 2,100 880 510 680 30 780 750 710 630 480 540 440 460 370 300 All Attributable to smoking All Attributable to smoking
Attributable to smoking (per cent) Attributable to smoking (per cent) Number of deaths Number of deaths
Males Females
By WIMD 2011 fifth (all causes of death)
All respiratory disease 1,990 790 39.9 2,330 680 29.2
4 3,110 750 24.2 3,330 440 13.1
Figure 29 shows that just over half of all deaths caused by smoking were due to respiratory and circulatory disease, with cancers accounting for the majority of the rest. Of all deaths from lung cancer and chronic obstructive pulmonary disease (COPD), around 80 per cent were considered attributable to smoking.
Figure 29
Breakdown of deaths attributable to smoking for selected causes, age 35 and over, 2010
Source: Annual District Deaths Extract (Office for National Statistics); smoking-attributable fractions published by NHS Information Centre
The overall rate of deaths from smoking in England is lower than in Wales, although the North East and North West regions of England have considerably higher rates (figure 30). According to the General Lifestyle Survey7, the prevalence of smoking in these regions has historically been
high, with rates of 30 per cent and over being reported in both males and females over the last decade.
Figure 30
Smoking-attributable mortality, age 35 and over, age-standardised rate per 100,000, all persons, English Regions and Wales, 2007-09
Source: Wales: Annual District Deaths Extract; Mid-year population estimates (Office for National Statistics); smoking-attributable fractions published by NHS Information Centre; England: Local Tobacco Control Profiles for England (Public Health Observatories in England) Horizontal lines ( ) show 95 per cent confidence interval
Figure 31
Smoking-attributable mortality, age 35 and over, Wales and most/least deprived fifth (Welsh Index of Multiple Deprivation 2011), age-standardised rate per 100,000, 2001-03 to 2008-10
Source: Annual District Deaths Extract & mid-year population estimates (Office for National Statistics); Welsh Index of Multiple Deprivation 2011 (Welsh Government); smoking-attributable fractions published by NHS Information Centre
Males Females
In Wales, where smoking is about two and a half times more common in the most deprived compared to the least deprived areas (figure 10), there is a similar ratio in rates of death from smoking across the deprivation fifths (figure 31). This inequality is slightly larger in females (ratio of 2.6) than in males (2.2) in 2008-10. However, in both sexes, these rate ratios have increased slightly since 2001-03, suggesting a widening inequality. This is due to the mortality rate in the least deprived falling more quickly than the rate in the most deprived. Such trends demonstrate the action required if the Welsh Government’s vision from Fairer Health Outcomes For All44 is to
be realised: “Improved health and wellbeing for all, with the pace of improvement increasing in proportion to the level of disadvantage.”
Rates of death from smoking have also fallen more quickly over the period in males (21 per cent fall) than in females (13 per cent). This difference in trends may partially be explained by historical smoking patterns, with tobacco consumption beginning to fall in males earlier in the 20th century than in females (figure 1).
The pattern of mortality rates from smoking across local authority areas is largely as would be expected given the pattern of smoking prevalence shown in figure 8. The highest rates are found in the South Wales Valleys areas of Rhondda Cynon Taf, Merthyr Tydfil, and Blaenau Gwent (figure 32), where smoking prevalence is highest, and rates are lower in the more rural parts of Wales such as Powys, Ceredigion and Monmouthshire. However, rates in males living in the Isle of Anglesey and Flintshire are higher than might be expected given the prevalence of smoking. In addition, whereas the rate of deaths attributable to smoking in males living in Neath Port Talbot is average, in females the rate is considerably higher than Wales as a whole.
Source: Annual District Deaths Extract & mid-year population estimates (Office for National Statistics); smoking-attributable fractions published by NHS Information Centre
Horizontal lines ( ) show 95 per cent confidence interval Figure 32
Smoking-attributable mortality, age 35 and over, local authorities and health boards, age-standardised rate per 100,000, 2008-10
Males Females
Maps of death rates from smoking in Upper Super Output Areas (USOAs, figure 33) add further detail to the geographical pattern shown in figure 32. Rates are high in males living in the west of the Isle of Anglesey and the east of Flintshire, and females living in the southeast part of Neath Port Talbot. Local variation is also apparent, with a clear disparity in rates between north and south Cardiff for both males and females. This reflects the USOA map of smoking prevalence (figure 9). Nationally, there is more than a threefold difference between the highest and lowest USOA rates in females, a difference which is slightly smaller in males. This echoes the wider inequalities in females shown in figure 31.
Figure 33
Smoking-attributable mortality, age 35 and over, Upper Super Output Areas (USOAs), age-standardised rate per 100,000, 2008-10
Source: Annual District Deaths Extract & mid-year population estimates (Office for National Statistics); smoking-attributable fractions published by NHS Information Centre 440 to 480 (4) 380 to 440 (18) 320 to 380 (31) 260 to 320 (25) 200 to 260 (16) 215 to 251 (6) 181 to 215 (15) 147 to 181 (33) 113 to 147 (28) 79 to 113 (12)
The continuing inequality in all-cause mortality, with substantially higher rates in the most deprived populations than in the least deprived, was documented in the Public Health Wales Observatory’s recent profile entitled Measuring Inequalities: Trends in mortality and life expectancy in Wales.
Smoking has been referred to as a proximal cause of health inequalities45.This means that whilst
differences in health across socio-economic groups can be attributed to smoking, as explored in this section, differences in smoking prevalence can in turn be attributed to social determinants
5.2.2 Contribution of smoking to overall inequality
in mortality rates
© Crown Copyright and database right 2012. Ordnance Survey 100044810
USOA boundary Local authority boundary
Males Females
It should be noted that the method of estimating the rate of deaths from smoking is not exact and relies on a single set of population attributable fractions which are not changed over time. To complement these data, the web-based resource accompanying this report includes rates of death from key smoking-related causes such as lung cancer and COPD. It is recommended that these rates be used to aid interpretation of the overall rate in deaths from smoking.
It is clear that smoking is, and will continue to be, a major contributor to the gap in all-cause mortality. It is estimated that smoking-attributable mortality accounts for around a third of the all-cause mortality inequality in males and only a little less for females.
Over the past decade, the percentage of the all-cause mortality inequality that can be attributed to smoking has fallen slightly for both sexes. This is because whilst the relative mortality gap, i.e. the rate in the most deprived divided by the rate in the least deprived, has increased, the absolute mortality gap, i.e. the rate in the most deprived minus the rate in the least deprived, has decreased. There may also have been changes in the patterns of other causes of death that have contributed to the relative influence of smoking on inequality in mortality. The rate of decline appears to be greater for males than females. As a result, the difference between the sexes, in terms of the percentage of the all-cause inequality attributable to smoking, is narrowing.
Figure 34
Percentage of inequality in mortality attributable to smoking, age 35 and over, 2001-03 to 2008-10
Source: Annual District Deaths Extract & mid-year population estimates (Office for National Statistics); Welsh Index of Multiple Deprivation 2011 (Welsh Government); smoking-attributable fractions published by NHS Information Centre
It has already been shown in this report that smoking prevalence, and consequently smoking-attributable mortality, is higher in the most deprived areas of Wales than in the least deprived (figures 10 and 31). Presented in figure 34 is an estimate of the contribution of smoking-attributable mortality to the inequality in all-cause mortality. In effect, this is an estimate of the reduction in the all-cause mortality inequality that could eventually (given a suitable time lag) be achieved if smoking prevalence, and hence smoking-attributable mortality, in the most deprived populations was reduced to the same level as in the least deprived. See the technical guide online for further methodological information.
This section shows trends in premature mortality for selected causes of death which contribute heavily to smoking-attributable mortality (figure 29). Charts showing local authority and health board rates for these causes of death can be found in the online interactive spreadsheets accompanying this report.
As the following charts show, mortality rates in Wales are generally falling and are either similar to or slightly higher than overall rates for the UK. Inequalities between the least and most deprived areas of Wales are generally slightly larger in females than in males, but in both sexes are remaining consistent or growing.
However, rates of respiratory disease mortality in the most deprived males have risen since 2001-03. This may not be linked to diseases attributable to smoking, since the corresponding mortality rate for chronic obstructive pulmonary disease (COPD, which causes the majority of smoking-related deaths due to smoking in males) has remained fairly steady over the period. Lung cancer mortality rates in females are also noteworthy, in that overall rates in Wales and the UK have remained largely unchanged since 2001-03. Rates in the most deprived females have risen from 36 to 42 per 100,000 over the period, whilst for males these figures have remained stable or fallen slightly. This is likely to be a reflection of the historic differences in smoking prevalence between males and females46. Tobacco consumption peaked later in the
20th century in females than in males (figure 1), and given the time lag between changes in prevalence and mortality, this may explain the fact that lung cancer mortality rates have not yet started to fall in females.
The inequality in premature mortality is noticeably larger for COPD than any other cause of death, with rate ratios rising to 5.4 in males and 6.0 in females by the end of the period. Around 80 per cent of deaths from COPD are due to smoking, so this large inequality reflects the difference in smoking prevalence across socio-economic groups shown in figure 10.
Figure 35
Mortality from key causes of death, age under 75, UK, Wales and most/least deprived fifth
(Welsh Index of Multiple Deprivation 2011), age-standardised rate per 100,000, 2001-03 to 2008-10 Lung cancer
Respiratory disease Circulatory disease
Chronic obstructive pulmonary disease
Males Males Males Males Females Females Females Females