NPAL Acoustic Noise Field Coherence and
Broadband Full Field Processing
Arthur B .Baggeroer
Ctr for Ocean Engineering, Dept. of Mechanical Eng Massachusetts Institute of Technology
Cambridge, MA 02139
Phone: 617 253 4336 Fax: 617 253 2350 email: abb@boreas.mit.edu
and
Edward K. Scheer
Dept of Applied Ocean Physics and Eng Woods Hole Oceanographic Institution
Woods Hole, MA 02543
Phone : 508 289 2823 Fax : 508 457 2194 email : escheer@whoi.edu Award Number : N000140410124
http://acoustics.mit.edu
LONG TERM GOALS
The title of this project reflects works completed under the NPAL program where long range signals were received by the NPAL billboard array off the coast of California. This effort transitioned to the BASSEX (Basin Acoustic Seabed Scattering Experiment) which was conducted jointly with Scripps Inst. of Oceanography and the Univ. of Washington as part of the SPICEX/ LOAPEX/BASSEX experiments.
The long term goals of the BASSEX experiment are to study the forward scattering around a large seamount complex, the Kermit Roosevelt Seamounts in the northeast Pacific, using the acoustic sources from SPICEX and LOAPEX and the ONR FORA (Five Octave Research Array). At the 75 and 250 Hz center frequencies of the signals transmitted this array has an aperture of 9.6 and 32 wavelengths respectively.
Both forward and backscattering for a seamount have been studied by several investigators theoretically and experimentally including models usually with SUS, or explosive sources or
piezoelectric ones for the models. [1,2,3,4,5,6] BASSEX was unique since it uses modulated signals as well as an array which permitted pulse compression for high resolution of arrival times and a array for the multipath. In addition, the array has the ability to resolve the direction of arrival which is roughly 2 degrees at broadside and 15 at endfire.
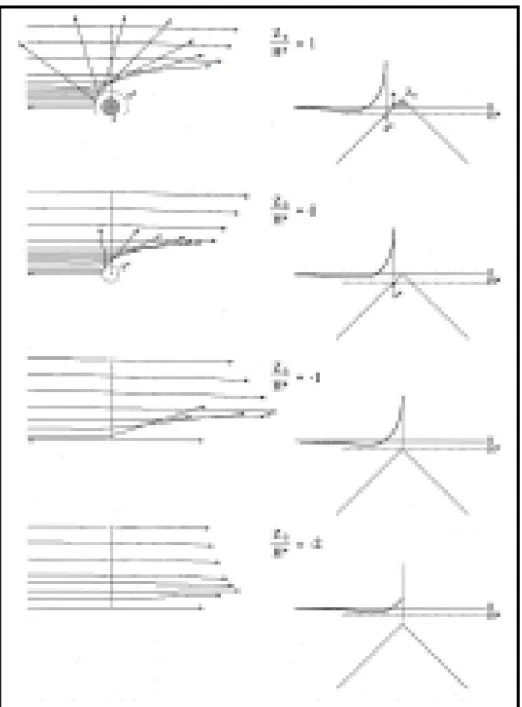
Scattering from a seamount involves full 3D modeling in comparison to the 2D ones for propagating across a ridge such as so well illustrated by Kuperman and Jensen. [7] While these are appropriate results for an ocean ridge of continental margin, they do not incorporate all the propagation physics for a seamount. More generally, many of the current areas of interest to the operational Navy concerns regions of seamounts and bathymetry of margins which require 3D modeling. The seamount is the simplest example for a start. Figure 2 from reference [8] provides an excellent representation of the interaction by combining rays with the horizontal refraction specified by the associated modes. At the
top of this figure wavefronts hitting the seamount leads to some energy to be backscattered and others parts to be refracted away from it. As the depths of the waves move toward the apex the energy is mostly refracted away from the seamount.
Finally, waves above the seamount pass over it with just a small amount of refraction. This is the result the evanescent component of the associated mode contacting the apex. Also note that there is a small amount of energy drawn toward the seamounts for sections of the wavefront distant from the
seamount. OBJECTIVES
Our long range objectives focus on generating acoustic models appropriate for array signal processing. We long ago postulated a chain of uncertainty for the formulation of algorithms needed for this
processing. Here we argue the following: environmental uncertainty leads to acoustic uncertainty then to signal processing uncertainty and finally to command uncertainty based on the output of the
displays. [9] We note that BASSEX examined the propagation several convergence zones beyond the seamounts as well as coherent pulses instead of explosives. The long range recordings demonstrated how convergence zones reestablish and one can receive signals in back of the seamount while the coherent signals permit precise measures of travel time. Unfortunately, the FORA array could not be towed below 300 m, so we could not study the ray path structure at depth.
APPROACH
The approach to understanding this cascade of uncertainty is to characterize the environment as well as possible including both the oceanography and bathymetry. This is done using a combination of
archival and in situ data. We then need to separate the scales into deterministic and variable components. We need acoustical codes which can model the deterministic components and ones which add the stochastic component to represent the variability. This is a classic approach and is the focus of many investigators in ocean acoustics.
The scattering, or propagation, associated with a seamount, in this case two closely spaced ones, is one of the simplest 3D problems to study in this context. We measured the oceanographic environment with an extensive collection of XBT’s and the bathymetry was measured with a high resolution multibeam system. Nevertheless, there is variability in the propagation to the seamount, the bottom geoacoustics as well as the array position and orientation. Our focus to date has been on the
deterministic component of the modeling.
The computational aspects for the array processing can be well implemented with high powered PC’s. For this we have used state of the art adaptive processors which have higher resolution than ones used conventionally. The 3D modeling, however, requires a level of computational capability usually associated with supercomputers. For this, we have obtained access to the a 900 cluster of duo
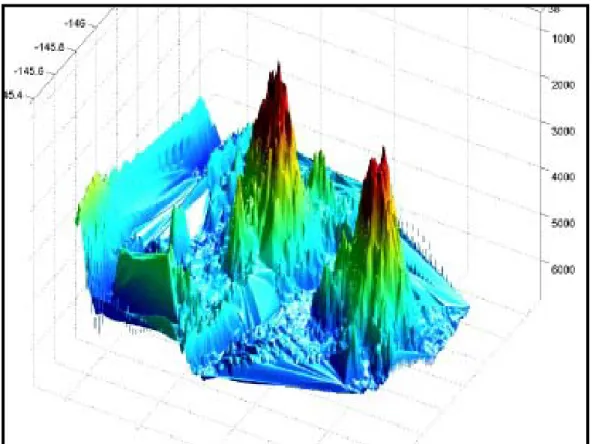
processors, the LL Grid, constructed and maintained at the MIT Lincoln Laboratory. [10] We are just on the verge of implementing the 3D codes for the seamount including the precise bathymetry
illustrated measured and illustrated in Figure 1 in contrast to the conical models now used in most analyses.
WORK COMPLETED
We have completed pulse compression and beamforming of all the data. Unfortunately, the FORA system had a software error in swapping the buffers, so data more than three minutes into the start of record have “glitches,” or spikes where some data were dropped. Consequently, we have not focused on the long duration signals of the LOAPEX transmissions.
RESULTS
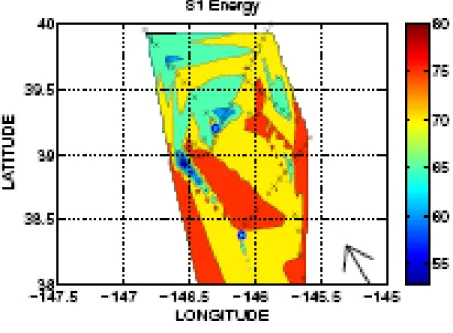
Figure 3 illustrates the energy received behind each of the seamounts. We can note that there is a well defined shadowing followed by the energy levels being reestablished in what appears to be part of a convergence zone pattern.
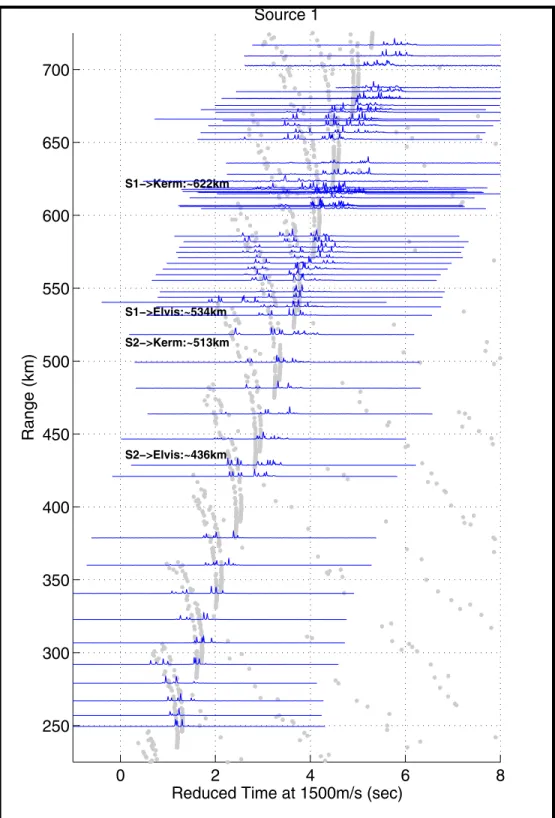
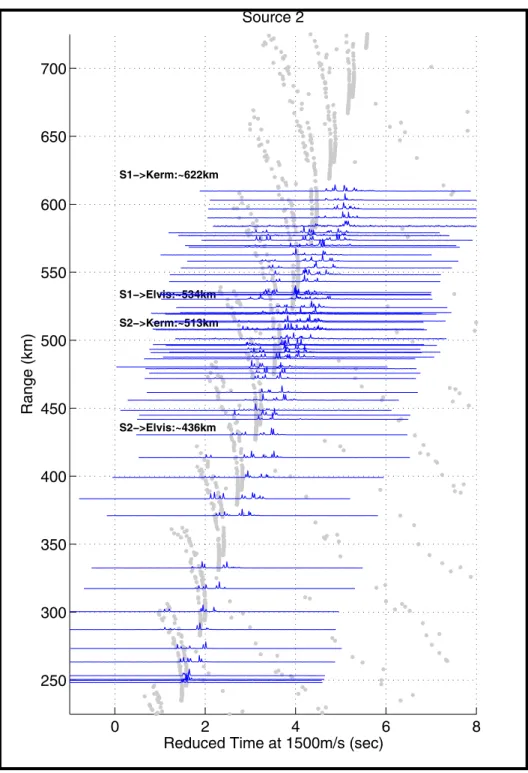
Figure 4a and 4b illustrate comparisons between the theoretical arrival of the signals from the SPICEX source 1 and 2 respectively and a ray trace code. We can observe there is excellent agreement for the travel times prior to interacting. The times when the signal should start to interact with both Kermit and Elvis are annotated on the chart. We begin to see the scattering at these times. Some of the issues associated with the scattering include the following: In terms of a ray path formulation the rays which cycle in the water column preferentially hit the seamount which has a high slope (5 kilometer rise within roughly 10 kilometers, or approximately 30 degrees) and are stripped or converted to higher order ones by the 2*slope angle change associated with propagation up a slope. Some of the energy is deflected by horizontal refraction so it would not align in time with the 2D PE calculation. The seamount is hardly a perfect cone, so there is certainly a lot of out of plane scattering.
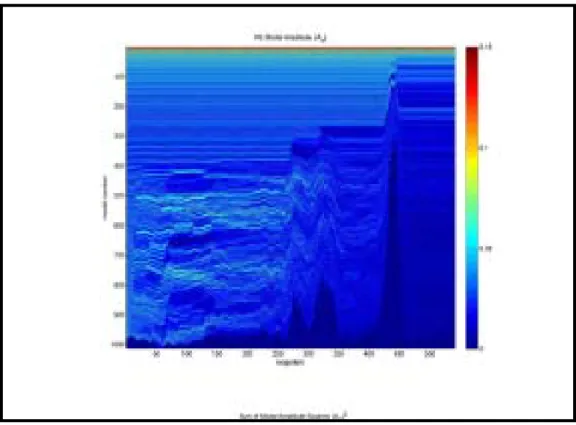
Figure 5 presents projecting the local modes onto a PE solution at the carrier frequency for a path impinging directly on the apex of the Kermit seamount. In this figure range is on the horizontal axis and mode number is on the vertical one and mode intensity is indicated by the color. The very low order modes are at the top and have high across range. This is because the apex of the seamount is below the sound channel axis at 750 meters so there is no interaction. At approximately mode 30 there is interaction with the seamount. The higher order modes are “squeezed” somewhat going over the seamount and the energy behind it is attenuated. The higher order modes beyond 30 are all bottom interacting and have significant loss behind the seamount. There is also an indication of interaction with two seamounts with less elevation before hitting Kermit. Note also the oscillating pattern indicating the excitation level at the source. (This figure needs a better
color rendition.)
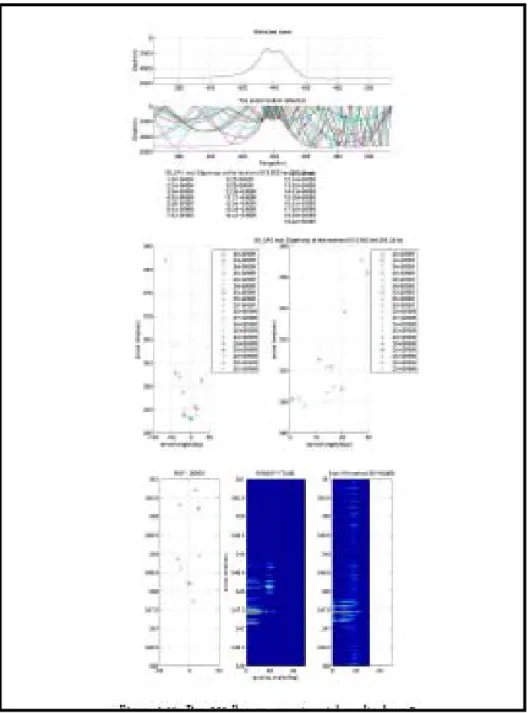
Figure 6 illustrates a typical analysis for comparison of theoretical and experimental data. At the top is a ray path picture for the range between source and receiver. (One can note that the remnants of the volcanic cone by the indentation at its apex in this cross section. The rays are all those which arrive within +/- 100 meters of the receiving array location. The next are the raypath ID’s in the usual notation for ocean acoustic tomography for these rays. The next down is a comparison of theoretical by PE and experimental results of the arrivals in time vertically and angle horizontally for the arrivals with the peak picks highlighted. There is a fairly complicated set of Euler rotations to correct for the ships course relative to the source/receiver direction as well as the drift and tilt of the array. While faint we do obtain reasonably good agreement. (We have been able to improve on the array resolution significantly recently by optimizing the adaptive beamformer algorithm as well as the array aperture.) The last figure is a bolder rendition of this in color to highlight the agreement. In line with our overall
goals is to identify the arrival energy pattern in back of the seamount in terms of both angle and distance to explain Figure 3.
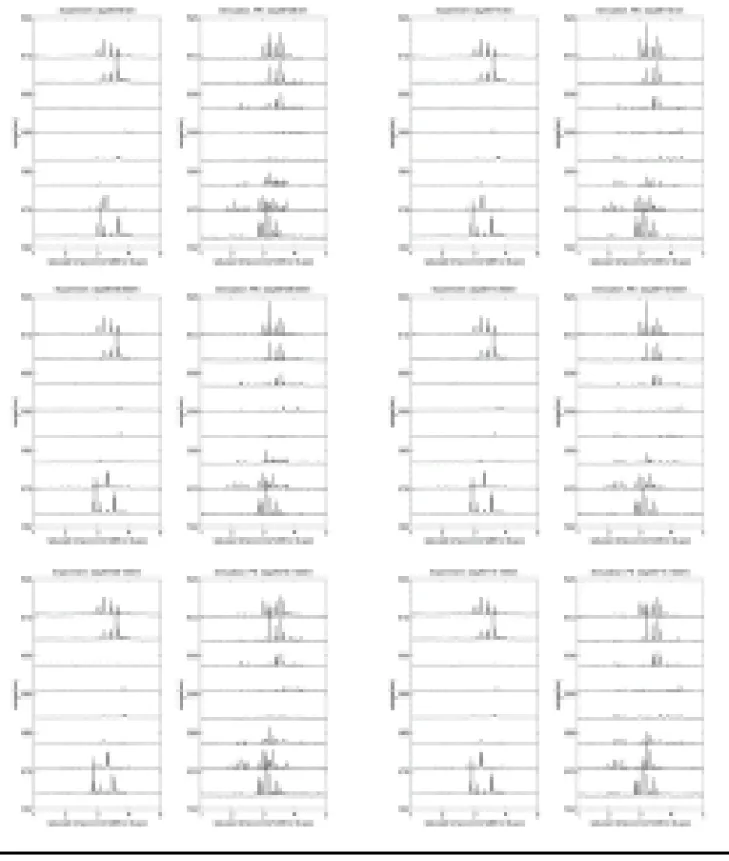
Figure 7 illustrates several transmissions where we compare theoretical and experimental arrivals. Again for each even the horizontal axis is angle of arrival after the Euler angle corrections and the vertical is travel time. Overall time of arrival agreement is very good, but as is common in ocean acoustic tomography results the amplitudes do not compare as favorably.
IMPACT
The impact of this is the first quantitative analysis where paths are identified using coherent signals for propagation behind a seamount. This is relevant to transmission loss calculations where a target or receiver may be behind a seamount. We found that at the depths of the array and the height of this particular seamount that significant energy reforms into convergence zone like propagation behind the seamount. We also identified the extent of angular width of the shadowing by the seamount. This is also relevant to TL calculations for the Comprehensive Nuclear Test Ban Treaty where connectivity between the sparse receiving array network and the possibility of clandestine testing of a very low yield event behind a seamount.
TRANSITIONS
None under this program. RELATED PROJECTS
The PI is involved with a number of ONR projects: These include the SPICEX, LOAPEX and BASSEX Long Range Propagation Experiment (OA), the Shallow Water
Acoustic Propagation (SWAP & formerly the Acoustic Observatory program) (SP), the PLUSNeT project (PM: Dr. T. Paulscuwicz. He also chaired the Naval Studies Board panel on Distributed Remote Surveillance (just briefed to the ASW Cross Functional Board and soon to the CNO Executive Board), the Submarine Superiority Technical Advisory Group SSTAG, plus in an advisory role for several special access and intelligence programs
REFERENCES
[1] Bradley, D. M., PhD Thesis, Catholic University, 1970 and personal communication
[2] Northrop, J., “Underwater sound propagation across the Hawaiian Arch,” J. of the Acoustical Soc. Of America,, vol. 48(1): 417 – 418, [1970]
[3] Chapman, N.R. and Ebbeson, G.R., Acoustic shadowing by an isolated seamount,” J. of the Acoustical Soc. Of America, vol. 73(6): 1979 – 1984. [1983]
[4] Evans, R.B., “Stepwisecouples mode scattering by a cylindrical symmetric seamount,” J. of the Acoustical Soc.of America, vol. 119(1): 161 – 167, [2006]
[5] Medwin, H. and Spaulding, R., “The seamounts as a diffracting body,” in Bottom-Interacting Ocean Acoustics, edited by W.A.Kuperman and F.B. Jensen, Plenum Press, [1980]
[6] Taroukadis, M.I., “A coupled mode formulation for the solution in the presence of a conical seamount,” Journal of Computational Acoustics, vol. 4:101-121, [1996]
[7] Jensen, F.B., Kuperman, W.A., Porter, M. and Schmidt, H., Computational Ocean Acoustics, American Institute of Physics Series on Modern Acoustics and Signal Processing, New York, [1994] [8] Munk, W. H., Worcester, P.F. and Wunsch, C.I., Ocean Acoustic Tomography, Cambridge University Press, [1995]
[9] Baggeroer, A.B., “The cascade of uncertainty,” in the Ocean Studies Board Panel report on The Use of Environmental Data for Navy Systems, National Academy Press, [2001]
[10] Bliss, H.T., Bond, R. Kepner, J., Kim, H. and Reuther, A., “Interactive Grid Computing at Lincoln Laboratory, MIT Lincoln Laboratory Journal, vol 16(1), [2005]
[11] Sikora, J. J., Doctoral Thesis Proposal, Dept. of Electrical Engineering and Computer Science, Massachusetts Institute of Technology, Cambridge, MA , [November, 2007]
[12] Scheer, E.J, personal communication, Woods Hole Oceanographic Institution, Woods Hole, MA, [Decemeber 2006]
[13] Kim, H.J., Doctoral Thesis Proposal, Dept. of Mechanical Engineering, Massachusetts Institute of Technology, Cambridge, MA [November 2007]
HONORS/AWARDS
Purdue University Electrical Engineering and Computers (ECE) Outstanding Alumnus, 2006 (This award has been presented to approximately 250 alumni/ae of ECE out of 25,000 graduates of the department.
Fig. 1: The Kermit Roosevelt Seamount complex in the northwest Pacific. The northern seamount was named “Kermit” while the southern one was nicknamed “Elvis” for ease of distinguishing the two. The multibeam measured Kermit to shoal to
Fig 2: Features of forward and backscattering from a seamount. The seamount is represented as a cone and the figure illustrates rays hitting it at depth at the top to passing over it at the bottom. The left is a view from the top and the right from the side. The bending is due to the phase speed change due to the shoaling of the seamount. The
tendency is to repel the wave away from the seamount except for a small region with a slight attraction. At depth (top) the bending is strong while at above the seamount the wave essentially passes over it. Note there is an imlicit adiabatic assumption here which is probably violated because of the high slope of roughly 30 degrees. Taken from Ref. 8
Fig 2: Shadow pattern from SPICEX sources 1 and 2 for the Kermit and Elvis Seamounts. Note the immediate shadowing immediately in back of the seamounts and then the increase in energy which reestablishes a convergence zone arrival pattern. [11]
0 2 4 6 8 250 300 350 400 450 500 550 600 650 700 S1−>Kerm:~622km S1−>Elvis:~534km S2−>Kerm:~513km S2−>Elvis:~436km Source 1
Reduced Time at 1500m/s (sec)
Range (km)
Fig 4a: Reduced travel time comparison between measured pulsed compressed signals and a ray path model from the SPICEX 1 sourece . (These figures have been adjusted
by +/- .3 sec because of synchronization problems with the FORA data acquisition system.) Note the ranges where one expects to see scattering from each of the
0 2 4 6 8 250 300 350 400 450 500 550 600 650 700 S1−>Kerm:~622km S1−>Elvis:~534km S2−>Kerm:~513km S2−>Elvis:~436km Source 2
Reduced Time at 1500m/s (sec)
Range (km)
Fig 4b: Reduced travel time comparison of experimental and theoretical from a ray trace code for arrivals for SPICEX source 2. Again there is a time alignment because of the FOR A data acquisition system. The times when there should be scattering from
Fig. 5: Amplitudes of the modes from source to Kermit. The range is on the horizontal axis and the mode amplitude on a raster on the vertical starting with the low modes on
the top. The following can be observed: i) the low order modes at the top have very high amplitude since the source is at the SOFAR axis; ii) the amplitude of modes 1- 5
are unaffected by the seamount since they pass over the apex at 900 m while the axis was at 700 m; iii) the amplitude of modes 1 -30 oscillate because of the excitation at the fluctuating mode shape; iv) modes 1 – 30 also pass over the seamount but are coupled to it because their vertical extent impacts the seamount; v) there is significant transfer of energy for modes 50 and higher because of bottom interaction as can be observed by the
striation like pattern before the seamount; v) the seamount redistributes the modal energy except 1-5 at more distant ranges with the high order modes indicating a significant loss of energy. Note that this is for a ray striking the seamount “dead on;” the pattern would be altered if the ray grazed the side both in term depths and horizontal
Fig. 6: An example of the detailed analysis of a transmission. The top indicates the seamount cross section and the ray paths connecting source and receiver. The columns
below are the OAT identification numbers. The faint figure is comparison of the peak picks between the theoretical and experimental as derived from the color figure below.
The color figure is a comparison of the experimental data and theoretical ones which yielded the peak picks above as a function of travel time and angle of arrival on the
Fig. 7: A comparison of experimental and broadband PE results for several transmissions during BASSEX. The overall conclusion is that we can usually get the distribution of energy approximately correct and time aligned, but as common in ocean