CONTENT ASSESSMENT OF THE PRIMARY BIODIVERSITY DATA
PUBLISHED THROUGH GBIF NETWORK: STATUS, CHALLENGES AND
POTENTIALS
S
AMYG
AIJI (1)*,
V
ISHWASC
HAVAN (1),
A
RTUROH.
A
RIÑO (2),
J
AVIERO
TEGUI (2),
D
ONALDH
OBERN (1),
R
AJESHS
OOD (1),E
STRELLAR
OBLES (2)(1)
Global Biodiversity Information Facility Secretariat, Universitetsparken 15, DK-2100,
Copenhagen, Denmark
(2)
University of Navarra, Pamplona, Spain
*Corresponding author, Email: [email protected]
Abstract —With the establishment of the Global Biodiversity Information Facility (GBIF) in 2001 as an inter-governmental coordinating body, concerted efforts have been made during the past decade to establish a global research infrastructure to facilitate the publishing, discovery, and access to primary biodiversity data. The participants in GBIF have enabled the access to over 377million records of such data as of August 2012. This is a remarkable achievement involving efforts at national, regional and global levels in multiple areas such as data digitization, standardization and exchange protocols. However concerns about the quality and ‘fitness for use’ of the data mobilized in particular for the scientific communities have grown over the years and must now be carefully considered in future developments. This paper is the first comprehensive assessment of the content mobilised so far through GBIF, as well as a reflexion on possible strategies to improve its ‘fitness for use’. The methodology builds on complementary approaches adopted by the GBIF Secretariat and the University of Navarra for the development of comprehensive content assessment methodologies. The outcome of this collaborative research demonstrates the immense value of the GBIF mobilized data and its potential for the scientific communities. Recommendations are provided to the GBIF community to improve the quality of the data published as well as priorities for future data mobilization. Keywords— Primary Biodiversity Data, Content Assessment, and Gap Analysis.
INTRODUCTION
Free and open access to primary biodiversity data is essential both to enable effective decision-making and to empower those concerned with the conservation of biodiversity and the natural world (Bisby, 2000; Gaikwad and Chavan, 2005; GBIF, 2008). However, the history of publishing of primary biodiversity data is very recent. With the establishment of the Global Biodiversity Information Facility (GBIF) in 2001, concerted efforts to publish primary biodiversity data using community driven and agreed standards and tools gained momentum. GBIF was created to facilitate free and open access to biodiversity data worldwide, via the Internet, to underpin scientific
research, conservation and sustainable development. The GBIF network, through its data portal (http://data.gbif.org), already facilitates access to over 377 million records from more than 400 data publishers1. The progress achieved in GBIF’s first decade indicates that the development of a global informatics infrastructure, facilitating free and open access to biodiversity data, is indeed a realistic aspiration. One of the key future challenges for GBIF is now to ensure that such volume of knowledge about biodiversity on earth is indeed of high relevance for the scientific communities.
1
Why assess the content of GBIF-mobilised data?
Despite GBIF’s achievements, questions are frequently raised about whether it can yet be considered a global facility (Yesson et al., 2007), and about the usefulness of the data mobilised. GBIF has been criticised for the taxonomic, thematic, geospatial as well as temporal biases in the data mobilised by its network of data publishers (Johnson, 2007). There have been isolated studies to assess gaps, quality and fitness for use of GBIF-mobilised data (e.g. Guralnick et al., 2007; Collen et al., 2008; GBIF, 2010a). In 2010, an initial overview of the data published through the GBIF network (GBIF, 2010b) provided a first set of indicators on the content mobilized so far as well as major bias such as in the taxonomy and temporal areas. Recognising this, the GBIF-constituted Content Needs Assessment Task Group (CNATG) recommended that assessment of GBIF-mobilised content at various levels (global, regional, national and thematic) is crucial for determining the demand-driven approach for data mobilisation (Faith et. al., 2013, 2013). In 2011, in response to these recommendations, a series of improvements to the GBIF infrastructure were made such as the rework of the GBIF ‘backbone taxonomy’ with up-to-date checklists and taxonomic catalogues such as the Catalogue of Life 20112. Other improvements such as the automated interpretation of the coordinates, country location and scientific names used in published records have been improved to screen out inaccuracies – for example, ensuring that records identified as coming from a particular country are shown as occurring within the borders and territorial waters of that country. The current study attempts to assess the gaps and fitness for use of the GBIF-mobilised data. It aims to provide a comprehensive overview of the ‘state of the
2
Ruggiero M., Gordon D., Bailly N., Kirk P., Nicolson D. (2009). The Catalogue of Life Taxonomic Classification, Edition 2, Part A. In: Species 2000 & ITIS Catalogue of Life, 3rd February 2012 (Bisby F.A., Roskov Y.R., Culham A., Orrell T.M., Nicolson D., Paglinawan L.E., Bailly N., Appeltans W., Kirk P.M., Bourgoin T., Baillargeon G., Ouvrard D., eds). DVD; Species 2000: Reading, UK.
network’ for data published through the GBIF network in 2012. Such assessment is aimed at demonstrating the value of the content mobilised and how it can contribute to our improved understanding of biodiversity in particular by the scientific community.
To achieve this objective and taking into account the large volume of information to be analysed, the authors of this study have adopted two complementary methodologies. One approach led by the GBIF Secretariat (GBIFS) focused on two temporal complete studies (December 2010 and February 2012) while the Department of Zoology and Ecology at the University of Navarra (UNZYEC) focused on processing random samples of the full content. The research outputs of these two studies were compared and complemented each other.
The outcomes of these two complementary exercises are presented in three categories: (a) data quality assessment, (b) trends/patterns assessment, and (c) fitness-for-use assessment.
Data flow of the GBIF network
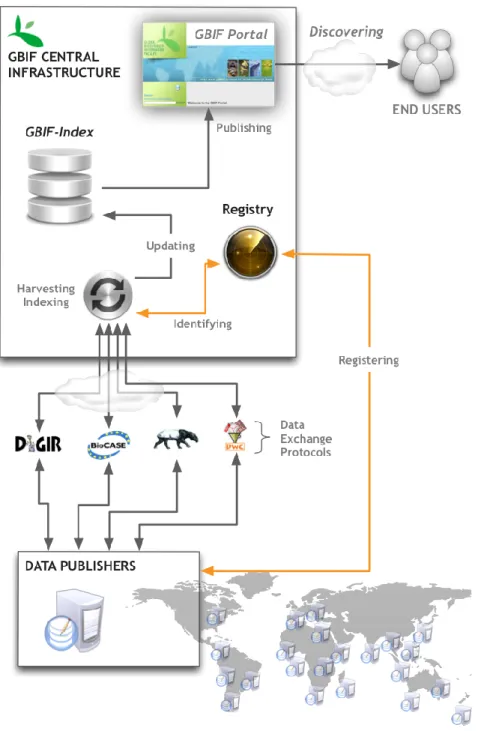
As of August 2012, the GBIF network is comprised of 419 data publishers from 44 countries and 15 international organisations. Together they publish through GBIF 10,028 occurrence based data resources (or datasets).
Figure 1 depicts the typical flow of the data publishing processes through the GBIF network. Data publishers can use a variety of tools and protocols (e.g. DiGIR3, BioCASE4, Tapir5, GBIF Integrated Publishing Toolkit6) and data standards (e.g. DwC7 and ABCD8) in order to publish primary occurrence records to GBIF. After successful registration of their resources through the central registry, GBIF centrally indexes a limited but essential number of core data elements 3 http://www.digir.net/ 4 http://www.biocase.org/ 5 http://wiki.tdwg.org/TAPIR/ 6 http://www.gbif.org/orc/?doc_id=2935 7 http://rs.tdwg.org/dwc/index.htm 8 http://www.tdwg.org/standards/115/
detailing the ‘what’ (species), ‘when’ (date/time), ‘where’ (location), “with what evidence” (basis of record) and ‘by whom’ (collector/observer) of the primary biodiversity data published by the GBIF network (also called GBIF-mediated data). The list of core data elements (Table 1) follows a common data standard: the Darwin Core standard9. This data standard has been used for the discovery of the vast majority of specimen occurrence and observational records published through the GBIF network. The Darwin Core standard was originally conceived to facilitate the discovery, retrieval, and integration of information about modern biological specimens, their spatio-temporal occurrence, and their supporting evidence housed in collections (physical or digital). These elements are compiled into a central database (also called GBIF Index) and their discovery and access is enabled through the GBIF data portal (http://data.gbif.org) as well
as through web services
(http://data.gbif.org/tutorial/services). Such a global discovery system is aimed at promoting access to the original information sources owned by each single publisher participating in the GBIF network, where more information can be found (e.g. media, richer data etc.).
While all data publishers are expected to follow common standards (e.g. DwC), their data resources discoverable through the GBIF infrastructure have varying precision and quality. This could be explained by incomplete information at the publisher level, errors during the publishing processes (e.g. formatting of date information) as well as errors during the central GBIF harvesting and indexing procedures.
In order to assess the content mobilised through the GBIF network, this study will focus on using the content of the GBIF Index as a proxy to the information published by the contributing publishers.
9 http://rs.tdwg.org/dwc/index.htm
CONTENT ASSESSMENT OF GBIF-MOBILISED
DATA
Methodology
In the last two decades, the informatics field has evolved to a stage where the handling of very large volume of data is becoming the central component of data discovery10. The capacity to store, manage and analyse a large volume of data is becoming a fundamental requirements in the field of Biodiversity Informatics and in particular for infrastructures like GBIF11. Today, technologies like Hadoop12 and Hive13 offer the ability to process such huge volumes of information on certain kinds of distributable problems using a large number of computers.
The assessment carried out by GBIFS used this new technology to process and analyse the full GBIF Index is depicted in Figure 2. The full GBIF Index was extracted in the form of Hive tables in December 2010 and February 2012. All outputs of the data-mining processes were stored in MySQL tables for easy processing and visualisation. The results of these analyses were kept so that in the future similar experiments could be repeated and compared temporally.
The Hadoop/Hive technology allowed the processing and analysis of the full GBIF Index in a reasonable amount of time compared to conventional technologies like relational database using known database management systems like MySQL. However such methodology requires a dedicated infrastructure with sufficient IT expertise and understanding of the processes involved in manipulating such large volume of information at once.
UNZYEC used two separate approaches in their assessment (Figure 3). In one, a random sample of the GBIF Index was obtained by issuing
10Jiawei Han and Jing Gao, “Research Challenges for Data Mining in
Science and Engineering", in H. Kargupta, et al., (eds.), Next Generation of Data Mining, Chapman & Hall/CRC, 2009, pp. 3-28.
11
http://www.gbif.org/communications/news-and-events/showsingle/article/important-quality-boost-for-gbif-data-portal/
12
http://hadoop.apache.org/
an automated set of queries through the portal’s web services14. This approach mimics an ecological sampling where a vast amount of data is represented by a subset, thus greatly reducing the data processing requirements. In another approach, mirrors of both the GBIF Index and the raw data harvested from the participants were queried using standard SQL statements and scripts. Although much more taxing in terms of resources, this approach enabled the authors to finely track the flow of information (not just data) from the publishers to the index. In this way, gaps caused by the data processing flow can be detected.
The UNZYEC team made queries and samplings during a three-year period, over ten versions of the GBIF Index. However, for the purpose of this assessment, analyses were made mostly on the November, 2010-released mirror, in order to provide an independent comparison of GBIFS-obtained results.
Limitations of the methodologies
The methodology used in this article enables the fast data mining of the GBIF data index but does not address issues such as:
-The level of accuracy of the data (e.g. precision in geospatial coordinates).
-The risk of misidentification of taxa.
-Duplicate records that can arise from:
i. Datasets being unwittingly published repeatedly,
ii. Duplicate records within and between datasets,
iii. Multiple digital records derived from the same physical specimen, such as a specimen being physically split and stored in multiple museums.
- Computing interpretation errors in the data harvesting and indexing routines.
14 http://data.gbif.org/tutorial/services
For example, depending on the data schema used (Darwin Core or ABCD) and their versions, an occurrence date may be represented as a date-time stamp, an ISO-formatted date, a simple text string in varying formats, or composed of individual fields (day, month, year). The mapping of the data by the publisher may therefore introduce additional error or ambiguity, if for example month and day are swapped. In order to overcome this difficulty, we assumed the level of error of the year within a malformed date-time stamp as sufficiently low to be considered as a good proxy to assess the temporal dimension.
With regards to the conversion and validation of taxonomical information (e.g. genus, species, scientific names) the challenges are more complex. During the harvesting and indexing procedures, the taxonomical information is checked against the most up-to-date GBIF taxonomical backbone. Until end 2011, GBIF used the Catalogue of life (CoL) 2007 as its core taxonomical backbone and when unmatched names were identified during the harvesting/indexing procedures they were simply added to the backbone. In November 2011, GBIF has entirely refreshed its taxonomical backbone and uses now primarily the latest version of the Catalogue of life in addition to other resources (Table 2). Today, unmatched names are not added to the core backbone and whenever possible, expert taxonomists are consulted. Therefore the study undertaken in terms of taxonomical comparison (in 2010 and 2012) should be undertaken taking into account this particular bias due to the improvement of the GBIF taxonomical backbone and resolution services.
Material
For the purpose of this study, elements covering three dimensions (“what”, “where” and “when”) were extracted from the GBIF Index by GBIFS and UNZYEC in December 2010, and also from raw data as supplied by the providers by UNZYEC for some specific analysis. Further analyses using the February version of the GBIF Index were undertaken by GBIFS.
The elements covered in these analyses are:
Source of the data: The assessment has taken into account the identifiers of the data publisher and data resources. However, due to incompleteness and lack of accuracy of entries in the institution ID, collection ID and catalogue fields in the GBIF Index, we have decided to exclude these fields from the analysis.
Taxonomic data: Taxonomic ranks such as Kingdom, Phylum, Class, Family, Genus and Species are included. The assessments have also taken into account the synonyms as recorded in the GBIF Index, in order to provide the most accurate estimate of the number of species. Data from multiple synonyms get merged during the harvesting and indexing routines.
Geospatial data: Latitude and longitude information was used when available. However, due to scarce information provided by data publishers, it was not possible to consider precision. This is a serious limitation that will need to be addressed in future analysis.
Temporal data: Limited to the field year of observation/collection. The assessments ignored the day and month recorded in the date field, except for analysing possible causes of year mis-assignment.
Other data: The basis of records, a descriptive term indicating whether the record represents an object or observation, was included in the analysis. The basis of record actually contains useful information such as the level of evidence and other categories that may be considered enhanced subclasses of information.
Results of the content assessment of the GBIF-mobilised data
We present the salient outcomes of these two independent exercises in four categories, namely: (a) data quality, (b) trends/patterns and (c) fitness-for-use assessments. In most cases, both exercises reached similar conclusions and therefore validate each other. In some instances, significant differences arose and were assessed.
A. Data Quality Assessment: Taxonomy:
Until November 2011, the processing of taxonomical references was made against some taxonomical references such as the checklist of
Catalogue of Life 2007
(
http://www.catalogueoflife.org/annual-checklist/2007/) or the International Plant Names
Index (http://www.ipni.org). During the discovery of unmatched taxonomical references against the accumulated GBIF taxonomical backbone, these are automatically added. Therefore, the 2010 GBIF taxonomical backbone contained accepted names (e.g. from CoL 2007) and new names discovered during the indexing process. This also means that in our December 2010 assessment, we had limited capacity to distinguish between authoritative names (e.g. referring to Catalogue of Life 2007 version) and added names, which had no validation against any taxonomical reference. In November 2011, the GBIF taxonomical backbone was rebuilt using primarily the latest version of the Catalogue of Life as well as many new taxonomical authoritative references (Table 2). Therefore the February 2012 assessment on taxonomical names can be considered as much more accurate.
Matching against the Catalogue of Life
Using a less advanced interpretation techniques developed in 2006 by the GBIFS, the backbone taxonomy that covers the occurrence records has 1,946,429 concepts at species or lower ranks, of which 458,716 (24%) is provided by the Catalogue of Life 2007 Annual Checklist15. A more recent study made in December 201016 showed that 52 per cent of the distinct canonical names found in the GBIF Index matched to a name in the CoL 2010 using straight, case insensitive matches. This can be slightly increased to 54% if a ‘fuzzy’ matching with a maximum difference of 10% in characters is used. In February 2012, a
15 GBIFS personal communication (March 2011) 16
similar study (Table 3) showed than 53.47% of names were straight, case insensitive matched of the canonical names in the Catalogue of Life 2011 Annual Checklist.
Completeness of the taxonomical classification
In order to study the completeness of taxonomical classification in the GBIF Index, we assessed for each rank (kingdom, phylum, class, order, family, genus and species) the valid references generated after the harvesting and indexing routines. The level of completeness is therefore based on valid taxonomical references within the GBIF taxonomical backbone. In cases where for example a family name wasn’t mapped correctly, a ‘null’ value is assigned to this field in the published occurrence record. For each rank, we evaluated the number of occurrences and species (or lower taxa) having incomplete or unknown taxonomical status – or ‘null’ values (e.g. counting all occurrences having an `unknown` status for the kingdom rank). Table 4.a provides a summary of our findings in December 2010 and Table 4.b the summary for February 2012.
In 2010, a total of 114,721 species or lower taxa corresponding to 15 million occurrences representing 5.6% of the GBIF Index were not ‘mapped’ against the GBIF taxonomical backbone at the kingdom level. Similar trends are observed for other taxonomical ranks with somehow a variation in amplitude of incompleteness (e.g. 14.5% for species and lower taxa at the family level and 7.4% at the species level). This analysis confirmed similar results obtained in 2008 and 2010 (GBIF, 2010b and Ariño and Otegui, 2008). However some of the correctly matched names against the GBIF taxonomy backbone may not be valid names if referred to authoritative references such as Catalogue of Life. The reasons being that some of these names if not matched to the existing GBIF taxonomy backbone during the harvesting and indexing processes were simply added as valid references. The mixing of valid taxonomical references with new unverified references with limited capacity to track such changes over time
caused serious difficulties to our study. The assessment summarized in Table 4.a provides therefore more a status of incompleteness of the taxonomical backbone rather than a real comparison to any authoritative taxonomical references.
In December 2010, our preliminary findings suggested the need for an urgent review of the GBIF taxonomical backbone in particular against the most critical taxonomical authorities such as the annual checklist Catalogue of Life 2010 (http://www.catalogueoflife.org/) and other sources such as the Interim Register of Marine and Nonmarine Genera (IRMNG). The decision not to mix unverified names with existing authoritative names was critical. In November 2011, GBIFS successfully upgraded its taxonomical backbone against the latest version of the Catalogue of Life (2011) and other authoritative references.
This resulted in our February 2012 study in a more accurate assessment of the taxonomical gaps within the GBIF Index. The results of this analysis are presented in Table 4.b. The percentages of incompleteness observed in 2012 were significantly lower (i.e. 0,35%, 1.81%, 2.82%, 2.17% respectively at the Kingdom, Class, Family and Genus levels) than the once observed in December 2010 (i.e. 7.0%, 14,5%, 14,5% and 4.7% respectively at the Kingdom, Class, Family and Genus levels) with the exception of the species rank. Similar trends are observed taking into account occurrences. Therefore a high number of unmapped taxonomical ranks from Kingdom to Genus levels were resolved using the upgraded GBIF taxonomical backbone. The higher number of taxonomical references used to construct the GBIF taxonomic backbone largely explains this. The observed percentages of unresolved names at the species level represents 9.15% in 2012 while in 2010 this percentage was of 7.4%. However these numbers can’t be compared because of the changes in the taxonomical backbone between these dates.
Taking into account these improvements in taxonomical name resolution, we have tried to assess the additional data quality improvements
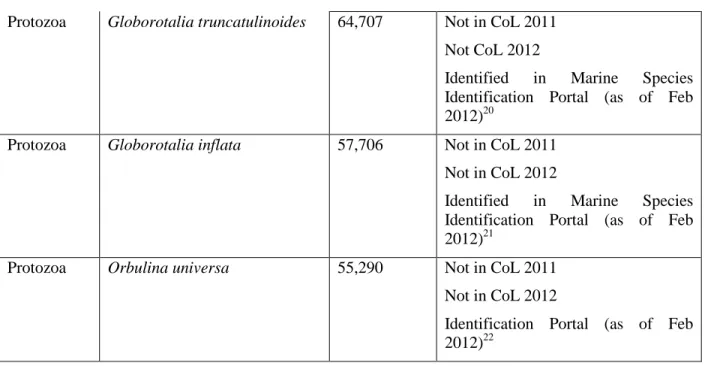
that could be undertaken. To achieve this, we have looked at the top 10 possible misidentifications (at the kingdom level) by number of occurrences (Table 5). The three species within the genus
Zonotrichia listed as within the plantae kingdom are wrongly assigned. These species belong to the American sparrows group of the family Emberizidae17. This misidentification is due to the generic homonym Zonotrichia being both present in the Plantae and Animalia Kingdom. This misidentification is being resolved in the GBIF taxonomical backbone and these obvious misidentifications progressively corrected18. For the other cases listed in Table 5, the discrepancy with CoL 2011 version is resolved in the latest version of the CoL (February 2012) or other taxonomical authorities (i.e. Marine Species Identification Portal). Once these changes are implemented we estimate that 1,808,488 occurrences would be correctly mapped and the total of occurrences with ‘unknown’ status at the species level would decrease from 25,343,834 to 23,535,346. This shows that while the GBIF Index has grown from 267 to 324 million occurrences (+21.3%) from December 2010 to February 2012, corrections on the top 10 species misidentifications in February 2012 would have resolved a substantive volume of the GBIF Index: the growth in occurrences with ‘unknown’ status at the species rank would have grown of only 2.3% (from 23,015,905 to 23,535,346).
It is therefore reasonable to extrapolate that: a large portion of the gaps identified in Table 4.b will in the future be resolved with newest versions of the taxonomical authorities used to build the GBIF taxonomic backbone. The rate of resolved names should in principle directly be correlated with the growth in volume of the taxonomic authoritative references used by GBIF.
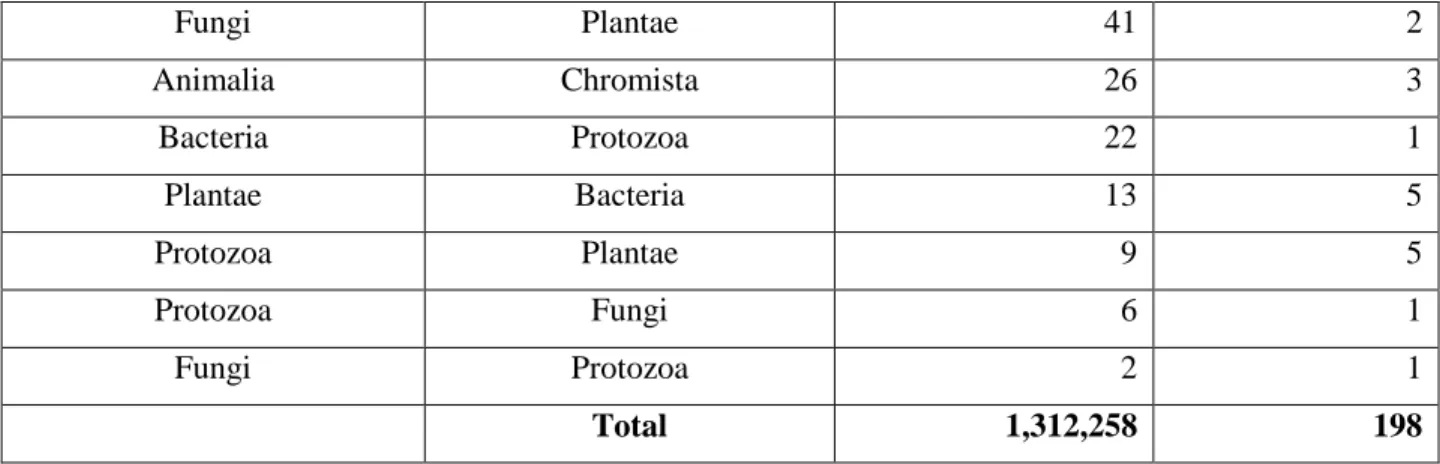
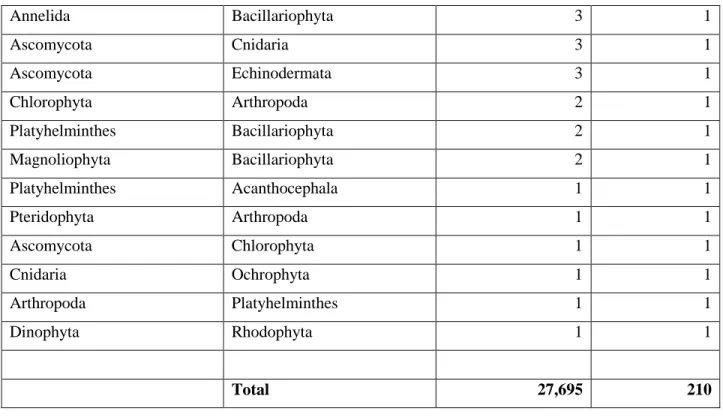
Table 6.a provides a summary of the taxonomical misidentification at the Kingdom level and an indication of the total number of associated occurrences affected. For example,
17
http://en.wikipedia.org/wiki/Zonotrichia
18 http://dev.gbif.org/issues/browse/CLB-119
correcting the wrong assignment of 90 species from the Kingdom Plantae to Animalia will impact more than 1.3 million occurrences within the GBIF Index as of February 2012. On the other hand correction of the wrong assignments to Animalia of 26 species will only affect 1,536 occurrences. Similar breakdowns are provided for Phylum (Table 6.b) and Class (Table 6.c). This table shows that the effort in correcting misidentifications at a high taxonomical rank (e.g. Kingdom) will impact a limited number of occurrences (1.3 million representing less than 0.5% of the GBIF Index)
Only 9.15% of the discovered scientific names in the GBIF network have not been mapped to a taxonomic reference at the species level. Such volume of unknown references includes for example species not yet endorsed by existing authoritative references used to construct the GBIF taxonomy backbone, as well as misidentified or wrongly spelled names. This represents 7.82% of the GBIF Index in terms of volume of occurrences (i.e. 25.3 million occurrences). We have also demonstrated that this volume of unmapped scientific names has grown less than the growth of the GBIF Index: +9.9% (25.3 million in 2012 against 23 million in 2010) while the GBIF Index has grown in the same period of +21% (267 million occurrences in 2010 and 323 million in 2012). The study also demonstrated that compared to the largest authoritative reference - the Catalogue of Life (CoL) – only half (53.47%) of the species names known to GBIF would have been recognized. The other half are mostly names known to other taxonomical references but unknown to CoL.
Geospatial:
During the harvesting and indexing routines, these geo-referenced occurrences are checked in particular for wrong assignments (e.g. when the latitude and longitude information is not corresponding to the country where the occurrence was observed/collected). In the context of this study, we considered geo-referenced occurrences as a record in the GBIF Index with the latitude and
longitude within the earthbounding box (i.e. -90<=latitude<=90 and -180<=longitude<=180). This amounted to 99.67% of all occurrence records where geo-spatial information was provided in the GBIF Index in December 2010- the remainder being ‘extra-terrestrial’ (Otegui et al., 2009). This includes a substantial number of records being reported as 0.0N, 0.0E and therefore suspicious. This could happen for example when the publisher maps a zero value to the latitude or longitude fields instead of a ‘null’ value. In order to solve such problems, publishers should in addition to ensuring that the mapping of the fields is appropriate, provide for example the country in which the observation/collection has occurred. This would greatly facilitate the validation of geo-referenced occurrences during the harvesting and indexing routines.
In end of 2010, 18.45% of the mobilised data were not geo-referenced. This percentage was lower (14.1%) in our assessment of February 2012. As shown in Figure 4, the rate of geo-referenced records is increasing over time. Such rate is higher for recent years of collection/observation (e.g. from 1973 the rate is constantly greater than 80% for the February 2012 assessment). For older occurrences the rate of geo-referencing is decreasing substantially. For example, before 1930, the rate of geo-referencing was largely lower than 50% and this can be explained by technology limitations (e.g. absence of GPS), absence or limited data collection standards covering geo-location (e.g. latitude/longitude, or geo-location fields in collection forms) or simply due to the absence of such information in the collection forms.
During the harvesting and indexing procedures, a series of verifications on geospatial fields (e.g. latitude, longitude, country boundaries etc.) are performed enabling for example identification of potential latitude/longitude incorrect assignments. This can be the case for occurrences where longitude and latitude values were swapped; or simply when the longitude value was incorrectly assigned causing for example occurrences originally collected/observed in North
America to appear on the Asian continent. In February 2012, we estimated that less than 3.6% of the total georeferenced occurrences are falling in this category. In addition we estimated that occurrences without latitude and longitude information but with information for the locality represent 11.1% of the total GBIF Index. Taking into consideration that GBIFS is not mandated to apply corrections to the original published occurrence records, these records with possibly wrong coordinates are therefore only flagged during the harvesting and indexing routines. These occurrences aren’t displayed on maps through the GBIF data portal but the original occurrences records are kept intact. Users of the GBIF Index (e.g. scientists) should be aware of this limitation and ensure that they consult the ‘geospatial issue’ flag provided by the GBIFS. While this addresses partly the problem, it is important to note that the verification and correction of the original occurrences records lies with the publishers. The availability of better guidelines19 and practices in recording biodiversity observations/specimens should support publishers in this effort. In addition, the use of tools like BioGeomancer and GEOLocate should be recommended and more widely promoted. Such tools parse place name descriptions in multiple languages and provide in return a set of longitude/latitude coordinates associated with that description. The data curators can therefore enrich their database content, increase the quality and accuracy of the content mobilised through GBIF and thus makes it suitable for wider uses.
The high percentage of georeferenced records within the GBIF Index as well as the observed positive improvements in our two assessments is an important quality stamp of the GBIF mobilised data.
The study showed that the rate of geo-referencing in the GBIF-Index is increasing over time due mostly to better data quality checking
19
Principles of Data Quality - Arthur Chapman http://www.gbif.org/orc/?doc_id=1229
activities both at the publisher and central levels (Figure 4). The improvements are observed for all decades since 1900. However, the variability is very high and older occurrences are expected to have a lower probability of valid geospatial information (e.g. prior to 1930: <50%, 1930 – 1960: <70%, 1980-2010: >80%). More importantly, our study shows that the percentage of potential wrong geo-spatial records is very low (<3.6%). In most cases, such situation can be explained by wrong latitude or longitude sign assignments and these can be easily resolved by swapping coordinates.
Temporal:
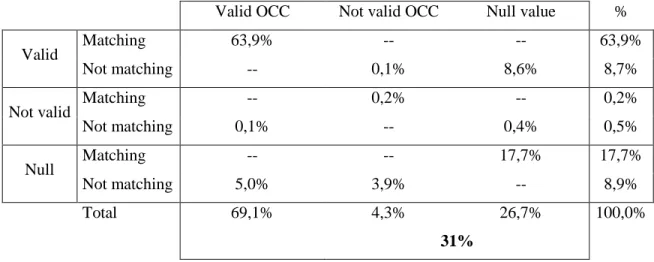
As detailed in Table 7, 30.8% of the GBIF Index contains records with null or not valid year in the date time stamp field. The UNZYEC analysis (Table 8) estimated a similar percentage (31%) although it distinguished invalid years (i.e. before 1750 or in the future). The breakdown provided in this analysis shows that 4.3% had not valid date stamp data and 26.7% had no data or null values. However, the comparison between raw data and processed data uncovered some issues on date processing, such as mismatches between the published and interpreted date stamp. For example, 8.6% of the records with a value in the date stamp field were nullified during the harvesting and indexing procedures. In addition, 5.0% of the null values in the publisher data were converted to valid date stamp values after harvesting and indexing. More details about this mismatch can be found in Otegui & al., 2013 (this volume). Thus, according to the UNZYEC study (Table 8), 36.1% of the records would be either undated or doubtfully dated at the year level. These analyses show that a large volume of date stamp information does not convert to a valid date stamp, or at least lacks
information about the year of
collection/observation. In 2011, these preliminary findings were taken into account by the GBIFS and existing processes to interpret date stamp at the publisher level were reviewed and improved. Table 7 shows also the comparison between the
assessment made in December 2010 and February 2012. While during this period of time, the GBIF Index has grown by 21% in total (respectively 267 in December 2010 to 324 million occurrences in February 2012), the total number of occurrences with no year provided in the final GBIF Index has decreased by 47.9%. This amounted to 13.3% of the total GBIF Index compared to 30.8% in December 2010. Most of these improvements relate to improved interpretation of malformed data stamp information in the published resources during the harvesting and indexing routines.
Temporal information is useful for two classes of questions: 1) biogeographic changes over time and 2) phenological. The year information is the most important element within temporal date stamp information to note long-term changes. However, the month and day elements provide additional accuracy in particular when looking at migratory species moving for example from feeding to reproduction areas during the same year. Partial date, as found on many older specimens may be useful for one or the other of these purposes even if they cannot serve all needs. Such gaps in the temporal attributes are a limitation for certain types of analysis, such as population cycles or changes in migration patterns related to climate change.
Alone, the low percentage of occurrence records without temporal information (13.2%) is not considered as a major limitation. However, combined with other parameters like geo-referencing, it could become a serious limitation for scientists in particular when dealing with analyses requiring the combination of these (e.g. ecological niche modelling). As shown in Table 9, if we consider only presence of valid temporal and geospatial information as determinants of ‘fitness for use’ in the context of ecological niche modelling analysis, 78.8% of the GBIF Index is meeting these criteria. This total represents 484,963 (48.6%) species from the total identified in the full GBIF Index of 995.974 species as of February 2012. But this also indicates that 51.4% of the species recorded in the GBIF Index don’t
have a single information on the temporal*geospatial dimensions.
Background ‘noise’:
In December 2010, we estimated that 121.7 million records had missing, doubtful or wrong information in at least one of the three key attributes (i.e. taxonomy, georeferencing and temporal). This represented 45.6% of the GBIF-mobilised data records (267 million records). Although this was an improved figure compared to the 50.1% calculated in May 2008, it calls for concerted efforts firstly to sensitise data publishers of the need to ensure that all available temporal, taxonomical and geospatial information are correctly mapped during the publishing process to GBIF. In 2011, GBIFS had greatly improved its harvesting and indexing processes in order to optimize its ability to interpret as accurately as possible the information of publishers. In February 2012, the taxonomical backbone was greatly improved and the indexing processes fine-tuned. This has led to a lower percentage (21.3%) of the GBIF Index with absence of information in at least one of the three variables: temporal, taxonomical and geospatial. While these data quality trends are promising (Figure 5), they are mostly due to technical improvements in the GBIF IT infrastructure and much more efforts are required at the level of the data publishers within the GBIF community.
Collection curators should be encouraged to explore ways to improve the quality of the published information in particular for three dimensions, namely: taxonomical, temporal and geospatial. Many tools are aimed at helping curators to identify possible errors and to standardise data in accordance with authoritative references. Some key examples are:
SpeciesLink developed by CRIA (Centro de
Referência em Informação Ambiental)
available at: http://splink.cria.org.br/
BioGeomancer coordinated by the University of California at Berkeley
(http://www.biogeomancer.org)
DIVA-GIS developed by Robert Hijmans
(http://www.diva-gis.org/)
BIDDSAT developed at UNZYEC (Otegui & Ariño, 2012) available at: http://www.unav.es/unzyec/mzna/biddsat/
Duplicates
Concerns about the amount of record duplicates in the GBIF Index were also raised over recent years (Hobern, 2003; Page, 2012). Such situation could happen for example when the same dataset is published more than one time through GBIF. Comparing datasets on criteria like taxonomy, temporal and geospatial information can easily identify these cases. To assess these cases, we assumed that a duplicate record would be identified when the values respectively for taxonomical (species id), temporal (timestamp date e.g. YYYYMMDD) and geospatial (latitude and longitude) are identical. Based on this assumption, we calculated in February 2012 the total amount of potential duplicates between resources. The results are summarized in Table 10. We have identified 42 combinations of datasets with at least 100,000 potential duplicate occurrences representing a total of more than 30 million occurrences. This represents more than 9.5% of the GBIF Index. The top 20 potential duplicate combinations are listed in Table 11. In all cases (e.g. INBio, CNIN/Lepidoptera, Pelagic Fish Observations 1968-1999, Birds (KIEE-BI)) it appeared that the resources were republished twice to GBIF but with a different name (e.g. ‘Pelagic Fish Observations 1999’ and ‘Pelagic Fish Observations 1968-1999 (Australian Antarctic Data Centre)’). What appears very surprising is that most of these potentially duplicated resources were registered with very similar names (e.g. ‘CNIM/Lepidoptera’ and ‘Colección de Referencia de Lepidópteros Diurnos Mexicanos de la CNIN’). When a new resource is registered, a simple text comparison between the title of the new resource with existing published ones would have enabled rapid
identification of obvious possible duplication. This has never been implemented up to now in GBIF but efforts are underway to automate this process as well as to resolve the already identified potential duplicates in close communication with the respective GBIF publishers.
An improved monitoring of the resource at the time of registration is indeed an immediate solution but ultimately the adoption of persistent identifiers for each resource published (e.g. DOI), with proper metadata, would have been a much more robust solution.
B. Trends and patterns assessment Taxonomy:
In December 2010, of the 267 million occurrences records accessible through the GBIF network 62% belonged to Kingdom Animalia, followed by Kingdom Plantae (23%), Fungi (1.55%), Protozoa (0.67%), and Bacteria (0.59%) (Figure 6.a). A similar assessment in February 2012 (Figure 6.b) showed that the major variation was the increase for the Plantae from 23% to 30%. Between these two assessments the GBIF taxonomical backbone was reviewed with the latest version of the Catalogue of Life. Monitoring of the taxonomical name resolution during the GBIF harvesting and indexing procedures has shown that a large proportion of names previously classified as ‘Unranked/Unknown’ were now reclassified in particular within the Kingdom Plantae (GBIF, personal communication).
In December 2010, as depicted in Figure 6.a, 52% of the occurrences belonged to Phylum Chordata (Kingdom Animalia) followed by 17.7% belonging to Phylum Magnoliophyta (Kingdom: Plantae), and 9.8% to Phylum Arthropoda (Kingdom Animalia). A breakdown at the Class rank (Figure 8.a, Figure 9) shows that the largest Class in the GBIF mobilised data is Aves (43%). This is mostly due to field observation from the ornithological community as depicted in Figure 10. In December 2010, the Bird Observation Checklist database represented 42.21 million occurrences or
15.7% of the total GBIF Index at that time. Within this top 5, four resources are related to bird watching activities (e.g. Bird Observation Checklist database, Project FeederWatch, Great Backyard Bird Count, Southern African Bird Atlas Project). While these figures clearly indicate the dominance of bird observations among the data accessible through the GBIF network, it also demonstrate the effectiveness of a given specialized network to leverage on the existence of GBIF to enable the publishing, discovery and access to such type of biodiversity observations.
These figures also show that the spread of occurrences across various taxonomical levels is also rather heterogeneous (Figure 7.a). Some phyla are extremely underrepresented, while specific classes such as Aves dominate, or even orders within the class Hexapoda (insects) (Figure 8.a and b, Figure 9). The hierarchy of the most represented groups (irrespective of taxonomic level) shows Classes Aves, Actinopterygii (bony fishes), Poales (grasses), Mammals and Asterales as the largest groups, followed by Order Lepidoptera within the Class Hexapoda. On the other extreme, for example Phyla Zygomycota, Nemata or Platyhelminthes, or Kingdom Bacteria, have marginal occurrence despite their natural abundance. However it is important to note that many of these apparently overrepresented taxa are species-rich, and have greater biomass and greater visibility, but also a higher number of competent specialists and observers. Having such large amount of data for a relatively small number of taxa should also be considered as a positive asset in particular when looking at temporal species distribution, provided that these taxa are ecologically diverse as well as representative. The availability of such high-density information for fewer taxa should not be under-estimated.
The analysis of the temporal spread of GBIF-mediated data for the two dominant Kingdoms (Animalia and Plantae, Figure 11) shows that the exponential increase observed from 1960 is mostly explained by the abundance of occurrences for the Kingdom Animalia. This increase of bird
observation data records exceeds the mobilised data from all other classes from year 2000 onwards. In the same period (1960-2010), we also observed that beside a peak in 1999, the trend for Plantae is stable varying from 1.5 to 2.1 million occurrences observed/collected per year. As shown in Figure 13, the exponential increase of data records in the GBIF Index in recent years is largely explained by the growth of occurrences in the class Aves. Figure 14 provides a breakdown of occurrence records by basis of record within the class Aves. Since 1960, bird observation data have been growing almost exponentially while the trend remains stable for specimen and other types of data. If these trends are confirmed in upcoming years, it is expected that the growth of data records in Aves will be the main driver behind the growth of GBIF Index in terms of volume.
This phenomenon is even more revealing when listing the top 15 species by the number of data records. Tables 12.a and 12.b show that all of the top 15 species are birds, mostly published through networks like ‘eBird Bird Observation Checklist’, or other similar resources (e.g. Project FeederWatch, Great Backyard Bird Count).
In order to demonstrate the difference between the Kingdom Animalia and Plantae, we have generated two sub-indexes for each Kingdom from the February, 2012 version of the GBIF Index. Each sub-index was subdivided in new subsets based on the range of occurrence numbers for each species. Table 13 provides the summary of the results. For example, from the total of 457,340 Animalia species in the GBIF Index, 400,088 are species with less than 100 occurrences each, and represent 2.4% of the total number of occurrences in the Kingdom Animalia. The breakdown of species by occurrences did not show any major differences between the two Kingdoms except for 20 species in the Kingdom Animalia holding more than 1 million occurrences each, while no species had as many occurrences within the Kingdom Plantae. However, occurrences themselves diverged between Kingdoms. The set of 20 species having more than 1 million occurrences each
identified in the Animalia Kingdom accounted for 15.9% of all Animalia occurrences (zero for Plantae), and for the species in the range 100,000-1 million occurrences a higher percentage was also observed for Animalia (39.8%). Plantae occurrences concentrated around species represented each by less than 100,000 occurrences. We conclude that the abundance of occurrences records in the GBIF Index for a few Animalia species is representing a significant portion of the full GBIF Index. These records are mostly represented by bird observation data. However this trend shouldn’t under-estimate the amount of species from all Kingdoms having less than 1 million and more than 1,000 occurrences, since these do represent a large portion of the GBIF Index (74.5% of Animalia and 78.7% of Plantae).
We have compared the distributions of the year of collection/observation of occurrences for both Plantae and Animalia Kingdoms (see Figure 12.a. and 12.b) taking into consideration the December 2010 and February 2012 versions of the GBIF Index. Both figures show that over time the rate of data mobilised per year tend to increase in both cases. However, for Plantae (Figure 12.a) we observed that, aside a few artefacts (e.g. year 1999) the rate of mobilisation is increasing at a slower rate to even stagnate from year 2000 compared to the Animalia Kingdom (Figure 12.b). On the other hand, we observed that the evolution for the Animalia Kingdom was approximately exponential in both versions of the GBIF Index. As indicated previously, this is attributed to the increased proportion of bird data in the GBIF Index in particular in the last decade, as shown in Figure 13. This confirms the fact that the rapid growth of the volume of occurrences in the GBIF Index is mostly driven by the bird observation data. The spread of other large publishers is perhaps wider, the main difference being the concentration of bird data towards recent years and few publishers (see Otegui & Ariño, 2013).
The value of observational data in comparison to voucher specimen in museums or accessions stored in genebanks is a subject for another
discussion. However this study (Figure 14) demonstrates the over-representation of observational occurrences in the GBIF Index. The ratio between observation and specimen was very close to 1:1 until 1975. Thenceforth, the amount of observation occurrences has grown exponentially while the trend for specimen data was very much stagnating until 2000, where we observed a decline. In the last decade, the proportion of observation occurrences represented more than 90% of the yearly collected/observed occurrences.
The dominance of bird observational data in the last decades, as well as the drop for data mobilized in recent years for other classes during the last decades, is cause of concern. While on one hand the availability of such large volume of bird data will enable advanced research in temporal trends of bird populations, it also reveal the difficulty to undertake such valuable research in other classes. Part of this can be explained by rapid data mobilisation of the “low-hanging fruits” (or relatively easy to digitise and publish) vouchered specimen data (Berendsohn et. al., 2010). Many of the large natural history museums have digitised their main historical records (Ariño, 2010) and published them through GBIF. It is therefore expected if this situation of dichotomy between bird observation data and the other classes will increase in the next years.
Taking into consideration the existing major threats to biodiversity, the GBIF community needs to greatly strengthen its capacity to assess trends also for all non-bird biodiversity records. For example, GBIF could evaluate the opportunity to develop a list of priority species based on known references, for example the IUCN Red List; gather information about their distribution, and evaluate for each the availability of rich yet still undigitized or electronically unavailable occurrence data in the GBIF community. This approach would lead to a series of strategic data mobilisation strategies for each priority species.
Geospatial:
In the December 2010 assessment we observed (Table 14) that the majority of the occurrences present in the GBIF Index were located in Northern America (28.19%), Northern (30.06%) and Western (11.48%) Europe. This represents a total of 69.73% of the GBIF Index. In February 2012, we observed the same trend where these three regions represented 70.8% of the GBIF Index, with minor variations in the order (e.g.
Northern America was classified as the second region in 2010 while it became first in the 2012 assessment). There are multiple reasons that can explain this distribution.
The comparison between existing financial contributions to the GBIF Secretariat (Table 15, as of year 2010) on a regional basis shows that the sum of the contributions of these three regions equals 64.9% of the total GBIF operational budget, which is very similar to the percentage of occurrences collected/observed in these regions (69.73%). The major discrepancy observed in this table is the financial contribution of Eastern Asia countries (22.1%) for only 2% of the occurrences in the GBIF Index. This can be explained by the contribution of Japan within a region where the rate of data mobilisation is still low.
In 1999, The OECD Biodiversity Informatics Subgroup in its Working Group on Biological Informatics report made major recommendations for the establishment of GBIF. It is therefore not surprising today to observe (Table 16) that the majority of the occurrences in the GBIF Index are located in OECD countries (84.45%). Taking into consideration megadiverse countries, large countries like Brazil, China, Democratic Republic of Congo, Indonesia, Malaysia, Papua New Guinea or Venezuela are not yet members of GBIF in 2012 making it difficult for information from these countries to be published through GBIF. Thus, GBIF mobilised data are very much biased towards it original founders, mostly OECD countries. A clear example can be found in Otegui et al. (2009), where the geospatially-explicit provenance of data
contributed by European publishers in the 2008 sample nicely matches the publisher’ country (Figure 19).
As shown on Table 17, not surprisingly the majority (85%) of the occurrences were located in high-income countries, 11.7% in upper-middle income countries and less than 4% in lower-middle and low income countries.
The distribution of occurrences along latitude (Figure 16) confirmed also the large proportion of occurrences located in northern hemisphere, where the three regions contributing most records are located (Table 14). The peak observed in the southern hemisphere is mostly explained by the recent publication of a large volume of occurrences from South Africa, Australia, and in particular through the Atlas of Living Australia. However, the species richness, as measured by density of species per half-degree of latitude (Figure 17), showed a slightly different trend. We did not observe the large dichotomy between the two hemispheres that appeared in the density of occurrences, and the species richness ranged from 10,000 to 40,000 species per half-degree. Figure 18 provides a justification for these trends. The average number of occurrences in the southern hemisphere did not exceed 35 occurrences per species at that latitude range resolution, while this rate exceeded 50 for much of the latitudes north of 50ºN, and even reached peaks higher than 160 occurrences per species per half-degree. We therefore conclude that despite a bias of occurrences towards northern hemisphere, the species richness observed is equally distributed between hemispheres. We also conclude that species in northern hemisphere had a higher rate of occurrences/species than in southern hemisphere. This can suggest a wider distribution of temporal data for these species in the northern hemisphere, and therefore the availability of information more suitable for studying the temporal trends of species distribution in these regions. For the southern hemisphere, we also conclude that many species may not have sufficient occurrences to perform such analysis.
Temporal:
The temporal evolution in the GBIF Index is summarized in Figure 20. With the exception of a few artefacts (1950, and 1987 for the December 2010 curve), we observed that the availability of occurrence data over time grew almost exponentially. A striking feature in this trend was the presence of large peaks in specific years. These peaks seemed to respond to a combination of a provider effect and a possible mismatch between published data and indexed data arising from the date processing algorithms, that is explained in detail in Otegui et al., 2013 (this volume). The drop observed in the last period (between 2007 and 2010) for the December 2010 assessment can be attributed to the lag time required between the data collection/observation, digitization and publishing through GBIF. The same lag time (3 years) was later confirmed for the February assessment. We conclude that the amount of biodiversity data collected or observed tends to be greater for more recent years than for any older period (e.g. prior to 1970-1980). We also analysed the evolution of such trend by comparing the December 2010 and February 2012 assessments (Figure 21). The two horizontal lines represent the average growth in the GBIF Index for all occurrences and for occurrences having temporal information. The difference can be explained by two factors: (1) the improvement of the GBIF indexing processes in 2011, which enabled greater recovery of malformed date-stamp fields; and (2) the greater percentage of well-formed temporal fields (e.g. date of collection/observation) in the recently published data. The graph shows that for more recent decades (e.g. 1971-1980 onward) the growth of data in the GBIF Index is faster than for older data. More remarkably, we observe that for the latest decade (2000-2010) the variation is of 89.6%, which is the highest growth rate ever observed. The exponential growth of recent data in the GBIF network content is particularly driven by the availability of bird observational data during the last decade; this growth in recent content is sometimes termed a 'data deluge'.
The trends for the number of species collected/observed every year since 1900 (Figure 22) for both Plantae and Animalia were very similar. We observed an increase until the 1990’s, and then stagnation followed by a drop from year 200 (with the exception of few artefacts). The drops observed in 1914 to 1917 as well as from 1939 to 1942 can be easily explained by the effect of the two world wars. What is troublesome, however, is the drop in both curves from 2000 onwards. The drop for the Animalia is even more severe than for Plantae. While the volume of occurrences mobilized every year is increasing until 2009, we note that at the same time these occurrences belonged to fewer species across both Kingdoms. One possible explanation could have been related to a lower number of data resources publishing since year 2000 (Figure 23), but it should be noted that the decline in species richness started more than one decade earlier. We have also calculated for each year the rate of geospatial occupancy in a grid with a resolution of half-degree (Figure 24). We observed that in all cases the grid occupancy for Animalia species was higher than for Plants. From 1963 to 1993, grid occupancy for Animalia was stable followed by a peak in 2000. For Plantae, grid occupancy was stable from 1970 until 2000. We also noted that in both cases grid occupancy started to decrease in 2000.
A detailed analysis of these trends will be further presented in a separate study.
C- ‘Fitness-for-use’ assessment:
Assessing the value of the GBIF mobilised data for a variety of usages is challenging. In this study, we decided to focus on the most common uses for GBIF-mobilised data reported in the scientific literature: ecological niche modelling (ENM) (Grinnell, 1917; Fernández et al., 2009; Peterson and Vieglais, 2001) and related analyses. The compilation of scientific literature using or citing GBIF is available since 2011 on-line at:
http://www.mendeley.com/groups/1068301/gbif-public-library/. Such modelling techniques (e.g.
using Maxent) required occurrence records with proper temporal attributes, correct geo-referencing attributes as well as sufficient volume of well-distributed data-points. The minimum number of distinct data-points for a niche modelling analysis is in the range of 10 to 20 (Pearson et al., 2007; Grantham et al. 2008). Recent studies on GBIF-mediated data using more than 19,000 plant species showed that a preferred threshold of 20 to 40 points is recommended (Jarvis, Personal communication). Maxent models generated for species meeting these criteria have an area under the curve (AUC) greater than 0.75 in more than 95% of the cases.
If time series are part of the models, then the requirements on number of data points can be an order of magnitude higher. For example, Ariño and Pimm (1995) showed that successful modelling of the evolution of population extremes require a minimum of 15 distinct time-dependent population estimates. In terms of ENM, it could be argued that if using cell frequencies in the ENM as an indicator of potential population estimates, at least 15 independent models, each time-constrained, should be needed to adequately characterize any time-dependent changes in the model. This may hold for both terrestrial and marine models, despite their intrinsic differences (Warner et al., 1995).
In this study we have decided to use the threshold of “presence in at least 20 distinct cells in a 1/10 degree grid” to define whether a species has sufficient occurrences in the GBIF Index to be used for ecological niche modelling. We used this threshold for temporal/spatial requirements to assess the number of species suitable for such ecological niche modelling analysis, but make no attempt yet to assess whether each selected species can be adequately modelled over time.
Tables 18.a, b and c provide a distribution of the number of species falling in various categories of grid occupancy. Our analysis was based on the February 2012 version of the GBIF Index due to the improved accuracy of the taxonomical matching, the greater resolution of date stamp as
well as for geo-referencing attributes. For the full GBIF Index, more than 995,975 species (Table 18.a) were recorded in the GBIF Index (with at least one occurrence record). However only 603,532 species had at least one occurrence present in the GBIF Index with at least one presence in a distinct 1/10-degree grid. This means that 39.4% of the species recorded had no geo-referenced attributes. 747,988 species had at least one occurrence with a valid temporal attribute. This number dropped to 485,105 species if we added the condition of at least one geo-referenced attribute within a 1/10-degree grid. If we consider the ENM threshold of 20 presences in 1/10-degree grid with valid temporal attributes, the total number of species that were suitable for ENM analysis fell to 81,057. This represents 8.1% of the species recorded in the GBIF Index. While this percentage could be interpreted as a low percentage, the number of species falling in this category is already very high for many scientists and researchers interested in estimating the actual species distribution as well a projections in the future taking into account future climatic scenario. The use of such information is extremely valuable already for advanced scientific research and in particular in support of global biodiversity assessments such as the Strategic Plan on Biodiversity of the MEAs (also called Aichi Targets). Taking into account the constant growth of the GBIF Index with the addition of new datasets for example, it is logical to expect that this amount of ‘eligible’ species will increase over time.
What was also remarkable was the number of species with a presence in at least 100 1/10-degree cells with valid temporal attribute: 14,041. This rich reservoir of species with high quality occurrences is already an important message to the research community seeking to assess the species distribution evolution over time as well as future predictions. As shown in Table 18.b and c, this number is somehow equally distributed between species within the two dominant Kingdoms: Plantae (6,100) and Animalia (6,756). Figure 24
also shows the temporal trends between these two Kingdoms. Even if the grid occupancy is constantly higher on a yearly basis for Animalia, the trends between these two Kingdoms are very similar. The same trends are also observed for a low threshold of 20 1/10-degree grid presences. We also noted no major differences between Kingdoms in the breakdown assessment of the Animalia (Table 18.b) and Plantae (Table 18.c): 36,462 Animalia species were suitable for ENM (7.9% of the total number of Animalia species recorded in the GBIF Index) against 37,730 Plantae species (8.7%). Therefore the concerns about the over-representation of bird observation data within the Kingdom Animalia are contradicted here in terms of ‘fitness for use’ since a large number of plant species were already meeting the ENM suitability criteria. Figure 25 proves how much the two Kingdoms can’t be distinguished when looking at a presence higher than 20 in 1/10-degree grids.
In this study, we have also tried to assess the grid occupancy at Class (Table 19), and Family (Table 20) levels. Our objective was to assess the percentage of species within each rank suitable for ENM. For example, within the class Aves 45.2% of the recorded species in the GBIF Index were already suitable for ENM studies. In this particular case, we can conclude that the GBIF Index as of today can be used to estimate the biodiversity of most species within the class Aves. Taking into account the actual trend in terms of bird observation data, it is therefore expected that this percentage will grow in the future. Such volume of information can now open new opportunities such as studies on the over-sampled areas (e.g. North
America or Western Europe) and
recommendations for new areas where collection of new specimen/observation is required. Studies on the estimated number of species (Chao2) at a regional and global level could now be performed. Table 19 also shows that other classes are eligible for such analysis: cartilaginous fish (Elasmobranchii, Holocephali), bryophyte plants (Marchantiophyta). For many, the limited number
of species within that Class can explain this. However, for some larger classes like Actinopterygii (ray-finned fishes), Elasmobranchii (cartilaginous fish) or Pinophyta (conifers) the GBIF Index holds sufficient information for more advanced ENM or other biodiversity assessment analysis. Figure 26 provides a visual representation of these trends. With the exception of the Class Aves, the other Classes shared a similar trend.
Such analysis may thus include a bias: the number of species representing each taxon group at a given level. Large families or classes, e.g.
Hexapoda (insects), may not be listed in the Top 10 or 20 lists. Figure 27 shows the distribution of Families taking into account the number of species within each Family. While we observed that classes Aves and Actinopterygii were listed as the ones with the highest suitability for large-scale ENM, families within other classes, such as some insects (e.g. Cryptophagidae - beetles), or mammals (Phyllostomidae - New World leaf-nosed bats) are also to be considered. For even larger families (e.g. with a number of species greater than 1,000) it was not surprising to observe that the percentage of species suitable for ENM was lower. However for such large families, the suitability for ENM of 5-10% of their known species is probably a good proxy to initiate an assessment of the full class. In this category, in addition to families of insects we observe some large families of reptiles (e.g. Scincidae – lizards, Colubridae – snakes). For plants (Figure 28), the distribution of families is somehow distorted due to the high to very high number of species found within each class.
Discussion
The idea that birthed GBIF ten years ago remains as simple and powerful now as it was then: to make the world’s biodiversity information freely and universally available for science, society and a sustainable future (OECD, 1999). After 10 years of existence, the GBIF network represents the largest resource of primary biodiversity data
that is freely accessible to all. With over 377 million occurrence records about nearly one million species (as of August 2012), the GBIF mobilised data provides a data-driven window to the state of the world’s biodiversity. Access to such large volume of data opens for example new research avenues from assessing the state of biodiversity, identifying the potential threats up to monitoring trends and predicting future evolution and composition of biodiversity and ecosystems (Rödder & Lötters, 2010; Ramírez-Villegas et al.,
2010; Ready et al.,2010). Since 2008 till June 2012, over 600 scientific peer reviewed papers have been published which are based on analysis and interpretations of GBIF mediated data (GBIF, 2012a).
To become such a truly ‘global biodiversity information facility’, GBIF needs now to take into consideration the primary applications it originally intended to offer to the public such as in policy
formulation, economic development,
environmental protection, education, and scientific research. In order to ensure its relevance for such applications, the GBIF community needs to warrant that the information it delivers is of relevance to address the major science, societal and policy challenges.
While these needs are very diverse and difficult to categorize they do have in common essential pre-requisites that can be summarized as follows:
“Can I trust the information provided?”
“Is the information representative of biodiversity on earth?”
“Can I use the data to model biodiversity over time?”
The present study was therefore aimed at assessing the data quality, bias and ‘fitness-for-use’ of the GBIF mobilized content. These challenging questions were addressed by tasking two separate teams to evaluate the content using different methodologies. The results from the GBIFS and UNZYEC teams were similar and they both demonstrated the validity of the conclusions presented hereby.
Are the GBIF-mediated data scientifically credible/reliable?
GBIF mobilised data is often criticized for errors (Yesson et al., 2007; Otegui et al., 2009). However, these errors are reflections of the data as collected, collated, and published by the heterogeneous data publishers across the globe. The role of GBIF is to provide a discovery window on the published data. Such a role requires reconciling, interpreting and publishing the essential key attributes: taxonomic, temporal and geospatial. In assessing the state of data quality in the GBIF Index over time, inevitably such study will combine data quality improvements at the level of the data publishers as well as at the central d