Universidade de São Paulo
2015-10
Ground vehicle detection and classification by
an unmanned aerial vehicle
Latin American Robotics Symposium, 12th; Brazilian Symposium on Robotics, 3rd, 2015, Uberlândia.
http://www.producao.usp.br/handle/BDPI/49673
Downloaded from: Biblioteca Digital da Produção Intelectual - BDPI, Universidade de São Paulo
Biblioteca Digital da Produção Intelectual - BDPI
Ground vehicle detection and classification by an
unmanned aerial vehicle
Raphael Montanari, Daniel C. Tozadore, Eduardo S. Fraccaroli, Roseli A. F. Romero
Instituto de Ciˆencias Matem´aticas e de Computac¸˜ao, Universidade de S˜ao PauloEmail:{rmontana, eduardo, rafrance}@icmc.usp.br, tozadore@usp.br
Abstract—Rotary-wing unmanned aerial vehicles (UAV) are being widely used in different applications due to its several features, such as mobility, lightweight, embedded processing and capability of flying in different height levels. Among the possible applications they are used in surveillance tasks, agriculture environments monitoring, power lines inspections and diseases detection in crops. The images captured by the UAVs need to be examined in most of the applications. This analysis is usually done by experts, but a system that process the captured images in a autonomous way can speed up the results and more images can be processed in a lesser period, which is the ideal for real time applications. This work presents a system for vehicle detection aiming at surveillance task. The system is evaluated in terms of precision of detection of a particular type of vehicle. The video was shot using a monocular camera coupled with an aerial robot developed in our Lab. The experimental results demonstrate that the proposed system can be used for the vehicles tracking task under controlled conditions.
I. INTRODUCTION
Unmanned Aerial Vehicles (UAV) are widely employed in several applications and it constantly raises the global market interest [15]. Applications vary from entertainment up to military operations. Its applications can replace human work in places of hard access, in which small UAVs can provide a different view of the environment and facilitate remote sensing, especially in cases like environment characterization and natural habitats monitoring [3]. The autonomy in this kind of aircraft is very sought after, but it is also a hard achievement [4].
The vehicle detection from aerial platforms has become an important aspect in rescue and surveillance missions. It is a system with increased popularity in civilian and military appli-cations due to its ability to operate in a broad, complicated and unstructured terrains. Autonomous UAV systems can aid and enhance search and rescue missions in remote areas, where access is limited by mountains, vast areas of land without roads or in areas affected by natural disasters (earthquake, flood). In such situations, informing the location of detected objects of interest (e.g., vehicles, people) may eliminate the need for manual image analysis of video images. The analysis
challenging task. Furthermore, the UAV mobility offers a larger area coverage than fixed cameras in roadways.
In this work we use images captured by a camera installed on the lower base of an aerial robot to detect and classify ground vehicles. The system main challenges consist of deal-ing with the orientation of the image, blurred images due to vibration and variations in lighting and dynamic ambient conditions.
This article is organized as it follows. In Section II are presented some related works. In Section III we introduce the proposed approach to detect objects in images. In the Section IV is described the aerial robot hardware and the data collected to verify the proposed system. In Section V are presented the experiments executed. Finally, in Section VI, we discuss the results and conclusions.
II. RELATED WORKS
Vision based techniques are some of the most common approaches to analyze vehicles from images or videos. The view of vehicles will vary according to the camera positions, lighting conditions and background situations. Hierarchical model proposed by Hinz and Baumgartner [9] which describes different levels of details of vehicle features and detection method based on cascade classifiers has the disadvantage of lots of miss detections. Vehicle detection algorithm based on symmetric property [5] of car shapes is prone to false detections. The high computational complexity of meanshift segmentation algorithm is a major concern in the existing methods.
Sahli et al. [13] make use of aerial images which has average resolution up to 11.2cm/pixel. In this method, the authors explore Scale Invariant Feature Transform (SIFT) [12], which effectively generates all keypoints. Support Vector Ma-chine (SVM) is also utilized to classify these keypoints to an extent. SIFT is a technique which is invariant to rotation, scale, illumination changes etc. The method is effective in outdoor images and the advantages which attracts authors’ attention is that the output is affected by noise and distortion to a very low extend. SVM is a supervised learning algorithm. This
2015 12th Latin American Robotics Symposium and 2015 Third Brazilian Symposium on Robotics
method of clustering is to find out a center for the clusters. Cluster centers have to be developed in such a way that the instances or data should attain stability. Stability in the sense should not transfer from one cluster to another, thus reducing the error rate.
Caoet al.[2] introduced an extension of the Histogram of Oriented Gradients (HOG) features overcoming those disad-vantages. Adaboost classifier is used to boost HOG features. These features are employed in the training of a linear SVM classifier. This framework utilizes low-altitude airborne plat-form. The linear SVM classificator is used for the final vehicle classification. The method is divided into two parts that include feature description and classifier training. The HOG features have the disadvantage of having high dimensionality. Boosting HOG features overcome the disadvantages by reducing its dimensionality. HOG features are actually considered as a his-togram and the bins of the hishis-togram are representatives of the weak classifiers. Adaboost training is required to translate the weak to strong classifiers. These strong classifiers contribute to the training of the SVM classifier and improve the vehicle detection.
III. METHODOLOGY
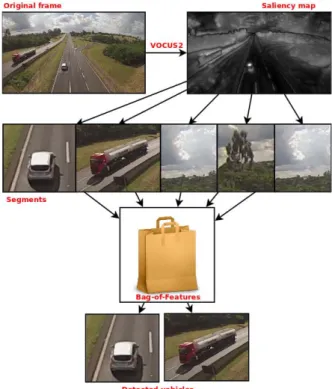
In this work, we present a combination of techniques to find and classify vehicles in a scene, as shown in Figure 1. First of all, we employed the VOCUS2 visual attention bottom-up biased method to generate a saliency map. Then the segments extracted from the saliency map is used as input to a Bag of Features (BoF) model. In this model we classify SURF [1] features using a Support Vector Machines (SVM) trained with vehicles images, thus removing no interest objects.
Both methods are briefly explained in the following subsec-tion:
A. Saliency Map with VOCUS2
The VOCUS2 [8] (that holds this name due to be a successor of VOCUS [7]) is a saliency system that follows in its basics structure the Itti-Koch [11] model: feature channels are com-puted in parallel, pyramids enable a multi-scale computation, contrasts are computed by Difference-of-Gaussians (DoG). One of the most important difference is the scale-space struc-ture (that use a new twin pyramid) and the center-surround ratio, which has turned out to be the most crucial parameter of saliency systems. Like the approach of Itti, the resulting system has a simple and elegant structure which follows concepts from human perception, but this system produces pixel-precise saliency maps, instead of segment-based ones. However segment-based saliency maps are beneficial for some tasks, especially if precise object boundaries are required. Basically, VOCUS2 system works as shown in Figure 2. The input image is converted into an opponent-color space with channels for intensity, red-green, and blue-yellow colors. For each channel, it computes two image pyramids (one center and one surround pyramid), on which center-surround contrast is computed. This structure is similar to others FIT-based such
Fig. 1: Proposed system overview.
as iNVT [11] or VOCUS [7]. For more information, Table I shows the differences between iNVT and VOCUS2 system. B. Bag of Features
Bag of Features (BoF) is a popular approach to visual object classification whose interest is due to its power and simplicity. Its origin stems from the bag of words model [14]. This approach is used for many computer vision tasks, such as image classification, robot localization and textures recognition. The methods that apply this model are based on unordered collections of image descriptors. They have the characteristic of discarding spatial information and are conceptually simpler than alternative methods.
The main concept of this approach is to compute features in an image and match with a set of features to classify the image. A feature is a property that can represent an image or part of it. It may be a pixel, a circle, a line, a region with texture, medium gray level, etc. Despite that there is no formal definition, features can be characterized as detectable parts of the image with some meaning. In the bag of features model, the extracted features are grouped and generated partitions are used to mount a dictionary of visual words. After quantify the features using the visual dictionary, the images are represented by the frequency of visual words.
The Figure 3 illustrates a visual dictionary where each picture within the bag is a group found by the the clustering algorithm. Given an image, the quantized features are similar to features found in the dictionary, so its possible to classify the image using the label of the image that is in the dictionary.
TABLE I: Main differences between iNVT and VOCUS2 system. [8].
iNVT VOCUS2
Features intensity (I), color (C), orientation (O) intensity (I), color (C) Pyramid structure one pyramid twin pyramids (main difference)
one scale per layer multiple scales per layer Feature fusion down-sampling up-sampling
weighting by uniqueness arithmetic mean fuse color channels first, then intensity treat all 3 channels equally
Fig. 2: Basics of VOCUS2 system. [8].
Fig. 3: Bag of Features [6].
In the case of Figure 3, by example, if an image has the features that describes an eye, we can associate the image to face class, because in the visual dictionary there is a eye feature with the face label.
IV. DATA COLLECTING AND HARDWARE
The aerial robot is equipped with the NAZA V2 control system, from DJI manufacturer ([10]). The control system is
Fig. 4: Software Ground Station DJI [10].
constituted by an IMU (Inertial Measurement Unit), a GPS (Global Positioning System), an energy manager and a data link. This system keeps the stability according to the aerial robot position and communicates with a ground station by the data link (receptor/robot). The ground station communicates to an iPad by bluetooth connection, in which it is installed the DJI software. This software provides several functionalities and configurations, such as to follow a pre-specified route, autonomous departing and landing, control by virtual joystick (on iPad the screen), to start, change and exit missions, to set the altitude, speed, hover time, and other settings. In Figure 4 is showed a screen of software ground station DJI.
A GoPro camera installed at a quadrotor has been used for the images acquirement. This camera is a low cost and high resolution camera (12MP). It has a noisy correction, but it allows a vision angle until 170 degrees. Further the high resolution, it has other advantages, such as, Wifi connection and protection box. In order to test the proposed system, a total of 287 pictures were manually selected from a video recorded during a 30 minutes quadrotor’s flight.
(a) (b) (c)
Fig. 5: The three types of vehicles that was considered: (a) car, (b) truck and (c) bike.
TABLE II: The classification confusion matrix.
Classes cars trucks bikes unknown #Samples Accuracy (%) cars 29 9 1 40 79 87.34 trucks 3 35 0 31 78 84.61 bikes 9 3 22 39 73 83.56 unknown 0 0 0 26 26 100 all classifiers 29/39 39/40 23/35 1/0 114 79.82 V. EXPERIMENTS
The proposed system was tested to detect vehicles of three different classes: Car, trucks, and bikes, as shown in Figure 5. Although the video capture was make in 60 frames per second, the software can’t process all that amount of information. To work around this problem, we have selected key frames to process. Key frames are select based on the movement of objects on the scene. If the amount of different pixels between two images exceeds a threshold then a new image is selected as key frame. The Figure 6 is an example of the images that has been considered for the demonstration of our system’s performance. However, other images extracted from the data set, constituted by 287 images, were also tested. These images can contain one or more vehicles in a same scene.
Fig. 6: System image input.
To recognize the vehicles with the bag of features, we used multiple SVMs of one-against-all strategy to classify the vehicles in the corresponding classes. For this purpose, three SVM were trained (one per class). For each classifier, the positive examples was all images from data set that corresponds to this specific class, and the negative ones were all the remaining images from data set. For example, all truck images were positive examples to SVM that classified trucks, and all the others images were negatives ones. In other words, the segment given to the BoF by the visual attention system is first tried to be classified by a SVM of a class. In positive case, the system considered that the current segment is a car. Otherwise, it is passed to the remaining SVM’s classes, following the same rule. If the segment don’t match any SVM in classification, it is considered a object of no interest.
We have considered a total of 40 images containing vehicles of each class as positive samples and 40 images without them as negative samples to the training of SVMs. In the Table II, it can be seen the confusion matrix obtained for the classification of the vehicles classes here considered. Each line represent a
Fig. 7: Subset of images considered for training of trucks.
classifier trained to predict only one class. The values of the columns are the predictions. If the classifier do not recognize the sample, it is classified as unknown. The classifiers was tested with 40 positives samples and 40 negative samples of its respective class and it should classify the other samples as unknown samples. For example, the cars classifier - first row in the Table - had rightly classified 29 cars, misclassified 9 cars as trucks and 1 car as bike. The unknown column shows samples that was trained as negative ones to the corresponding classifier. In this way, the accuracy for cars classifier is take by the right predict over the total of 39 positives images. For each vehicle class - cars, trucks and bikes - we tested the individual SVM. For the unknown line, we took segments of no interest, like trees and transit signs, and none of the classifiers predicted it as true, it means, it was not classified as a vehicle.
Finally, the last row of the table is the combination of all the classifiers. We selected a data base of 114 images containing different vehicles and tested against the multiple classifier. It rightly predicted 29 of the 39 cars, 39 of the 40 trucks and 23 of the 35 bike images. One car image was classified as unknown. Thus giving an overall accuracy of 79.82%.
The visual attention system has detected the vehicles in real scenes in a satisfactory time. Sometimes, it had difficulty to find the vehicles in initial attempts, and the first few given segments were objects of no interest, successfully ignored by the classifiers. This is due to the necessity of dealing with different light conditions (not considered in the training) and also due to the noise in the images during its capturing process.
VI. CONCLUSION
This paper presented a system that combines a bottom-up visual attention method, the VOCUS2, with a Bag of Features (BoF) and multiples Support Vector Machines (SVM) to detect and classify three types of vehicles in a road. The vehicles were cars, trucks and bikes. Input images of the system were collected by a Go Pro camera fixed in the lower base of an unmanned aerial vehicle (UAV) hovering the roadway.
Although this paper describes the initials steps from an autonomous system, the results shown that is viable to build a system of this kind with technology developed in the lab that this work was developed, the Robotics Learn Lab (Laborat´orio de Aprendizado de Robˆos, LAR) 1. The final system had
an accuracy of 79.82% in classifying the three kinds of vehicles. This first result is considered satisfactory, once we do not used any methods to correct the noise caused by the quadrotor and neither preprocessed the video images. The employment of such techniques could improve the accuracy in the classification. As expected, there were some mistakes in detection due to the variance of the vehicles position in the data set. There were also mismatches in classification between trucks and cars due to the bikes had less features processed by the BoF (becoming them easier to classify).
As a future work we pretend to increment the system, employing tracking techniques in order to follow the detected vehicles.
REFERENCES
[1] H. Bay, T. Tuytelaars, and L. V. Gool, “Surf: Speeded up robust features,” inIn ECCV, 2006, pp. 404–417.
[2] X. Cao, C. Wu, P. Yan, and X. Li, “Linear svm classification using boosting hog features for vehicle detection in low-altitude airborne videos,” inImage Processing (ICIP), 2011 18th IEEE International Conference on, 2011, pp. 2421–2424.
[3] H. Chao, M. Baumann, A. Jensen, Y. Chen, Y. Cao, W. Ren, and M. Mc-Kee, “Band-reconfigurable multi-uav-based cooperative remote sensing for real-time water management and distributed irrigation control,” in
IFAC World Congress, Seoul, Korea, 2008.
[4] H. Chao, Y. Cao, and Y. Chen, “Autopilots for small unmanned aerial vehicles: a survey,”International Journal of Control, Automation and Systems, vol. 8, no. 1, pp. 36–44, 2010.
[5] J.-Y. Choi and Y.-K. Yang, “Vehicle detection from aerial images using local shape information,” inProceedings of the 3rd Pacific Rim Symposium on Advances in Image and Video Technology. Springer-Verlag, 2008, pp. 227–236.
[6] L. Fei-Fei, R. Fergus, and A. Torralba, “Recognizing and learning object categories,” Short Course at ICCV 2005, 2005.
[7] S. Frintrop,VOCUS: A visual attention system for object detection and goal-directed search. Springer, 2006, vol. 3899.
[8] S. Frintrop, T. Werner, and G. M. Garc´ıa, “Traditional saliency reloaded: A good old model in new shape,” inProceedings of the IEEE Conference on Computer Vision and Pattern Recognition, 2015, pp. 82–90. [9] S. Hinz and A. Baumgartner, “Vehicle detection in aerial images using
generic features, grouping, and context,” inProceedings of the 23rd DAGM-Symposium on Pattern Recognition. Springer-Verlag, 2001, pp. 45–52.
[10] N. D. Innovationshor, “Ipad ground station,” http://http://www.dji.com/product/ipad-ground-station, 2015 (accessed January 7, 2015).
[11] L. Itti, C. Koch, and E. Niebur, “A model of saliency-based visual at-tention for rapid scene analysis,”IEEE Transactions on Pattern Analysis & Machine Intelligence, no. 11, pp. 1254–1259, 1998.
1lar.icmc.usp.br
[12] D. G. Lowe, “Distinctive image features from scale-invariant keypoints,”
Int. J. Comput. Vision, vol. 60, no. 2, pp. 91–110, Nov. 2004. [Online]. Available: http://dx.doi.org/10.1023/B:VISI.0000029664.99615.94 [13] S. Sahli, Y. Ouyang, Y. Sheng, and D. A. Lavigne, “Robust vehicle
detection in low-resolution aerial imagery,” pp. 76 680G–76 680G–8, 2010.
[14] G. Salton and C. Buckley, “Term-weighting approaches in automatic text retrieval,”Information processing & management, vol. 24, no. 5, pp. 513–523, 1988.
[15] K. Wong, “Unmanned aerial vehicles (uavs),”Department of Aeronau-tical Engineering, university of Sydney, 2006.
![TABLE I: Main differences between iNVT and VOCUS2 system. [8].](https://thumb-us.123doks.com/thumbv2/123dok_us/377769.2541718/4.892.97.532.108.842/table-main-differences-between-invt-and-vocus-system.webp)

