Do preoperative medications reduce
emotional stress as measured by
plasma catecholamine levels?
MATTILOU CATCHPOLE, CRNA, PhDSpringfield, Illinois
Preoperative medications are given as a matter of course to patients to reduce preoperative stress and promote greater relaxation. The author notes that the medications may produce undesirable side effects, and examines quantitative
measurements of patient stress to determine the effectiveness of routine preoperative medication.
Historically, medications such as narcotics, tranqui-lizers and vagal depressant drugs have been given routinely to the preoperative patient. One of the stated reasons for giving narcotics and/or tran-quilizers is to reduce the patient's emotional stress and help the patient relax. But does this really occur? The patient appears to be less stressed when these central nervous system depressants are given, but if quantitative measurements of emotional 3tress (fear, anger, anxiety)1 were made, would they corroborate this medical expectation?
Emotional stress causes increased plasma levels of epinephrine and norepinephrine. Epinephrine is released in response to emotional stress in four times the quantity of norepinephrine. Physical stress causes a release of three times as much nor-epinephrine as nor-epinephrine.2-4 Both these catechol-amines have a biological half-life of approximately one minute.4 A measurement of the plasma levels of these two molecules, with special emphasis on the epinephrine, is a measurement of acute emo-tional stress.
Both norepinephrine and epinephrine, to dif-fering degrees, cause an increase in blood pressure due to:
1. Direct myocardial stimulation that increases the strength of the contraction of the ventricular chambers of the heart.
2. Increased heart rate due to the increased conductivity of the innervation of the heart mus-cle.
3. Vasoconstriction. Norepinephrine causes essentially all blood vessels in the body to constrict. Epinephrine causes vasoconstriction selectively.
These physiological changes may help the per-son accomplish a demanding task. However, if sur-vival of a surgical operation as well as the toxic side effects of anesthetic drugs is the goal, this in-crease in catecholamines may be detrimental.
The resulting increase in heart rate and blood pressure increases the work of the heart and con-sequently its need for oxygen. With diminished pauses between cardiac contractions, there is de-creased time for perfusion of the heart muscle (especially the ventricles) by the coronary arteries. This results in a patient with an increased risk of myocardial ischemia and myocardial infarction.8'4 Because of the increased risk to the patient during surgery of increased levels of these cate-cholamines, and because of the unpleasantness of feeling emotional stress before surgery, preopera-tive medications are given routinely. The purpose of this study is to evaluate the effectiveness of this routine practice, since these medications may them-selves have unpleasant side effects such as nausea,
vomiting, depressed respirations, decreased blood pressure and an increased heart rate.4 If these pre-medications are not fulfilling the function for which they are given, perhaps they should not be administered.
Research on plasma catecholamine levels has shown that there is no climatic effect, but circa-dian effects and positional effects on plasma cate-cholamine levels are found.5'6 A partial list of other variables that change the plasma levels of catecho-lamines would include: cold, pain, anxiety, anger, exercise, hypoglycemia, hypoxia, hypercapnia, hemorrhage and hypertension." Medicines may also influence levels,8 as may conditions at the time of the sample collection and assay methods of the sample.7
Plasma catecholamine levels have been used to measure stress in patients anticipating cardiac catheterization. These levels were compared with a control group of patients not anticipating cardiac catheterization.8 There was an increase in the level of catecholamines in patients expecting cardiac catheterization as compared to patients not expect-ing cardiac catheterization. Five days after the car-diac catheterization, the patient's plasma catecho-lamine levels were reduced to the levels of those of the control patient. The researchers also found no difference in catecholamine levels according to age and sex.8
The State Trait Anxiety Index has been used to measure patient anxiety prior to and post sur-gery.9.'0 This is a completely subjective evaluation.
No quantitative measurement of stress, by measur-ing the plasma catecholamines with the routine preoperative medication as the treatment to be evaluated, has been done. Radioenzymatic assay tests became available in the 1970s, and were con-sidered very accurate by 1976,6 making this a pos-sible quantitative measurement.
Permission for this research was granted by the Springfield Committee for Research Involving Hu-man Subjects.
Methods
Patients having elective surgery at a Midwest-ern hospital who had certain specific characteristics were asked to volunteer. These characteristics in-cluded:
1. Being an inpatient older than 21 years of age.
2. Being on no medication that had a known or suspected effect on catecholamine levels.
4. Not being expected to go to an Intensive Care Area after leaving the post anesthesia room.
5. Having surgery scheduled between
0730-0830.
6. Having their surgeons' permission to vol-unteer.
Treatment of blood samples
The blood samples were collected three sep-arate times by a single quick intravenous puncture, and each time were placed immediately in ice. The samples were collected at the following times:
Journal of the American Association of Nurse Anesthetists
Table I
Measurements of catecholamines in picograms per milliliter in 40 patients for blood samples 1 and 2
Admission blood sample 1 Significant
Mean Median difference Range
Epinephrine 38.2 27.5 37.4 4-228 Norepinephrine 298.5 263 131.5 139-670 Catecholamines* 339 257 149.2 161-741
Premedication blood sample 2 Significant
Mean Median difference Range
Epinephrine 45.3 40.9 28.5 44-121 Norepinephrine 335.3 329.5 167 112-951 Catecholamines* 380.5 367 172 117-841
*Catecholamines are the sum of epinephrine and norepinephrine.
1. On admission to the hospital after the pa-tient had been supine for 20 minutes.
2. On admission to the preanesthesia room on the morning of surgery after the patient had been supine for 20 minutes and before preoperative medication was given.
3. Thirty minutes after the preoperative med-ication was given, when the patient had been su-pine for greater than 20 minutes.
If for any reason a sample was collected under unsatisfactory conditions, or treated in an unsatis-factory manner after collection, all were discarded and another patient was substituted.
The samples were collected in a 0-4°C test tube. Within 30 minutes they were centrifuged at -5 0
C. The plasma was aspirated from the cells and frozen at - 200C. The laboratory technologist ran these samples (all three samples per patient in the same batch) when she ran the samples for the
hospital (two times a month). She was unaware of any treatment or data on the patients. Note was made of the batch number and date of each pa-tient's samples.
The process used for the blood samples is that recommended in the Cat-A-Kit® (catecholamine ra-dioenzymatic assay test H3) as put out by Upjohn Diagnostics, Kalamazoo, Michigan. The radioactiv-ity of each extract is proportional to the amount of epinephrine and norepinephrine in the plasma.
The preoperative medications were ordered by the individual anesthesiologists at the hospital. Note was made of the preoperative medications given. Permission was not granted for a control group receiving no preoperative medication. How-ever, due to human error four patients received no preoperative medication between the second and third samples. This allowed for a control group that had all other variables except the medication.
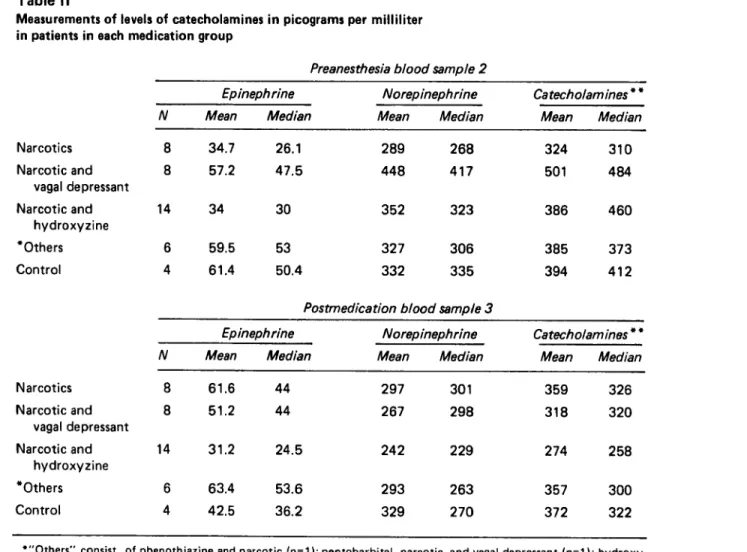
Table II
Measurements of levels of catecholamines in picograms per milliliter in patients in each medication group
Narcotics Narcotic and vagal depressant Narcotic and hydroxyzine *Others Control Narcotics Narcotic and vagal depressant Narcotic and hydroxyzine *Others Control
Preanesthesia blood sample 2
Epinephrine Norepinephrine Catecholam ines * *
N Mean Median Mean Median Mean Median
8 34.7 26.1 289 268 324 310
8 57.2 47.5 448 417 501 484
14 34 30 352 323 386 460
6 59.5 53 327 306 385 373
4 61.4 50.4 332 335 394 412
Postmedication blood sample 3
Epinephrine Norepinephrine Catecholamines * *
N Mean Median Mean Median Mean Median
61.6 44 51.2 44 14 31.2 24.5 6 63.4 53.6 4 42.5 36.2 297 267 242 293 329 301 298 229 263 270 359 326 318 320 274 258 357 300 372 322
*"Others" consist of phenothiazine and narcotic (n=1); pentobarbital, narcotic, and vagal depressant (n=1); hydroxy-zine, narcotic and vagal depressant (n=2); diazepam and vagal depressant (n=2).
Results
After a pilot study of 9 patients was per-formed, 40 patients had three blood samples col-lected successfully. They ranged in age from 24-74, with a mean age of 43.0 years. There were 19 males and 21 females. These forty patients had their epinephrine, norepinephrine and the sum of the two designated "catecholamines" measured. These levels in the first blood sample (taken with the ad-mission blood samples after the patient had been supine for 20 minutes) were compared with the levels in the second blood sample (taken in the preanesthesia room after the patient had been su-pine for 20 minutes and before a premedication was given). Using analysis of variance, analysis of
Table III
Duncan's multiple range test results of mean
epinephrine level differences between premedication blood sample 2 and postmedication blood sample 3
Mean
N difference
Narcotic 8 -26.87
Narcotic and vagal depressant 8 6.07 Narcotic and hydroxyzine 14 2.69
**Others 6 -3.92
Control 4 18.9
*The negative numbers mean that the catecholamine levels were greater in postmedication blood sample 3 than pre-anethesia blood sample 2.
**"Others" consist of phenothiazine and narcotic (n=1); pentobarbital, narcotic, and vagal depressant (n=1); hy-droxyzine, narcotic and vagal depressant (n=2); diazepam and vagal depressant (n=2).
covariance and the paired t test, no statistically sig-nificant difference at the 0.05 level was found. See Table I for values of epinephrine, norepinephrine
and their sum, "catecholamines."
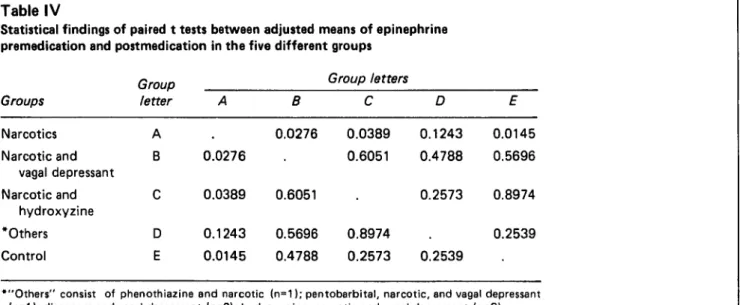
The 40 patients were divided by the researcher into five groups, four groups according to the medications they received preoperatively, and the fifth group consisting of those who received no medication. (Table II). Each of the five groups had the mean of these values in blood sample 2 and blood sample 3 compared by analysis of variance and analysis of covariance, with results that were not statistically significant. The Duncan's Multiple Range Test was used to compare all groups with one another. There was a statistically significant difference at the p-0.05 level between the epin-ephrine levels of the narcotics group and those of the control group (Table III). Note the greatest increase in epinephrine levels in the narcotics group and the greatest decrease in epinephrine levels in the control group. The adjusted means of all groups were compared to one another with the paired t test (Table IV). Note the narcotics group and control group are significantly different at the p=0.0145 level.
The same statistical methods were used to evaluate norepinephrine, the catecholamine that is the main response to physical stress. There were no statistically significant results. The same evalua-tion process was done for "catecholamines," the sum of epinephrine and norepinephrine, with the same results. Note in Table I the comparative lower values of epinephrine as compared to nore-pinephrine.
Journal of the American Association of Nurse Anesthetists Table IV
Statistical findings of paired t tests between adjusted means of epinephrine premedication and postmedication in the five different groups
Group Group letters
Groups letter A B C D E Narcotics A . 0.0276 0.0389 0.1243 0.0145 Narcotic and B 0.0276 . 0.6051 0.4788 0.5696 vagal depressant Narcotic and C 0.0389 0.6051 . 0.2573 0.8974 hydroxyzine *Others D 0.1243 0.5696 0.8974 . 0.2539 Control E 0.0145 0.4788 0.2573 0.2539
*"Others" consist of phenothiazine and narcotic (n=1); pentobarbital, narcotic, and vagal depressant (n=1); diazepam and vagal depressant (n=2); hydroxyzine, narcotic and vagal depressant (n=2).
Discussion
It would appear that a narcotic (morphine or meperidine) alone is a poor choice for a preopera-tive medication if decrease of emotional stress is the goal. The best treatment for emotional stress as measured by plasma epinephrine levels in these 40 patients was no preoperative medication and a 30-minute stay in a particular preanesthesia room.
These results suggest that the environment of a particular preanesthesia room can reduce stress better than either narcotics or tranquilizers in adult patients. Since vagal depressants (atropine and glycopyrrolate) can be given either preopera-tively or intravaneously in the operating room, the preoperative medication may not be needed at all. The findings were such in this research that per-mission should now be granted for further research
with a large control group. Conclusions
Narcotics alone do not appear to reduce plasma epinephrine levels, therefore they do not reduce emotional stress.11 The transquilizers re-duced epinephrine levels very minimally. The ab-sence of medication resulted in the greatest reduc-tion of stress. This research needs to be repeated with a larger control group with a researcher's in-put into the medications given.
REFERENCES
(1) Spielberger CD, Gorsuch RI and Robertson D. 1970. Man-ual for the Stait Trait Anxiety Inventory. Palo Alto, California: Palo Alto Publishing Co.
(2) Dimsdale JE, Moss JR. 1980. Plasma catecholamine in stress and exercise. JAMA 243 (4) :340-342.
(3) Gillman AC, Goodman A. 1980. The Pharmacological Basis of Therapeutics, 6th ed. New York: MacMillan Publishing Co., Inc., pp. 141-151.
(4) Guyton AC. 1981. Textbook of Medical Physiology, 6th ed. Philadelphia: W.B. Saunders Co., pp. 712-717, 298-304.
(5) Henry DP, et al. 1975. A sensitive radioenzyme assay for norepinephrine in tissue and plasma. Life Science 16:375-378.
(6) Kopin IJ, Lake RC and Ziegler M. 1978. Plasma levels of norepinephrine. Annals of Internal Medicine 88(5):61-680. (7) Bravo EL. 1982. The clinical value of plasma catechola-mine measurements. Laboratory Management 20 (6) :53-69. (8) Turton MB, Deegan T and Goulshod N. 1977. Plasma catecholamine levels and cardiac rhythm before and after cardiac catheterization. British Heart Journal. 39:1307-1311.
(9) Johnson M and Carpenter L. 1980. Preoperative anxiety. Psychological Medicine 10:361-367.
(10) Johnson M, Levanthall H and Dobbs JM. 1971. Contri-bution of emotional and instrumental response processes in adaptation to surgery. Journal of Personality and Social Psychol-ogy, 20(1) :55-64.
(11) Catchpole M. 1984. Evaluations of methods used to re-duce patient stress as measured by plasma catecholamine levels prior to surgery. U.S. Copyright Office. Library of Congress. Dissertation completed in partial fulfillment for the degree of Doctor of Philosophy. SIU Carbondale, March, 1983.
AUTHOR
Mattilou Catchpole, CRNA, PhD, received her nursing ed-ucation from Charity Hospital School of Nursing, New Orleans, Louisiana. She graduated from University Hospital's School of Anesthesia in Cleveland, Ohio and earned a BS and MS from Case Western Reserve in Cleveland. She earned a PhD from Southern Illinois University in Carbondale, Illinois. She is pres-ently an Associate Professor and Director of the Nurse Anesthe-sia Program for CRNAs seeking baccalaureate degrees at San-gamon State University, Springfield, Illinois.
ACKNOWLEDGEMENT
The author wishes to thank Dr. John Holland, Medical Director at St. John's Hospital, Springfield, Illinois for easing her way in the hospital while performing this research, and The Upjohn Company for supplying the Cat-A-Kits® needed for the research.