Abstract—This study investigates and identifies the assessment factors in software development project risk through literature reviews. Based on the identified assessment factors, a hierarchical structure of five dimensions and twenty-two factors is constructed, and two systematic approaches, fuzzy multiple criteria decision making (FMCDM) and consistent fuzzy preference relations (CFPR), were employed to assess the absolute and relative importance rates and then determine priorities of these factors. Among the identified dimensions, “Organization Function Risk” was considered as the most important dimension to influence the software development project performance.
Index Terms—Fuzzy multiple criteria decision making, fuzzy preference relations, risk assessment, software development project.
I. INTRODUCTION
With the rapid economic growth and innovation of information technology (IT), software developments and applications have been very important to enterprises’ operations. Software development project is a highly professional work, with complicated, professional, technical and other features. However, software development projects have a dismal track-record of cost and schedule overruns and quality and usability problems [1]. Most software development projects often used more resources than planned, took more time to be completed, delivered in less functionality and less quality than expected was pointed out [2]. Those problems were caused because software development process faces tons of uncertainties or risk factors. Therefore, an effective risk assessment model not only can be used to facilitate identifying and measuring critical risk factors, but also can help to achieve a software development project’s goals.
Risk-based project management has been a popular issue in many types of practical projects and associated academic studies. Because there are numerous software development risks, the proposed assessment procedure was designed using the multiple criteria decision making (MCDM) approach. Moreover, the risk associated evaluation is often determined by experts subjectively. Therefore, this study applies
Manuscript received April 9, 2012; revised June 1, 2012.
This work was supported in part by the National Science Council of Taiwan under Grant No. 100-2914-I-424-001-A1 and Kainan University.
Shih-Tong Lu is with the Graduate Institute of Project Management, Kainan University, 33857, Taoyuan, Taiwan and Department of Business Administration, National Central University, 32001, Taoyuan, Taiwan (e-mail: [email protected] and [email protected]).
Shih-Heng Yu is with the Department of Business Administration, National Central University, 32001, Taoyuan, Taiwan (e-mail: [email protected]).
FMCDM, proposed by [3], and consistent fuzzy preference relations (CFPR) approach, proposed by [4], to dealing with the absolute and relative level of importance of software development risk factors. The results assessed based on FMCDM and CFPR were compared and risk management strategies were proposed in advance of implementing a software development project.
II. RISK FACTORS IN SOFTWARE DEVELOPMENT
When software development projects were performed, many difficult problems will be encountered no matter executed by oneself or by outsourcing. To reduce project failure rate, various risk factors affecting project outcome should be identified by software engineering and information systems researchers. Risk assessment identifies sources of risk as they exist and emerge; that is, it identifies potential risk factors or risk items. Sources of risk in software development projects were investigated by several past attempts [5]–[9]. Frequently identified types of risk factors for software development projects, listed in Table I.
TABLEI:LIST OF RELATED REFERENCES REVIEWED FOR RISK FACTORS. Author(s) Risk factors
Boehm [5] 1.personnel shortfalls,
2.unrealistic schedules and budgets,
3.developing the wrong functions and properties, 4.developing the wrong user interface, 5.adding more functionality/features, 6.continuing stream of requirements changes, 7.shortfalls in externally furnished components, 8.shortfalls in externally performed tasks, 9.real-time performance shortfalls, 10.straining computer-science capabilities Lee [6] 1.personnel shortfalls, key person(s) quit,
2.requirement ambiguity,
3.developing the wrong software function, 4.developing the wrong user interface, 5.continuing stream requirement changes, 6.schedule not accurate,
7.budget not sufficient, 8.gold plating, 9.skill levels inadequate, 10.straining hardware, 11.straining software,
12.shortfalls in externally furnished components, 13.shortfalls in externally performed tasks, 14.real-time performance shortfalls Buyukozkan
and Ruan [7]
1.Product engineering risks:
requirements, design, code and unit test, integration and testing, engineering specialist.
2.Development environment risks:
include development process, development system, management process, management methods, work environment.
3.Program constraints related risks: resources, contract, program interfaces.
Risk Factors Assessment for Software Development
Project Based on Fuzzy Decision Making
TABLEI:LIST OF RELATED REFERENCES REVIEWED FOR RISK FACTORS (CONTINUE).
Author(s) Risk factors Jiang and
Klein [8]
1.technological acquisition, 2.project size,
3.lack of team’s general expertise, 4.lack of team’s expertise with the task, 5.lack of team’s development expertise, 6.lack of user support,
7.intensity of conflicts, 8.extent of changes brought, 9.resources insufficient,
10.lack of clarity of role definitions, 11.application complexity, 12.lack of user experience Houston,
Mackulak, and Collofello [9]
1.creeping user requirements, 2.lack of staff commitment, 3.low morale,
4.instability
5.lack of continuity in project staffing, 6.inaccurate cost estimation, 7.excessive schedule pressure,
8.lack of senior management commitment
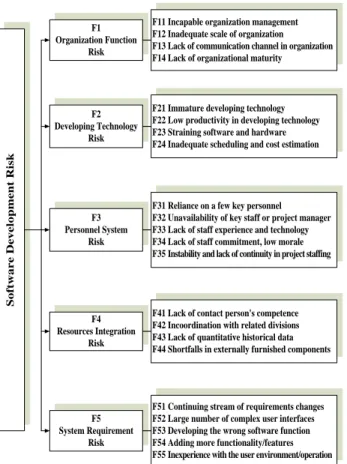
From these reviews of past literatures, the software development risk factors were further screened and synthesized for this study. Twenty two risk assessment factors divided into five dimensions were finalized. Five risk dimensions include organization function, developing technology, personnel system, resources integration, and system requirement. The hierarchical structure of risk factors is shown as Fig. 1. S o ft w a r e D e v e lo p m e n t R is k F1 Organization Function Risk F2 Developing Technology Risk F3 Personnel System Risk F4 Resources Integration Risk F5 System Requirement Risk
F11 Incapable organization management F12 Inadequate scale of organization F13 Lack of communication channel in organization F14 Lack of organizational maturity
F21 Immature developing technology F22 Low productivity in developing technology F23 Straining software and hardware F24 Inadequate scheduling and cost estimation
F31 Reliance on a few key personnel F32 Unavailability of key staff or project manager F33 Lack of staff experience and technology F34 Lack of staff commitment, low morale F35 Instability and lack of continuity in project staffing
F41 Lack of contact person's competence F42 Incoordination with related divisions F43 Lack of quantitative historical data F44 Shortfalls in externally furnished components
F51 Continuing stream of requirements changes F52 Large number of complex user interfaces F53 Developing the wrong software function F54 Adding more functionality/features F55 Inexperience with the user environment/operation
Fig. 1. Hierarchical structure of software development project risks.
III. RESEARCH METHOD
This study measures level of importance of risk factors using an integrated measure of magnitude of unintentional
events on project success. Assuming the different project risk factors equally affect project success is impractical. To better manage project risks and increase chances of project success, level of importance of risk factors on project success should be carefully evaluated and further used as the fundamental information for the control, response and management of project risks. That is, the varying effects of project risk factors on project success provide valuable information needed to allocate software development project resources.
Multiple criteria decision making (MCDM) was used to deal with the complexity and diversity of the analyses of multiple risk factors. When level of importance of risk factors was evaluated, most decision-makers or project managers were accustomed to measure those factors as linguistic values, e.g., very high, high, fair, low, very low for a subjective judgment. Therefore, FMCDM was applied to the analysis of this study [3]. FMCDM approach in this study was used to determine the absolute level of importance of risk factors by concept of simple additive weight (SAW). This study adopted CFPR [4] to determine the relative grade of importance of risk factors by concept of preference relations. Some concepts and operations of FMCDM and CFPR used in this study are briefly described as the followings.
A. FMCDM
1) Linguistic Variables:
Zadeh [10] mentioned that as it is difficult to have a logic expression in a fuzzy or vagueness environment by using a conventional quantifying approach. A linguistic variable essentially represents the variable using a word or a sentence in human languages. This study employed the seven semantic scales, revised from [3], to assess level of importance for software development project and their corresponding triangular fuzzy numbers (TFN) are listed in Table II.
TABLEII:FUZZY LINGUISTIC ASSESSMENT VARIABLES. Semantic Scale Corresponding TFN Absolutely high (AH) (0.9, 1.0, 1.0)
Very high (VH) (0.7, 0.9, 1.0)
High (H) (0.5, 0.7, 0.9)
Fair (F) (0.3, 0.5, 0.7)
Low (L) (0.1, 0.3, 0.5)
Very low (VL) (0.0, 0.1, 0.3)
Absolutely low (AL) (0.0, 0.0, 0.1)
2) The Matrix of Level of Importance:
The matrixXfor the level of importance of each of the risk factors (F jj, 1, 2, ..., )n was displayed as (1). The evaluators (E ii, 1, 2, ..., )m input their subjective judgments of the level of importance for each risk factor by using the semantic variable listed in Table II.
1 2 3 1 2 3 1 1 1 1 1 1 2 3 2 2 2 2 2 1 2 3 3 3 3 3 3 1 2 3 1, 2, 3, , , 1, 2, 3, , m m m m m n n n n n E E E E x x x x F F x x x x i m X F x x x x j n F x x x x (1)
where m denotes the number of evaluators, and n is the number of risk factors, andxij (Lx Mx Uxij, ij, ij)indicates the fuzzy level of importance assessed by the ith evaluator for the jth risk factor.
3) The Synthesized Level of Importance of Factors: Each of the evaluators independently performed his/her assessments based on his/her experience, intuition and knowledge. An average score computation, displayed as (2). , is then employed to synthesize the TFNs of m evaluators, which explored a synthesized fuzzy level of importance value for each of the risk factors.
1 1 m i j j i w x m (2)
wherewj(Lw Mw Uwj, j, j)represents the synthesized fuzzy level of importance of the jth risk factor.
4) The Defuzzification:
The synthesized results of the fuzzy risk assessment are still in fuzzy numbers format. Therefore, it is necessary to further conduct defuzzification approach to transfer fuzzy numbers to crisp numbers. The aggregated triangular fuzzy numbers ( wj ) was then defuzzified to best non-fuzzy performance (BNP) values (Wj), which is displayed as (3).
[( ) ( )] 3 j j j j j j Uw Lw Mw Lw W +Lw
where Wj is the grade of importance of the jth risk factor in crisp numbers format. Finally, the normalized grade of importance of the jth risk factor was computed according to (4). n1 j j j j R W W 1 1 n j j R = B. CFPR
Another approach used in this study would like to assess the relative importance of risk factors of software development project for enterprises. Thus, this study further applies the consistent fuzzy preference relations (CFPR) approach, proposed by Herrera-Viedma et al.[4], for constructing the decision matrices of pairwise comparisons based on additive transitivity property. The CFPR not only enables a decision-maker to give values for a set of factors with the least judgments, but also avoids checking the consistency in decision-making process. The following provides a brief introduction on the definitions and steps of the proposed method.
1) Multiplicative Preference Relations:
Matrix AXX shows the multiplicative preference relations of X factor centers on A, whereA[aij], aij is the preference intensity ratio of factor xi to factor xj.Saaty [11] suggested aij to be scaled from 1 to 9. Herein,
1 ij
a represents the existence of indifference between
criterion xi and xj, aij 9 manifests that xi is absolutely important than xj. In this case, the preference relation is typically assumed to be a multiplicative reciprocal:
1 , {1, , }
ij ji
a a i j n (5) 2) Fuzzy Preference Relations:
The fuzzy preference relation Pon a set offactors X is a fuzzy set of the product XXwith membership function
: [0,1]
p X X
. The preference relation is represented by the matrixP[pij], wherepij p( ,x xi j). Herein, pijis interpreted as the grade of importance ratio of criterion xi over xj. If pij 1 2, it means that xi and xj are equally important (i.e.xi xj); pij 1 indicates thatxi is absolutely important to xj; pij 1 2 shows that xi is more important to xj, i.e. xi xj. In this case, the preference matrix, P, is usually assumed additive reciprocal, i.e.
1, , {1, , }
ij ji
p p i j n (6) 3) Consistent Fuzzy Preference Relations:
A set of factors x{ ,x1 ,xn} and xX is associated with a reciprocal multiplicative preference relations
[aij]
A for aij[1 9,9]. Then aij can use (7) to obtain the corresponding reciprocal fuzzy preference relation P[pij] for pij[0,1] associated with A:
9 1 ( ) (1 log ) 2 ij ij ij p g a a (7) Herein, log9aij is considered because aij is between
1 9 and 9. When the reciprocal fuzzy preference relation [pij]
P is additive consistency, there exist the relationships as (8) and (9): 3 2 ij jk ki p p p i j k (8) ( 1) ( 1)( 2) ( 1) ( 1) 2, i i i i j j ji p p p p j i i j (9)
4) The Relative Level of Importance of Factors:
When we obtain the n1 preference intensity ratio 12 23 1,
{a ,a , ,an n} of factors x{ ,x1 ,xn|n2} from experts’ judgments, (7) can be used to construct a fuzzy preference relation for the set of n–1 values {p12,p23, ,pn1,n} . Then the other preference relations values of the decision matrix P,
12 23 1, { ij| ij { , , , n n}} i j p p p p p B , will be obtained by
the (6), (8) and (9). However, after this calculation, all the necessary elements in the decision matrix P may really not all lie within [0, 1] but will lie within [a,1a] , where
12 23 1
min{ { , , , n n}}
a B p p p . Therefore, it can be obtained the consistent reciprocal fuzzy preference relation matrix P' by the transformation function P' f p( ). This process can make the decision matrix maintaining reciprocity and additive consistency. The transformation function is as following:
: [ ,1 ] [0,1], ( ) ( ) (1 2 )
f a a f x xa a (10) The obtained assessment decision matrix, P'(pij) , shows the consistent reciprocal relation. It can apply the equation (11) to determine the corresponding relative grade of importance for each factor:
1 , 1 n n n i i i ij i i i A p w A A (11) Finally, this assessment results can be used to determine the priority of risk factors for software development projects. In addition, decision makers can use the results to draw up appropriate risk management strategies to treat to the significant risk factors which were ranked top priority.
IV. CASE RESULTS
Five experts with many years’ experience on information management division of medium scale technology enterprise were invited to provide response to the questionnaire survey. They were asked to provide the inputs of absolute importance of each risk factor and relative importance of pair risk factors which identified in this study on software development projects. Table III shows the grade of importance and ranking of risk dimensions and factors by FMCDM approach. Then, Table IV shows the same contents, but the results were computed by CFPR approach.
Among the identified five dimensions, “Organization Function Risk” was found as the most important risk dimension to influence the software development performance and success no matter evaluated by CFPR or FMCDM. “Developing Technology Risk” and “Resources Integration Risk” are respectively the second and third important dimensions to affect software development project performance when evaluated by CFPR, but the third and second when evaluated by FMCDM. “Personnel System Risk” and “System Requirement Risk” are the last two dimensions in sequence on absolute and relative importance affecting performance and success of development project.
TABLEIII:IMPORTANT AND RANKING OF RISK FACTORS BY FMCDM. Dimensions /factors Local weights Ranks Global weights Ranks F1 0.223 1 F11 0.3028 1 0.0677 1 F12 0.2068 4 0.0462 12 F13 0.2580 2 0.0577 4 F14 0.2324 3 0.0519 8 F2 0.207 3 F21 0.2793 1 0.0579 2 F22 0.2196 4 0.0455 13 F23 0.2345 3 0.0486 10 F24 0.2665 2 0.0553 5 F3 0.166 5 F31 0.1669 5 0.0276 22 F32 0.2298 1 0.0380 15 F33 0.1785 4 0.0296 21 F34 0.2264 2 0.0375 16 F35 0.1983 3 0.0328 18 F4 0.214 2 F41 0.2525 2 0.0540 6 F42 0.2707 1 0.0579 3 F43 0.2465 3 0.0527 7 F44 0.2303 4 0.0492 9 F5 0.190 4 F51 0.2514 1 0.0477 11 F52 0.1839 3 0.0349 17 F53 0.2214 2 0.0420 14 F54 0.1726 4 0.0327 19 F55 0.1707 5 0.0324 20
TABLEIV:IMPORTANT AND RANKING OF RISK FACTORS BY CFPR. Dimensions /factors Local weights Ranks Global weights Ranks F1 0.255 1 F11 0.3562 1 0.0907 2 F12 0.1730 3 0.0440 10 F13 0.3024 2 0.0770 3 F14 0.1684 4 0.0429 12 F2 0.244 2 F21 0.3782 1 0.0924 1 F22 0.1843 3 0.0450 9 F23 0.1343 4 0.0328 17 F24 0.3032 2 0.0741 4 F3 0.169 4 F31 0.1051 5 0.0177 21 F32 0.2482 2 0.0419 13 F33 0.1499 4 0.0253 19 F34 0.2684 1 0.0453 8 F35 0.2284 3 0.0385 14 F4 0.181 3 F41 0.2406 3 0.0436 11 F42 0.3022 1 0.0548 6 F43 0.2691 2 0.0488 7 F44 0.1882 4 0.0341 16 F5 0.151 5 F51 0.3743 1 0.0566 5 F52 0.1991 3 0.0301 18 F53 0.2410 2 0.0364 15 F54 0.1205 4 0.0182 20 F55 0.0651 5 0.0098 22
For each dimension, among the first dimension (F1), incapable organization management (F11) was both considered as the most important risk factor by using the proposed two approaches, and it is also the most important factor for global aspect by FMCDM. Among the second, fourth and fifth dimension (i.e. F2, F4 and F5), immature developing technology (F21), in-coordination with related divisions (F42) and continuing stream of requirements changes (F51) were all found as the most important risk factors to influence the software development project success when evaluated by the two approaches. Unavailability of key staff or project manager (F32) and lack of staff commitment, low morale (F34) respectively is the most important risk factor to harm software development project success when evaluated by the proposed two approaches.
For global aspect, the ranking of lack of communication channel in organization (F13) and inadequate scheduling and cost estimation (F24) are very close and more important among other factors when evaluated by the two approaches. Furthermore, reliance on a few key personnel (F31), lack of staff experience and technology (F33), adding more
functionality/features (F54) and inexperience with the user environment/operation (F55) are more and less important factors among other factors when evaluated by the two approaches.
V. CONCLUSION
Risk is an inherent component of software development projects. However, more preparation in advance will be less loss on operation. Thus, in this study, five risk dimensions and associated twenty-two risk factors were investigated. It can help the project managers to overview the global picture of risk. Then, we adopt two simple and systemic models to assess project risks for a software development. The questionnaires making and computation processes are easy to conduct whatever approach was used. The case results by FMCDM and by CFPR are similar in more important factors. It implied that the grade of importance of risk dimensions or factors are close whatever intuitional judgments by FMCDM and comparative judgments by CFPR.
Based on the results investigated following the built models to perform the risk management or plan response strategies for software development projects. These models can benefit the stakeholders of software development project to recognize what risk factors they face and to facilitate risk assessment and furthermore complete project risk management plan to allocate resources adequately.
REFERENCES
[1] Y. H. Kwak and J. Stoddard, “Project risk management: lessons learned from software development environment,” The Journal of Technovation, vol. 24, no. 11, pp. 915-920, November 2004. [2] M. O. Barros, C. M. L. Werner, and G. H. Travassos, “Supporting risks
in software project management,” Journal of Systems and Software, vol. 70, no. 1–2, pp. 21-35, February 2004.
[3] T. H .Chang and T. C. Wang, “Using the fuzzy multi-criteria decision making approach for measuring the possibility of successful knowledge management,” Information Sciences, vol. 179, no. 4, pp. 355-370, February 2009.
[4] E. Herrera-Viedma, F. Herrera, F. Chiclana, and M. Luque, “Some issues on consistency of fuzzy preference relations,” European Journal of Operational Research, vol. 154, no. 1, pp. 98-109, April 2004. [5] B. W. Boehm, “Software risk management principles and practices,”
IEEE Software, vol. 8, no. 1, pp. 32-41, January 1991.
[6] H.-M. Lee, “Generalization of the group decision making using fuzzy sets theory for evaluating the rate of aggregative risk in software development,” Information Sciences, vol. 113, no. 3-4, pp. 301-311, February 1999,.
[7] G. Buyukozkan and D. Ruan, “Choquet integral based aggregation approach to software development risk assessment,” Information Sciences, vol. 180, no. 3, pp. 441-451, February 2010.
[8] J. Jiang and G. klein, “Software development risks to project effectiveness,” The Journal of Systems and Software, vol. 52, no. 1, pp. 3-10, May 2000.
[9] D. X. Houston, G. T. Mackulak, and J. S. Collofello, “Stochastic simulation of risk factor potential effects for software development risk management,” The Journal of Systems and Software, vol. 59, no. 3, pp. 247-257, December 2001.
[10] L. A. Zadeh, “The concept of linguistic variable and its application to approximate reasoning - Ι,” Information Sciences, vol. 8, no. 3, pp. 199-249, April 1975.
[11] T. L. Saaty, “A Scaling Method for Priorities in Hierarchical Structures,” Journal of Mathematical Psychology, vol. 15, no. 3, pp. 234-28, June 1997.
Shih-Tong Lu received his B.S. and M.S. degree in
economics in 1991 and 1994 from the National Chung Hsing University, Taiwan, and his Ph.D. degree in construction management in 2004 from National Central University, Taiwan. He is now an Associate Professor in Graduate Institute of Project Management at Kainan University and Adjunct Associate Professor in Department of Business Administration at National Central University, Taiwan. He specializes in project and risk management. Previously he served as an auditing officer in the Taipei Division, National Audit Office. He has acquired more than two decades of experience in the private and public sectors in the financial and construction industry and five years’ experience in the property management industry. His teaching and research interests include project risk management, quantitative methods for business operations, multiple criteria decision analysis, and quality management.
Shih-Heng Yu received his B.S. degree in risk
management from Kainan University in 2010, and his M.S. in Civil and Disaster Prevention Engineering from National Taipei University of Technology, Taiwan in 2012. He is now a Ph.D. student at Department of Business Administration, National Central University, Taiwan. His recent research interests include performance evaluation, risk management of technology firms, sustainability management and green strategy.