University of Wollongong
Research Online
Deputy Vice-Chancellor (Education) - Papers
Deputy Vice-Chancellor (Education)
1996
Using statistics for database management in an
academic library
P. Hyland
Lynne Wright
University of WollongongResearch Online is the open access institutional repository for the University of Wollongong. For further information contact the UOW
Publication Details
This article was originally published as Hyland, P and Wright, L, Using statistics for database management in an academic library', Australian Academic and Research Libraries, 27(3), September 1996, 169-81.
Abstract
The collection of statistical data about the usage of databases by library patrons is an important task for librarians. It is necessary for a variety of reasons, including the provision of appropriate access points, the minimisation of costs associated with database licences and the diagnosis of strengths and weaknesses in the training programs provided for the patrons of the library. The collection of these statistics is cumbersome, unless it can be automated as part of the process of accessing the databases. This paper presents a critical appraisal of the development, implementation and evaluation of an automated statistics gathering system at the University of Wollongong Library for the CD-ROM database collection. The authors describe the background to the study and explain the ways in which the use of statistical data can improve the day-to-day management of CD-ROM and database facilities, collection development of CD-ROM databases, and the influence on training and directions given to users in regard to their use. The importance of a long term plan for data collection and the need for informed, practical analysis are also discussed.
Disciplines
Arts and Humanities | Social and Behavioral Sciences Publication Details
This article was originally published as Hyland, P and Wright, L, Using statistics for database management in an academic library', Australian Academic and Research Libraries, 27(3), September 1996, 169-81.
The NationalUbrarysupplies copies of this
article under licence from the Copyright Agency Limited (CAL). Further reproductions
of this article can onlybemade under licence.
II
m
I \111 \Inll \11111
980201207
Using Statistics for Database Management in
an Academic Library
PETER HYLAND LYNNE WRIGHT
Lecturer in Business Systems, University of Wollongong Wollongong University
Library
ABSTRA CT The collection of statistical data about the usage of databases by library
patrons is an important task for librarians. It is necessary for a variety of reasons, including the provision of appropriate access points, the minimisation of costs associated
with database licences and the diagnosis of strengths and weaknesses in the training programs provided for the patrons of the library. The collection of these statistics is
cumbersome, unless it can be automated as part of the process of accessing the databases. This paper presents a critical appraisal of the development, implementation and evaluation of an automated statistics gathering system at the University of Wollongong Library for the CD-ROM database collection. The authors describe the background to the study and explain the ways in which the use of statistical data can improve the day-to-day management of CD-ROM and database facilities, collection development of CD-ROM databases, and the influence on training and directions given to users in regard to their use. The importance of a long term plan for data collection and the need for informed, practical analysis are also discussed.
The rapid rate at which libraries have adopted CD-ROM and online databases has created two primary challenges for librarians-how to keep up-to-date with technological developments, and how to manage those technologies effectively at a local level. The first of these has been addressed elsewhere'. This paper will provide one approach to the second issue-the management of database use, at a local level, with the aid of statistical data. The collection of statistical data about the usage of databases is a consequential task for library managers, for a number of reasons including the provision of adequate resources, the minimisation of costs associated with database licences and the diagnosis of strengths and weaknesses in the training methods provided for database users. The collection of these statistics is often a time-consuming task unless it can be automated as part of the process of accessing the databases This paper presents two approaches to the collection of data about database usage which the authors will refer to as intrusive and non-intrusive methods. Particular reference is made to the management of the databases based on the analysis of the data gathered by the two approaches in this study.
Approaches to Data Collection There are a variety of methods, both manual and automated, by which data about database use can be collected. However, these methods have focussed primarily on the collection of data about the number of database logons and have not attempted to gather data about the users themselves. While these systems are valuable tools in managing database access, the lack of user data severely limits their usefulness. In setting up the system described in this paper, it was decided to gather data about the users themselves. Due to the time required of both staff and patrons in manual methods, it was decided to use only automated data collection. When
employing automated data collection, there are two basic approaches which we will call intrusive and non-intrusive. In a non-intrusive approach, the user is only asked to provide information necessary for the selection and operation of a chosen database. Any data collection that takes place is done without the need for user interaction. A number of systems! have been developed that employ non-intrusive data collection by taking advantage of the logon procedures inherent in database use.
In an intrusive approach, the user is required to answer one or more questions either before, after, or both before and after the database search session. There are obvious concerns for librarians about the use of such a system as it may prove to be a nuisance for patrons. In our case study, patrons were able to answer the intrusive questions in an average time of 33 seconds. Compared to an average search session of over 20 minutes, this is quite a reasonable overhead. The automated questioning actually allows experienced users to record their responses much faster than they could by answering verbal questions. While even this may be seen as an imposition, patrons do not seem to be overly concerned. The willingness of patrons to provide statistical data is reflected in the 10% to 15% of patrons who voluntarily answer four additional questions.
Both the intrusive and non-intrusive approaches are used in the software described in this paper. While this combination has been employed elsewhere3, it has not always
been clear how the statistics collected have been used in terms of managing database access. This paper describes not only the collection process, but the uses to which the statistics have been put and the changes resulting from their use. The software described in this paper, CD QUEST, has been collaboratively designed and developed by library and computing staff at the University of Wollongong, a medium-sized, Australian university with approximately 11 000 students.
Access through the library to both CD-ROM and online databases is provided primarily via a local area network. This means that the methods of data collection described in this paper are equally appropriate for both CD-ROM and online databases. The introduction of new access points via a campus-wide network has created a number of technical problems that are, as yet, unresolved4• These problems
are associated with the diversity of operating systems now in use rather than the differences between online and CD-ROM databases. Consequently, we use the term database to refer to either CD-ROM or online databases.
Like many university libraries, Wollongong is rationalising the cost of print versus electronic formats of information. Costs must be considered in terms of dollars as well as space, processing, storage and so on. The method of data collection used should ensure that reliable data is available to support informed decisions on some or all of these issues.
RESOURCE ALLOCATION BASED ON DATA COLLECTED NON-INTRUSIVELY
The non-intrusive approach to data collection is able to provide far more data than might at first be thought. It is a simple matter to gather at least five pieces of highly significant data, without intruding on the user. These are the title of the database, the start and stop time of 'a session, and the day and the date on which the session took place.
Hyland and Wright:Using Statistics jor Database Management in an Academic Library
Overall Usage of Databases One of the most valuable applications of data gathered non-intrusively is for the management of library resources. It is necessary for library managers to constantly evaluate and report on database usage as part of an ongoing collection management plan. By using only the five pieces of data described above it is possible to produce a number of informative reports that assist in the evaluation and reporting processes.
The first of these is a simple record of the number of database sessions conducted in any given reporting period. In our case study, the reporting period chosen was one month. Figures for the total number of logins are given in Table 1. (Here, as elsewhere in the paper, the values for every second month throughout a One year period are shown. Figures for the alternate months are also available but have been omitted for the sake of brevity.) Such figures can be used to demonstrate the extent to which databases are being utilised and the need for continued support by funding bodies.
Table 1. Total Number of Logins
March May July Sept Nov Jan
Logins 9214 7926 2951 4625 1658 ·1219
The recording of start and stop times for each session also allows us to calculate the total time used in search sessions and to analyse the .rate at which sessions occur throughout the day. Table 2 shows the pattern of usage in two hourly intervals for March 1995. March has been selected as it had the highest number of logins in Table
1.
Table 2. Number of Sessions in March
<8am 8-10 10~12 12-2 2-4 4-6 6-8 8-10 >lOpm
Sessions 89 546 1503 1830 2053 1517 1010 617 49
Decisions about the balance between the number of computers available and the opening hours of the database rooms can only be made properly with the aid of such time distribution figures. These data can also be used to make informed decisions about the most appropriate time to hold database instruction classes. For example, instruction classes held early in the morning would have far less impact on the availability of computers than would those held around noon. Historically, training classes have been held at the busiest times of the day and have resulted in patrons being unable to access facilities for the duration of the training classes. As a result of our statistical analysis it has been decided to reschedule the formal training classes. In addition, it has been decided to make patrons aware that a librarian will be present in the CD-ROM room at peak times to answer ad hoc questions and to assist users.
While Table 2 only shows the start time for sessions, using both start and stop times we can calculate the length of individual sessions which can be used to calculate an average value. Table 3 shows the average duration for each month from March to January.
Table 3. Average Session in Minutes
March May July Sept Nov Jan
Minutes 22 22 26 24 35 39
While these average figures do not give a complete picture, they have had an immediate impact on the management of the resources. At present, two-thirds of the database computers can be pre-booked for one hour time slots and the remaining third are available for either short or long ad hoc sessions, Given the apparently short
duration of searches, it would seem that the one hour booking may be
counterproductive. We have observed that the booked computers are often unattended, presumably because prospective users know that they are booked. Unfortunately, the figures in Table 3 suggest that the booked user has probably finished in the first half hour and gone away. Thus a valuable resource goes unused. We are currently considering changing the number of computers that can be booked for a full hour.
In addition to average durations, the data collection system can also calculate the duration of individual sessions and present them in the form of a distribution showing the number of sessions by duration, grouped into 15 minute intervals. The number of long searches in Table 4 might suggest that there is a need for two different booking systems, one for users who expect to make quick searches and another for users who require access for longer periods. However, two observations must be made. Firstly, the sessions not currently satisfied by the one hour booking scheme account for only 5% of total searches. Secondly, many of these long searches are probably searches that have not been completed properly, eg where users have left the computer without logging out. If this is the case, the percentage of valid long searches is probably significantly lower.
Table 4. Search Duration in March
<2 2-4 5-14 15-29 30-44 45-59 60-74 75-89 90+ N/A
No of
Searches 1223 1535 1862 1438 755 420 209 91 200 1470
A closer look at the short sessions was prompted by librarians who were not convinced that the duration ofcomplet~dsessions was actually as short as indicated. An analysis of the user's intended query revealed that a significant number of identical searches were being carried out on the same database. This is not unusual in itself but the pattern of start and stop times associated with these repeated searches was unexpected. It was noted that one of these repeated searches would often start within a minute of the previous one ending. The chances of different users repeatedly starting identical searches within one minute of the previous one ending is so small that we looked for another explanation. Itappears that the repeated searches are being carried out by the
same user. , '
This would seem to be a most inefficient process. However, the user has not accessed the same database but a different edition (year) of the same database. Unfortunately, the user was unaware that, in order to move from one edition to another
Hyland and Wright: Using Statistics for Database Management in an Academic Library
it isnotnecessary to terminate the search software when the database has an exchange option (and the required edition is available on the network). The high incidence of these fragmented searches suggests that this is a common misunderstanding among users. The discovery of this problem through our statistical analysis will have a major effect on our system documentation and training programs.
Table 5. Search Sessions by Day of Week
Man Tues Wed Thurs Fri Sat Sun
No of Sessions, April 1158 1288 1501 1245 900 615 369
Opening hrs per day 13 13 13 11 13 8 4
Sessions per opening hour 89 99 115 113 69 76 92
Table 5 shows the number of sessions by day of the week which, as was expected, varies markedly from one day to the next. To begin with, the number of sessions on the weekends is significantly lower than on weekdays. This trend was expected as opening hours on weekends are shorter. This means that any comparison between the raw usage figures on weekends and weekdays is misleading. A valid comparison is provided by the number of sessions per opening hour, shown in the third row. The need for this comparison is clear when we look at the raw and adjusted figures for Monday and Sunday. While the raw usage figure for Monday is nearly three times as high as for Sunday, the number of sessions per hour on Monday is "actually less than on Sunday. This high level of relative usage confirms the viability of providing database access on weekends, despite the apparently low raw usage figures.
The variations on weekdays were less expected, particularly the low figure for Friday. Identification of this natural low point in the pattern of usage has supported decisions about database access. Firstly, Friday would be an ideal time to carry out routine maintenance rather than on Thursday as is the current practice. Secondly, it was observed that the number of inquiries at the library information desk was significantly lower on Fridays than on other weekdays. The information desk is located nearby the database room and a high proportion of inquiries relate to the use of the computers. Having demonstrated the relationship between the low number of inquiries and the usage of the database access room, it has been decided to reduce the staffing of the information desk on Fridays.
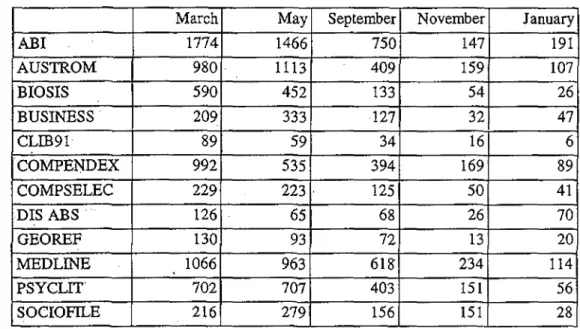
Usage of Specific Databases The usage of individual databases is an important statistic to gather, for three main reasons. Firstly, there is an ongoing cost associated with the provision of a particular database which will vary enormously according to the licensing agreement. Secondly, there are hidden ongoing costs associated with every database such as the time required by technical support staff to install and maintain it, the cost of upgrades and so on. Thirdly, when using a local area database network, there may be limited space to store all the databases and decisions must be made as to the priority of databases to be networkeds. Consequently, it is important to have an accurate picture of the usage of individual databases, both those that are already part of the collection and those being considered for inclusion and undergoing a six or 12 month trial period.
Simple frequency distributions of the number of sessions for each database can easily be produced. These will give a reasonable indication of usage. In the case study we found that the usage of most databases was consistent with expectations. However, it must be taken into account that some databases, such as Compendex, BIOSIS, Medline and Computer Select, consist of multiple discs each covering a different period. Therefore the true usage of such collection must be evaluated differently from a one disc database.
Table 7. Usage of Individual Databases
March May September November January
ABI 1774 1466 750 147 191 AUSTROM 980
1113
409 159 107 BIOSIS 590 452 133 54 26 BUSINESS 209 333 127 32 47 CLffi91 89 59 34 16 6 COMPEl'rDEX 992 535 394 169 89 COMPSELEC 229 223 . 125 50 41 DIS ABS 126 65 68 26 70 GEOREF 130 93 72 13 20 MEDLINE 1066 963 618" 234 114 PSYCLIT 702 707 403 151 56 SOCIOFILE 216 279 156 15128
Itshould be remembered, however, that monitoring of these figures must be a long term process. Some databases may go unused for months, only to become the most popular title at a particular time of the year. Decisions to remove a database from use should take this peak usage into account. Table 7 shows a significant change in the utilisation of certain databases in consecutive months. While the overall utilisation of the databases has dropped over the 12 months, some databases show changes that differ markedly with the general trend. MEDLINE and PSYCLIT have maintained a significant proportion of usage throughout the whole of the 12 month period. AUSTROM and SOCroFILE both showed significant increases in May while most other databases declined in use.
In considering such figures the need for critical analysis and the importance of local knowledge cannot be underestimated. This can be clearly demonstrated by looking at the figures in Table 7 for COMPENDEX. While the drop in usage is alarming, it is not a result of dissatisfaction with the database. Instead, it has been caused by the unusually heavy use of COMPENDEX in March by fourth year engineering students who are required to carry out a compulsory literature search during that month. The figures for April are only down in relation to that atypical high.
Although it is important to monitor the usage of the particular databases, the type of usage is equally important. For example, a particular title may not be used frequently
Hyland and Wright: Using Statistics for Database Managemellf ill all Academic Library
but may be the only title that is used by a particular type of user, and may not be available in any other format in the library. A good example of this is the Dissertations Abstract database (DIS ABS), which shows significantly less usage than most of the other databases but is unique in its content. These special types of usage and circumstances should be taken into account when deciding on the provision of particular databases. Note also that DIS ABS has a very high level of usage in January compared to any other database. Possibly this is caused by its use by postgraduates and academics during semester breaks.
The provision of statistical information about such types of usage requires us to collect data about the type of client using the databases. It should be pointed out that all of the statistics needed to support the analyses described above can be gathered non-intrusively, ie the user would neither be aware of nor be inconvenienced by the collection of data. In view of the ease with which such data can be collected and the absence of any negative factors, such· routine data collection should be considered the bare minimum required for effective database management.
STATISTICS BASED ON USER TYPES
As part of the case study, it was decided to collect information about the types of patrons using the databases in the library. The data that were actually collected pertain only to a subset of possible characteristics. Details of the selection process and the long term strategy behind the case study are given elsewhere6• Those characteristics
chosen for inclusion were considered the most appropriate to allow us to identify particular needs within the patron population.
The decision to collect data about patron characteristics means that patrons themselves must provide these data. Patrons were required to answer a maximum of eight questions relating to the following:
• their origin (a visitor to the university or a member of the university eg staff/student)
• the faculty to which the patron belonged
• the purpose for which the patron was searching the database
• the degree level, in the case of students (undergraduate or postgraduate)
• the type of degree (for postgraduates) or the year of progress (for undergraduates)
• the query they would enter when they eventually gained access to the database. Based on the data acquired, a number of important management questions can be addressed. The first might be the provision of database access for visitors. Table 8 presents the number of logins by university members and visitors over a year. The high proportion of visitor sessions may make it difficult to provide a satisfactory level of access for university patrons.
These figures could be used to support two courses of action. Firstly, access to visitor patrons could be restricted. Within the Australian university system, one in which community and reciprocal access is seen as highly desirable, this would not be acceptable. Secondly, librarians could use this to justify the need for increased resources to provide for both patron groups. Administrators are often unaware of the
extent to which these external factors impact upon the availability of library resources, and figures like those in Table.8 are therefore invaluable.
Table 8. Patron Origin
March May July Sept Nov Jan
Member No. 7741 7135 2682 4260 1373 1079
% 84% 90% 90% 92% 83% 89%
Visitor No. 1473 791 269 365 285 140
% 16% 10% 10% 8% 17% 11%
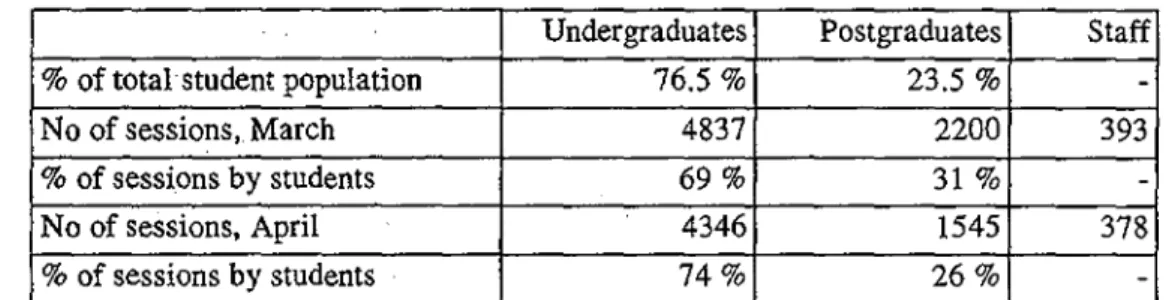
The user data collected by our system enables us to distinguish between search sessions conducted by undergraduates, postgraduates or staff. Being able to make this distinction has been immediately useful. Firstly, as can be seen in Table 9, there are significantly more sessions conducted by students than by staff members.
Table 9. Staff and Student Use
Undergraduates Postgraduates Staff
% of total student population 76.5 % 23.5 %
-No of sessions, March 4837 2200 393
%of sessions by students 69% 31 %
-No of sessions, April 4346 1545 378
% of sessions by students 74% 26%
-This is an interesting observation, given that there is an apparently strong demand from staff to make access to the databases available via the campus-wide network. With the current level of use, it would not appear that this is warranted. However, it could be argued that staff do not use the facilities because they are not readily available. Then again, the low level of usage for March and April may be associated with the return to teaching after the summer recess, when academics are less likely to be involved in research activity. It will be interesting to compare the pattern of staff usage now that the databases are available on the campus-wide network.
We see that in March there is a slightly higher level of usage by postgraduates than by undergraduates compared to their proportion in the student population, while in April, the pattern of usage is more in keeping with the percentage. This is to be expected, given the likelihood that postgraduate students may be more familiar with databases than new undergraduates. It will be interesting to view the pattern of usage by these groups over a longer time scale.
Having collected data about both the type of patron and the duration of sessions, it is possible to produce a variety of cross tabulations. Table 10 shows a cross tabulation of session length by type of student enrolment.
This was a matter of some interest as it had been thought that postgraduate students might be responsible for a greater proportion of the long duration sessions. This is not
Hyland and Wright:Using Statistics for Database Management in an Academic Library
the case. Because there is a marked difference in the total number of sessions conducted by each group, the sessions have been converted into percentages.
Table 10. Percentage of Sessions by Undergraduates or Postgraduates
<2 2-5 5-15 15-30 30-45 45-60 60-75 75-90 More N/A
Undergrads 5.9 18.3 23.2 17 8.5 5.2 2.6 1.4 2'.2 15.5
Postgrads 5.5 16 20.9 18.7 8.7 5.8 3.0 1.4 2.7 17.3
The most striking thing about these figures is that they are so consistent across both groups. The percentage figures for very short sessions (0-15 minutes) are slightly higher for undergraduates, and sessions longer than 15 minutes are slightly higher for postgraduates. We carried out further analysis of our data to see if any trends were visible for'subgroups within the two groups. Were there any patterns of search duration by year level for undergraduates or for course type by postgraduates? Once again, the subgroups were remarkably consistent. When faced with such consistent figures, one might easily conclude that since the figures do not reveal a striking difference between postgraduates and undergraduates, they are not of much use. From a management point of view, however, these figures are just as useful as more dramatically different patterns of usage. They suggest that there is no need to discriminate between undergraduates and postgraduates in the length of sessions allowed. The lack of differentiation between the two groups is actually a significant indicator.
Similarly, small trends in the pattern of usage can be quite informative. An example is a comparison between the lengths of sessions for visitors and members of the university, shown in table 11. This table does reveal a small but highly significant difference.
Table 11. Percentage of Sessions by University Members or Visitors
<2 2-5 5-15 15-30 30-45 45-60 60-75 75-90 90
+
N/AMembers 5.9 17.8 22.5 17.3 8.3 5.6 2.7 1.4 2.3 16.7
Visitors 8.6 20.9 20.9 14.9 8.0 4.5 2.5 1.1 2.7 13.1
Ifwe define a very short session as one in the range 0 to 5 minutes, then the percentage of very short sessions by visitors is much higher than for university members. Combining the first two intervals, we see that 29.5% of sessions by visitors are very short compared to 23.4% for members of the university. It has been our assumption that sessions of this duration probably represent an experimental rather than a productive or intentimial search. A higher proportion of these searches among visitors is to be expected as they would be less likely to be familiar with the database collection or the operational procedures of the library. Thus the higher proportion of very short sessions by visitors confirms our assumption about the nature of short searches. Confirmation of this assumption by the figures for visitors led us to review the analysis of 'Very Short' sessions by undergraduate students. Values for these are given in Table 12 which shows that a far higher proportion of searches by first years
fall into the Very Short category and thus are probably experimental or misdirected. Table 12. Percentage of Sessions Which Were Less Than 5 Minutes
First Year Second Year Third Year Fourth Year
%<5 minutes 28% 24% 21 % 21%
The high proportion of very short searches by inexperienced patrons led us to believe that the menu system did not provide a means of access that was intuitively easy to understand1• Consequently, the menu system has been completely restructured. The
original menu (which was based on the software supplier) gave little direction as to the contents of any database, in effect forcing users to look in each database to find out what it might contain. The new menu groups databases under broad subject headings to ensure that patrons move quickly to an appropriate set of databases. The fact that this trend is stronger for visitors and first years confirms this assumption about the menu. As a result, the new menu system has been put in place and we look forward to seeing the data for this year so that the effectiveness of the new menu can be evaluated.
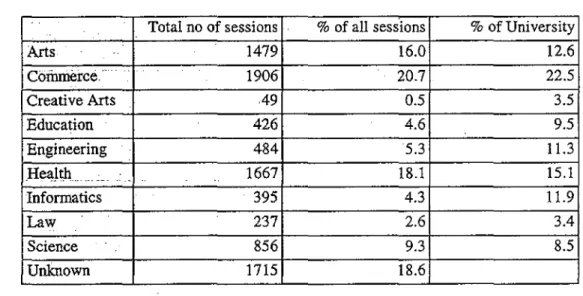
Another major distinction between patrons in an academic library is the faculty to which they belong. Since patrons are required to provide their faulty, we can produce tables such as Table 13 which shows the number oflogins to all databases by faculty.
Table 13. Logins by Faculty
Total no of sessions %of all sesstons %of University
Arts 1479 16.0 12.6
Commerce."
1906 20.7 22.5 Creative Arts .49 0.5 3.5 Education 426 4.6 9.5 Engineering 484 5.3 11.3 .He~Jt.h...-- --- . " " - " 1667 18.1 15.1 Informatics 395 4.3 11.9 Law 237 2.6 3.4 Science 856 9.3 8.5 Unknown 1715 18.6Comparison of usage by each faculty with the total university population reveals some interesting trends. The faculties of Creative Arts, Education, Engineering and Informatics all have proportionally low rates of usage compared to their percentage of the population (less than half). Conversely, the faculties of Arts, Health and Science all make more use .of the facilities then their proportion would suggest, while the remaining two faculties, Commerce and Law, have usage rates of slightly lower frequency than theirpropor~ion.These trends need to be further analysed as there are a number of quite contradictory conclusions that can be drawn from them. For example,
Hyland and Wright: Using Statistics for Database Management in an Academic Library
we might conclude that the Creative Arts faculty are unaware of the database facilities and that a campaign to encourage their use is called for. Alternatively, we might conclude that the databases provided are not beneficial to the Creative Arts faculty and that more suitable databases should be purchased. Alternatively, members of the Arts, Commerce and Health· faculties may cover a wider range of subjects, making it necessary for them to search a wider range of databases to satisfy their information needs.
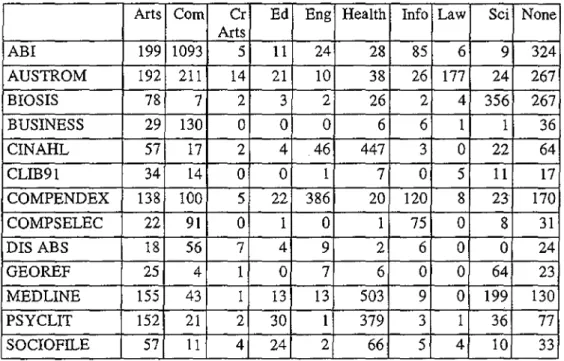
Table 14. Logins by Faculty per Database
Arts Com Cr Ed Eng Health Info Law Sci None Arts ABI 199 1093 5 11 24 28 85 6 9 324 AUSTROM 192 211 14 21 10 38 26 177 24 267 BIOSIS 78 7 2 3 2 26 2 4 356 267 BUSINESS 29 130 0 0 0 6 6 1 1 36 CINAHL 57 17 2 4 46 447 3 0 22 64 CLIB91 34 14 0 0 1 7 0 5 11 17 COMPENDEX 138 100 5 22 386 20 120 8 23 170 COMPSELEC 22 91 0 1 0 1 75 0 8 31 DIS ABS 18 56 7 4 9 2 6 0 0 24 GEOREF 25 4 1 0 7 6 0 0 64 23 MEDLINE 155 43 1 13 13 503 9 0 199 130 PSYCLIT 152 21 2 30 1 379 3 1 36 77 SOCIOFILE 57 11 4 24 2 66 5 4 10 33
This reveals that the faculties of Arts, Commerce and Health, three of the high frequency users, use a significantly greater number of databases than do other faculties. Given such a wide range of database access it is likely that many of these logins were inappropriate for the faculties in question. In particular, there are a significant number of logins by Arts faculty members to the database Compendex. It is most unlikely that the contents of that database would be appropriate for these users. Once again, the decision to restructure the menu system seems to have been justified.
In addition to changes to the menu, training courses and system documentation may need to be improved to ensure that patrons are using the most appropriate database for their information needs.
Conclusion Our case study has shown that it is possible to gain a great deal of information from users of databases in an automated, non-intrusive manner. Given proper analysis, this information can be used to inform many decisions about the management of databases in a library. At the same time, the need to identify different types of patrons makes the collection of data about patrons a necessity. These data can be gathered in an automated fashion but not without intruding upon the patron.
However, the value of the data is such that the intrusion is considered to be warranted. When data gathered by non-intrusive methods are cross-tabulated with the patron data, they provide a rich picture of real usage and patron needs. As a result of our experience, several observations can be made about both data collection and data analysis.
Data collection needs to be carried out over a period of many months or years to minimise two possible problems. Firstly, the automation of the collection process can introduce errors into the data collected as patrons may deliberately or accidentally answer incorrectly. Routinely changing parts of the collection process over a long period of time, eg by changing the order in which facuIties are presented in a question to users, can minimise the impact of such incorrect responses. Secondly, the collection of data for short periods of time may not allow the proper identification of trends. A database may appear to be unpopular one month only to be widely used in the next.
Data analysis needs to make use of common sense and local knowledge as well as statistical techniques. Unexpected results such as incredibly long search sessions are artificial constructs and should be eliminated from the collection process or discounted from analysis. Rapidly increasing levels of usage for a particular database may be caused by the use of that database by a particular group of patrons for a particular task. This should be borne in mind when evaluating the viability of that database.
Finally, the purpose of gathering the statistical data is to make better decisions about the management of the database collection. Analysis of the statistics may indicate the need for changes to the opening hours, training programs and so on. Once these changes have been carried out, further statistical analysis is needed to determine whether the desired outcomes have been achieved. Despite the effort involved in setting up such a system, the benefits are quickly felt. Within six months, significant improvements have been made in our understanding of the real patterns of use by patrons and a number of initiatives have been implemented to improve user satisfaction and system efficiency.
Notes
C Bamford 'CD-ROM Market Study Findings' Proceedings of the /5th National Online
Meeting New York /994 pp45-8; R Hollis 'CD-ROM versus Online: The UK Perspective' Electronic Library vol 11 nos 4-5, 10 August pp307-10
2 C Holloway and M Jackson 'Using the Microcomputer to Keep Statistics on the Use of CD-ROM' Laserdisk Professional vol 1 September 1988 pp67-9; P Bruegmann 'Software to Monitor CD-ROM Usage' Laserdisk Professional vol 2 November 1989 pp44-8; K Butcher and S Scott 'User Statistics for CD-ROM Selection and Management' College and Research
Libraries News vol 53 no 8 September 1992 pp505-6
3 D L Burke 'CD-ROM Master: A Complete CD-ROM Statistics Gathering Package' CD-ROM
Professional vol 4 November 1991 pp58-65; C Pedemonte, C Fare and D Ugolini 'CD-ROM
Access Control: Special Software for a Statistical Survey' CD-ROM Professional vol 4 July 1991 pp40-3
4 P Hyland and L Wright 'Database Access Management: Statistical Support for Planning' Victorian Association for Library Automation (VALA) Conference 1996 pp361-82
5 E E Cevallos and D M Barbuto 'CD-ROM Local Area Networks (LANs) and the Changing Face of Public Services:. A View from a University Library' Proceedings-National Online
Hyland andWright:Using Statistics for Database Management in(111Academic Library
ROMs: Technical Overview and the View from the Manchester Business School' Journal of Information Sciencevol 20 no I pp46-54
6 P N Hyland and L Wright 'Profile of the Patrons and Their Usage of Databasesinan Academic Library' The Australian Library JournalMay 1995 pp13-25.
7 R 0 Atkinson and D C Curtiss 'InfoNet: Integrating Networked CD-ROM Databases and Internet Search Tools'Proceedings-National Online Meeting, New York 1993pp17-24
THE BRITISH LIBRARY PRESS INFORMATION
A report published by the British Library, Title Output in the UK by Philip Bryant (BNBRF Report 78), describing research undertaken for the British National Bibliography Research Fund, explodes some cherished myths about the publishing output of the United Kingdom.
It has long been believed that UK publishers issue more titles that US publishers. The figures for 1993 show that in reality some 91 735 titles were published in Britain as opposed to 143 250 titles in America. In addition-despite the huge number of titles issued per head of population in Britain-the report shows that we lag behind Austria, Switzerland and most of Scandinavia.
Fiction, usually blamed for the huge increase published titles, has in fact increased only minimally over the last 30 years despite a four fold increase in the number of publishers during the same period. The subject areas with the most substantial increases are social sciences, law, and medicine. .
The report is based on 1993 figures, the last full year available, and so does not show the effect of the ending of the Net Book Agreement. In his introduction David Whitaker, Chairman of the British National Bibliography Research Fund, writes: 'The impact of the demise of the NBA will not be seen for a year or two, or perhaps even longer. It might be hazarded, however that the UK will continue to be popular with overseas publishers as a point of entry into the second largest English language market in the world, which is Europe, and that they will continue to open offices here. Their titles will continue to swell 'British' totals. Furthermore, information and knowledge will go on expanding and books will be needed to record the fruits of that expansion. There' is little reason to suppose that title output is going to collapse along with the NBA.'
Further information is available from the British Library Press Office, tel 0171-4127111, fax 0171-412 7268, email [email protected]