SECURITY VISUALIZATION TECHNIQUES
by David Barrera
A thesis submitted to
the Faculty of Graduate Studies and Research in partial fulfillment of
the requirements for the degree of MASTER OF SCIENCE School of Computer Science
at
CARLETON UNIVERSITY
Ottawa, Ontario September 2009
c
Visualization of network security events has become an important method for detecting, responding to, and resolving security incidents. While there are many security visualiza-tion tools and techniques available, each one may require a different run-time environment and data input, making it difficult for a network security analyst to try them all (or a significant subset) and select those that work best for a specific incident or purpose.
This thesis analyzes three common classes of network attacks that security analysts encounter. Relevant variables which help understand and resolve an incident are identified in each specific class of attack. We then survey a large set of network security visualization techniques and use a task-based methodology to assess the usability, insight gained and overall usefulness of visualization tools for specific classes of attacks. We also recommend the most appropriate techniques for visualizing each attack and suggest other features that could help provide more insight.
First and foremost I would like to thank my supervisor, Dr. Paul van Oorschot for helping me with my thesis and throughout my degree. This thesis would not have been possible without his valuable input and guidance. I would also like to thank my family for their continued and unconditional support. Finally a special thanks to my colleagues for their insightful discussion and comments.
Abstract ii
Acknowledgements iii
List of Tables vii
List of Figures viii
Chapter 1 Introduction 1 1.1 Introduction . . . 1 1.2 Motivation . . . 2 1.3 Problem . . . 2 1.4 Main Contributions . . . 3 1.5 Overview of Results . . . 5 1.6 Organization of Thesis . . . 5
Chapter 2 Background and Related Work 6 2.1 Data Visualization . . . 6
2.1.1 Preattentive Processing . . . 7
2.1.2 Visualization Process . . . 8
2.1.3 Problems with Visualization . . . 9
2.1.4 Visualization for Network Security . . . 10
2.2 Data Types and Sources . . . 11
2.3 Networking Concepts . . . 13
2.3.1 The Network Stack . . . 13
2.3.2 IP Addressing . . . 16
2.4 Related Work . . . 17
Chapter 3 Three-Phase Model and Classes of Network Attacks 19 3.1 Introduction . . . 19
3.2 Network Security . . . 20
3.2.1 The Three-phase Model for Network Security . . . 21
3.2.3 Network Security Analyst Work Flow . . . 24
3.3 Data Filtering . . . 25
3.4 Monitoring in Real-time . . . 27
3.5 Analysis and Diagnosis . . . 28
3.6 Three Common Classes of Network Security Attacks . . . 28
3.6.1 Denial of Service (Monitoring in Real-time) . . . 29
3.6.2 Network Scanning (Monitoring in Real-time) . . . 32
3.6.3 Brute-force Password Guessing (Analysis and Diagnosis) . . . 35
3.7 Further Discussion . . . 37
Chapter 4 Classification of Security Visualization Techniques 40 4.1 Introduction . . . 40
4.1.1 Visualizing Processed Data . . . 41
4.2 Scatter plots . . . 42
4.2.1 Source and Destination IP address and Destination Port . . . 43
4.2.2 IP Matrix . . . 46 4.2.3 NVisionIP . . . 46 4.2.4 Portvis . . . 48 4.2.5 3D Scatter Plots . . . 50 4.2.6 Sparklines . . . 51 4.3 Link Graphs . . . 52
4.3.1 Classic Link Graphs . . . 53
4.3.2 3D Link Graphs . . . 54
4.3.3 Parallel Coordinate Plots . . . 57
4.3.4 Starplots . . . 58
4.3.5 Compound Glyphs . . . 59
4.3.6 FloVis . . . 60
4.4 Geographical and Space-filling Maps . . . 62
4.4.1 Treemaps . . . 63
4.4.2 Quadtree Maps . . . 64
4.4.3 Geographical Maps . . . 65
4.5 Summary . . . 66
5.1 Introduction . . . 68
5.1.1 What Are We Looking For? . . . 68
5.1.2 Factors to Consider When Selecting a Technique . . . 69
5.1.3 Challenges With Security Visualization User Studies . . . 69
5.2 Methodology . . . 70
5.2.1 Task-based Analysis . . . 70
5.2.2 Method for Selecting a Visualization Technique . . . 72
5.3 Monitoring in Real-time . . . 72
5.3.1 Denial of Service . . . 72
5.3.2 Network Scan Detection . . . 77
5.4 Analysis and Diagnosis . . . 81
5.4.1 Brute-force Password Guessing Attacks . . . 81
5.5 Summary . . . 87
Chapter 6 Visualization of IPv6 Data Sets 89 6.1 Introduction . . . 89
6.1.1 Extension of Selection Methodology for IPv6 . . . 90
6.1.2 Related work . . . 90
6.2 Differences Between IPv4 and IPv6 . . . 90
6.3 Visualization Proposals and Examples . . . 92
6.3.1 Indexing . . . 92 6.3.2 Treemap Hierarchy . . . 93 6.4 Discussion . . . 96 Chapter 7 Conclusions 99 7.1 Limitations . . . 100 7.2 Future Work . . . 101 Bibliography 102 vi
Table 3.1 Requirements for monitoring vs. analysis . . . 38
Table 4.1 Summary of visualization techniques and features . . . 67
Table 5.1 Summary of visualization technique recommendations . . . 88
Figure 2.1 Preattentive processing . . . 8
Figure 2.2 Comparison of IPv4 and IPv6 packet headers . . . 15
Figure 3.1 Exposure map filtering . . . 26
Figure 4.1 Visualization of processed data . . . 42
Figure 4.2 Scatter plot . . . 44
Figure 4.3 Existence plots . . . 45
Figure 4.4 IP Matrix . . . 47
Figure 4.5 NVisionIP . . . 48
Figure 4.6 Portvis . . . 49
Figure 4.7 Cube-like visualization . . . 51
Figure 4.8 The Contact Surface . . . 52
Figure 4.9 Sparklines . . . 52
Figure 4.10 IDS log visualization . . . 54
Figure 4.11 3D Link graph . . . 55
Figure 4.12 Visualization of BGP traffic . . . 56
Figure 4.13 Parallel coordinate plot . . . 58
Figure 4.14 Starplots . . . 59
Figure 4.15 Glyph-based link graphs . . . 60
Figure 4.16 Edge Bundling . . . 62
Figure 4.17 Treemap . . . 64
Figure 4.18 Quadtree maps . . . 65
Figure 5.1 Glyph-based link graph showing a DoS attack . . . 73
Figure 5.2 Grid Heatmap . . . 77
Figure 5.3 Treemap/link-graph visualization . . . 82
Figure 5.4 Distributed brute-force password guessing . . . 83
Figure 5.5 SSH brute-force password guessing . . . 86
Figure 5.6 Word cloud . . . 87
Figure 6.1 3D link graph view of an IPv6 network . . . 91
Figure 6.3 Treemap for IPv6 displaying type of service . . . 97 Figure 6.4 Treemap locating DNS servers . . . 98
Introduction
1.1 Introduction
Network security administrators and analysts are tasked with protecting the integrity and maintaining operations of today’s computer networks. They achieve these tasks by constantly monitoring data flow in and out of the network and looking for signs of misuse or attacks.
A number of tools have been designed over the past 10-20 years which help alert the analyst in the event of an intrusion or attempt thereof. These tools often require a deep understanding of the network in order to accurately distinguish a real attack from a false positive. Both anomaly detection and signature-based intrusion detection systems generate massive amounts of audit data. Sifting through these logs, coupled with system logs, firewall logs and server logs makes security monitoring a difficult and time-consuming task for network administrators. The problem is becoming worse as the cost of storage is at an all-time low, and the amount of data being saved is higher than ever. Network administrators are constantly in search of ways to make sense of the overwhelming amounts of data coming in from a vast number of sources.
Information visualization combines the power of human perception and computer graphics to help understand and analyze large data sets. In recent years, there have been many proposed network security visualization tools and techniques ([34, 54, 63, 26, 40, 22, 69] to name a few), all of which claim to help the analyst gain insight into the current status of the network. While a visual approach to representing network data frequently does help analysts, the incorrect selection of a visualization technique might not reveal any interesting patterns at all, or worse, hide important information from the
administrator. Thus, it is important for the analyst to appropriately select a technique that is tailored to the type of data and the answers being searched for.
1.2 Motivation
There is a tendency in the security visualization community to claim that a particular tool or technique is the best for visualizing a particular type of problem. The claim is justified by showing an example of the tool on a particular data set (which may or may not represent real-world data sets in general). Such claims are often based on the tool designer’s own analysis on a specific data set and involve neither a user study nor independent expert evaluation. Furthermore, a user study of any of the currently available visualization systems is difficult to produce.1 However, taking a step back to identify the core problem, there appear to be only a small number of core visualization techniques (with many small variations on each one), and a relatively small number of common classes of network security events for which these techniques are proposed or used. We believe it is possible to successfully pair each of the most common network security events with one or more corresponding visualization techniques, in order to provide the analyst with a deeper understanding of events. This thesis pursues this goal.
1.3 Problem
The problem we address consists of identifying security visualization techniques that are well-suited for particular classes of network attacks. A visualization technique is more likely to be useful if it allows the analyst to easily detect specific properties and reveals insight about the attack and attacker. In this thesis, we describe the different phases of network security monitoring and identify the main tasks required by the analyst to detect specific threats. We then list the currently available visualization tools and techniques and create a classification based on the type of graph used. Finally, we pair each of
1A meaningful user study would require experts in network security with knowledge of the network
three common classes of network security attacks (denial of service, network scanning, and brute-force password guessing) with the visualization technique that offers the most insight and allows the analyst to perform assessments as efficiently as possible.
The scope of this thesis is limited to two primary areas of network security: network monitoring, andanalysis and diagnosis of events. Using visualization for the third phase of network security (i.e., incident response) is not discussed. The primary scope of network monitoring and analysis is limited to external-to-internal communication, with a heavy focus on perimeter security and capturing data at border routers. With this scope, we label remote devices as thesource, and internal hosts as thedestination of attacks. While we do reference some internal monitoring concepts in Chapter 3, the “internal threat”2 is not analyzed. Some visualization techniques and data capturing tools can be extended to visualize internal-to-internal communication, but this is beyond the scope of this thesis.
1.4 Main Contributions
The thesis has five main contributions to the field of network security visualization, as follows.
1. Classification of visualization systems. To the best of our knowledge, there has been no prior work in classifying visualization techniques for network security. We present an up-to-date classification of network security visualization techniques grouped by the type of diagram used to display network data. This classification allows us to identify strengths and weaknesses of each technique, and then match them with three classes of network security attacks. This classification provides a state-of-the-art survey of network security visualization techniques.
2. Filtering technique to reduce occlusion. We briefly discuss a new data visu-alization filtering technique [17] (published jointly with Mansour Alsaleh and Paul van Oorschot) that helps reduce occlusion by eliminating data which is of limited
2The internal threat refers to malicious users or software located inside the network perimeter, usually
use to the analyst. Our results show visualizations which are less cluttered and eas-ier to interpret, providing more insight than visualizations without filtering. The filtering technique is provided as background, and not described in detail here, however, some of the example visualizations in our paper are used in this thesis.
3. Selection process and recommendation of security visualization tech-niques. Using prior work in usability and network security, we identify what appear to be three major classes of network security attacks that occur frequently, and an-alyze them. The analysis helps identify the main stages of incidents of each class, and what variables are important to the analyst at each stage. Using these variables and analysis, we outline a methodology for selecting an appropriate visualization tool or technique to help understand each class of attack.
4. Analysis of IPv6 support in visualization techniques. All the visualization tools we analyze currently assume that the underlying protocol carrying the network data in question is IPv4. As the updated version, IPv6, becomes more widely deployed, visualization tools are failing to keep up, and still have no support for it. Attackers can therefore remain undetected if their tools use IPv6. We analyze the current state of IPv6 support in visualization tools, and identify the changes necessary for tools to support the new protocol.
5. Proposal of new visualization techniques. We propose a new visualization technique which we callgrid heatmap to help detect denial of service attacks without occlusion. For the analysis of brute-force password guessing attacks, we recommend usingword clouds along withparallel coordinate plots. In the case of IPv6 data sets, we offer two contributions [18]: a white space filtering technique that allows the visualization of the entire populated IPv6 address space, and the use of treemaps
1.5 Overview of Results
After looking at many freely available visualization tools and techniques, we have gener-ated a classification which groups them into three main categories: (1) scatter plots; (2) link graphs; and (3) geographical and space-filling maps. We have identified the phases in the workflow of network security analysts and reviewed common classes of network at-tacks (denial of service, network scanning and brute-force password guessing). We have recommended visualization techniques for each class of attack and proposed new visual-ization techniques in cases where we were able to improve upon existing visualvisual-izations.
1.6 Organization of Thesis
The remainder of this thesis is structured as follows. Chapter 2 provides background concepts for both information visualization and computer networks, to help understand the network security attacks and visualization techniques. Chapter 3 provides a brief in-troduction to network security as well as some intuition as to how visualization can help analysts; reviews the work flow of a typical network security analyst and describes three major classes of security-relevant events that visualizations are used to identify, capture, and explore; and provides detailed description and analysis of phases of the analysts’ work flow and example network security attacks, identifying key variables important for visu-alization. Chapter 4 reviews the most common security visualization techniques in the literature, including examples and a summary displaying features and drawbacks identi-fied for each technique. Chapter 5 informally proposes a methodology for visualization technique selection, combining the classes of attacks from Chapter 3 with the techniques from Chapter 4. Chapter 5 also presents a new visualization technique and two new uses of existing visualization techniques for detecting and analyzing network attacks. Chapter 6 explores how visualization for network security data will be affected by the move to IPv6 and suggests two techniques for displaying the new protocol. Chapter 7 discusses limitations, future work and concludes.
Background and Related Work
This chapter is divided into four main sections. The first introduces data visualization concepts. The second section reviews types of network security data, and where they can be obtained. The third section presents background on networking and network security. The last section covers some of the related literature which attempts to help organize visualization tools and techniques available for network security.
2.1 Data Visualization
Information visualization is defined as the representation of information through graph-ical means in order to convey a concept clearly [22]. Data visualization is a subset of information visualization and focuses on the visual representation of data rather than ab-stract concepts. Data visualization is used in a wide range of fields to illustrate, interpret, understand and analyze all types of data and leverages the power of human processing, along with our natural ability to quickly detect patterns, trends and changes in images. The primary objective of data visualization is to gain insight into a data set.
Visualization has many benefits. When large amounts of data can be compared at once (through a single graphical representation), information can be communicated more efficiently. There is no longer a need to manually interpret every data point, and rely on our short-term memory to compare values. Once the information has been communicated, questions about the data set can often be answered quickly, such as: “does this data representation reveal abnormal events?” or “are there any outliers?”. Visualization can also help support decisions, particularly in time-sensitive cases, where manual analysis or inspection is not possible.
Data visualization however cannot be seen as a replacement for text-based data analy-sis tools. Text-based tools will often provide extremely fine-grained detail about the data set, which cannot always be represented visually. This is due to certain inherent problems with visualization tools such as limited size displays, labeling, and occlusion (discussed in more detail in Section 2.1.3). Visualization could be described as a trade-off between a high level overview and a detailed perspective, requiring the user to actively switch between modes in order to navigate through the data. Ben Schneiderman noted this work flow and coined the information visualization mantra [73]: “Overview first, zoom and filter, details on demand”. This mantra describes a 3-step technique for analyzing data, which usually turns into an iterative process.
The graphical representation of data is created by using colour, shape, position, size or any other graphical property to encode information. The large number of combinations of these properties makes it possible to display thousands of data points at once, and still allow the brain to detect changes and patterns.
2.1.1 Preattentive Processing
Preattentive processing [42] is defined as visual processing that occurs prior to the act of selection, more specifically, to the humans’ built-in ability to automatically (i.e., without searching) detect parts of images that “stand out” from the rest. Preattentive processing requires on the order of 250ms or less and requires virtually no effort other than the analyst looking at the image.
In Figure 2.1(a), we show an example image in which the user detects the filled-in circle using preattentive processing. Notice that it is extremely simple to pinpoint the circle that stands out from the rest. Figure 2.1(b) shows an example where the user needs to actively search for the unique part of the image, in this case a filled in circle.
As discussed in Chapter 4, many visualizations tools take advantage of preattentive processing to minimize strain on the analyst and maximize effectiveness of the tool. However, many tools are unable to exploit this feature due to occlusion or other technical
limitations.
(a) Preattentive Processing (b) Non-preattentive Processing Figure 2.1: Preattentive processing
2.1.2 Visualization Process
In the book Visualizing Data [35], Fry defines the visualization process (i.e., the steps required for converting raw data to the insightful visual representation of that data) in 7 steps.
1. Acquire. Data is captured or recorded.
2. Parse. Because the saved data can be in a number of formats, a parsing tool1 reads in data and outputs it in a format that is suitable for the visualization tool.
3. Filter. Data is filtered to remove unrelated or uninteresting points in an attempt to reduce occlusion.
4. Mine. Similar to the filter step, data is reduced or modified through mathematical or statistical operations.
5. Represent. This step is the initial attempt at a visual representation.
6. Refine. Once the data has been visualized for the first time, an iterative process of focusing on a specific part of the visualization, or further filtering, or even changing the visualization technique can be done.
7. Interact. This step involves exploring data by changing viewpoints or “pivots” (interesting data points used an anchors for further exploration).
The process begins with capturing data (1) either from log files or from a network monitoring device. This data is captured in its purest form, without any modifications. Parsing (2) the raw data is necessary to convert the file into a more flexible file format that can be imported into other applications for further processing. Some applications support raw data, but many more applications support comma separated values (CSV) or tabular entries. Filtering and mining (3, 4) involve the analyst interacting with the data set. It is common for security analysts to encounter data sets that containInternet Background Radiation2 (IBR) which needs to be filtered out in order to make clearer, less noisy visualizations. The filtering is often done by hand, relying on the analyst’s expertise (which makes analyzing large data sets a time-consuming task). We discuss our own work on automatic data filtering in Section 3.3. The final steps of the visualization process are to generate an image (5) and look for sections that show interesting characteristics. Optional steps (6 and 7) can help the analyst detect previously unknown threats by interacting with the data set.
2.1.3 Problems with Visualization
While visualization provides many advantages over text-based tools, there are certain problems that can make visualization less useful. For example, occlusion (the visual obstruction of data) can make many data points overlap, preventing the analyst from viewing areas of the visualization where relevant data is contained. Labeling is another potential problem: too many labels on data points can hide actual data values, or overlap
2IBR is comprised of unsolicited, generally untargeted traffic coming from a large number of hosts
(compromised by old worms and viruses) which were never disinfected and still look for new hosts to infect.
to the point of becoming illegible. Parallel coordinate plots (described in Section 4.3.3) often suffer from this problem due to their layout. 3D visualizations also require the analyst to actively interact with the tool to uncover data that is hidden “behind” another point. Reading precise values directly from graphs is also difficult, particularly when scale is non-linear, or too many labels are displayed. These limitations are mostly inherent to visualization in general, rather than specific to security visualization.
2.1.4 Visualization for Network Security
Network security visualization links the fields of data visualization, information visual-ization and network security to provide a graphical representation of network security events. These events (see section 2.2) can range from abstract data such as log entries or intrusion detection alerts, to measurable data such as average throughput or link sat-uration. One objective of data visualization in the field of network security is to help the analyst understand a particular event, and prioritize it among a sea of other events seen at the same time. Another important focus of visualization for network security is to help the analyst form a mental image of the current network status. This helps the analyst understand context [38] and generate better assessments in a timely fashion. More precisely the goal is not only to help the analyst detect attacks, but also understand the attacks and help prevent them in the future.
In the book Applied Security Visualization [62], Marty notes that there seems to be a security visualization dichotomy: good visualization tools are written by experts in visualization, who are rarely experts in security; and security experts are rarely experts in visualization. This dichotomy often leads to tools that generatepretty pictures but do not provide much insight, or tools that require high levels of expertise to use. Network security visualization aims to bridge this gap and provide visualizations which give analysts a better understanding of attackers and their attacks.
Complementary Visualizations
We define the concept of complementary (or secondary) visualizations as two or more visualization techniques or tools which don’t provide much insight independently, but when displayed together significantly increase the analyst’s understanding of an event. In security visualization, complementary visualizations are particularly useful, since viewing data in multiple ways can help the analyst discover abnormal behaviour, or provide deeper insight into a detected attack.
2.2 Data Types and Sources
Data visualization literature generally defines three types of data:
1. Ordinal Data. This is qualitative data in which there is an inherent order. How-ever, no numerical comparison can be done between two data points. Examples of ordinal data include the priority (high, medium, low) of intrusion detection alerts.
2. Categorical Data. These are nominal values usually based on a type or label. There is no measurable quantity between points, so data is difficult, if not impossible to compare. Examples are types of log messages, names of applications or services and secure shell usernames.
3. Interval Data (continuous measurement). This type of data numerically de-scribes an object, and possesses comparable and quantifiable values. Examples include packet size, time of arrival of a packet and sequence numbers.
Interval data is the easiest to display graphically, since the inherent numerical value can simply be plotted on a graph. Ordinal and categorical data must be processed and quantified in order to be visualized.
Network security administrators collect data from several sources. Servers, hosts, firewalls and other devices can generate data such as logs or network traces, which are all important to the network administrator. A typical network administrator will need
to store the following types of data (while there are other sources, but this thesis focuses mainly on the following).
1. Log Messages. These are text records containing details of events. Logs are also known as event logs, event records, or audit records. When several logs are grouped together, the collection is known as an audit log or audit trail. Logs generated by the same application typically have the same format and are therefore simple to parse. Log messages are generated and then sent via email, saved to a storage device, or sent to a log aggregation facility. Some examples of log messages are:
i) Intrusion Detection Systems (IDS) alerts. An IDS will generate many alerts or logs, especially if it is not configured correctly. Most IDS generate an overwhelming number of false positives. IDS logs are created when one of the rules (in the case of signature based IDS) was matched.
ii) Firewall logs. Firewalls can record details about connections that were al-lowed, blocked or ignored. For very restrictive firewalls, logging all blocked packets will generate a substantial amount of information, so the configuration is usually dependent on the network architecture and configuration of the firewall.
iii) Syslog logs. Syslog is a log aggregator on Linux systems that has become the de facto standard for storing and managing log files. Syslog aggregates logs from authentication services such as the Pluggable Authentication Module (PAM) or Kerberos, web servers, cron (a job scheduler) jobs and any application or service that supports logging to syslog.
iv) Application logs. Applications can generate their own logs in their own format. Most enterprise-grade server applications support logging to syslog for log management and aggregation. However some applications simply output debug data and alerts to a file, which must then be parsed or read manually.
2. Network Traces. These are the full network data dumps off the wire obtained from passive network analysis. Network traces require large amounts of storage
space, but are very useful in forensic analysis of incidents, since they store every single packet (including header and payload) seen on the network in a separate data structure.
Netflow is a commonly used compact representation of a series of packets in a net-work conversation between hosts [24]. Each netflow record stores a 5-tuple (some-times a 6 or 7-tuple depending on the protocol version used) in the form of:
<Timestamp, source IP address, destination IP address, source port, destination port (, packet count, bytes transferred)>
This format greatly reduces the space required to track long lasting connections (e.g., a 650MB file download will only require a few bytes to describe, with the downside of losing the payload level information, and the exact packet arrival in-tervals).
2.3 Networking Concepts
This thesis focuses on the visualization of network level intrusions and attacks. Therefore it is important to have some background in networking to better understand the events being analyzed. This section reviews some general networking concepts and describes the tasks of a network security analyst.
2.3.1 The Network Stack
Operating systems provide a network stack that software services use to communicate over a network. The stack is divided into a specific number of layers (depending on the definition used) with each layer being responsible for a particular task. We will use the “Internet model” as defined by the Internet Engineering Task Force (IETF) in 1989 [48]. The layers are as follows.
1. Link layer. This layer is responsible for reading electrical impulses off the wire and translating them into a system-readable sequence of bytes. This layer also defines
the hardware addresses of systems, known as Media Access Control or MAC address; and is in charge of reading and verifying a checksum trailer on every network frame received, or appending a checksum to every frame sent. Data from the Internet layer (layer 2) is said to be encapsulated between the address header and the checksum trailer added at this layer. Address Resolution Protocols (ARP) are also described at this layer.
2. Internet layer. RFC 1122 [48] requires that all network stacks implement at least the Internet Protocol (IP) and the Internet Control Message Protocol (ICMP) at layer 2. The core functionality of the Internet layer is to verify that incoming link layer frames are correctly formatted, to process header options, to perform reassembly and to pass on the reassembled packet to the transport layer. Outgoing frames are fragmented if necessary, and the correct first hop is selected with help from the operating system’s routing table.3
3. Transport layer. The transport layer defines transport protocols such as the User Datagram Protocol (UDP) and the Transport Control Protocol (TCP). The concept of port numbers is described in this layer, as well as session control for TCP and best-effort delivery for UDP. Some checksumming is also performed at this layer. TCP windowing and congestion control algorithms are all applied at this layer.
4. Application layer. The top layer of the network stack is usually the interface between the network and the user. These interfaces are usually in the form of software applications such as OpenSSH or an FTP client or a web browser, which will use the underlying transport protocols and in turn the lower level protocols.
The scope of this thesis is primarily focused on the Internet layer (layer 2) and Trans-port layer (layer3), since most of the data recorded will come from these two layers. Some application-specific details are important for forensic analysis (e.g., it might be useful to
3A routing table is a list of network address ranges and network interfaces through which those
networks can be reached including the next network device. Routing tables can be built statically or learned dynamically through a routing protocol such as RIP, OSPF or BGP.
know what version of vulnerable web server software was exploited), but that data is mostly categorical and difficult to visualize. It may also be useful to know what hosts on a local network are communicating the most, but as explained in Section 1.3, the main focus of this thesis is external-to-internal communications. Since layers 2 and 3 use packets as their data units, we’ll examine the structure of a packet.
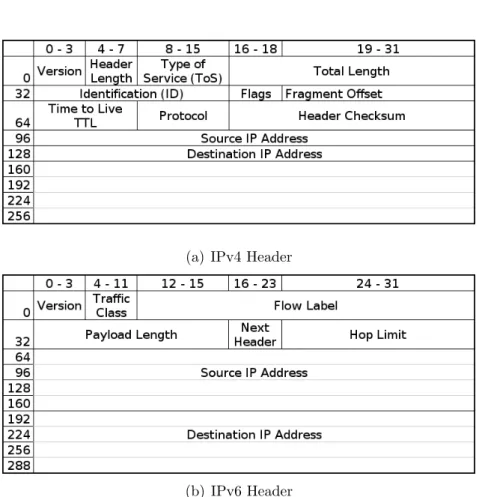
Packet Headers
(a) IPv4 Header
(b) IPv6 Header
Figure 2.2: Comparison of IPv4 and IPv6 packet headers
Headers are located at the beginning of packets, preceding the payload. Headers con-tain information such as the source and destination IP addresses, source and destination ports, time-to-live values and any other critical information that the network infrastruc-ture requires to get the packet to its final destination. A header format is usually static and defined by specific RFCs. In the case of IPv4, the RFC is 791 [49] and for IPv6,
headers are defined in RFC 2460 [28]. Figure 2.2 shows the headers side-by-side. No-tice that Figure 2.2(b) has a smaller number of fields, but the source and destination IP addresses are 128 bits long.
While most visualization tools assume the underlying protocol is IPv4, IPv6 is cur-rently gaining adoption. When they deal with IPv6 data sets, many visualization tools will fail by crashing or ignoring the protocol entirely. In Chapter 6, we explore this problem and possible solutions.
Packet Payloads
Payloads contain the actual data being delivered from one host to another. This data can range from human-readable data such as unencrypted Hypertext Markup Language (HTML), to encrypted data or combinations thereof. Payloads contain data that could personally identify users. This often leads to a practice of capturing only header data, or removing payloads after capturing in order to preserve privacy. While many visualization tools only require header data, some tools allow visualization of the entire payload and provide more information to the analyst.
2.3.2 IP Addressing
IP addresses for network devices are like telephone numbers. They uniquely identify each device on a network, and remote hosts do not need to know the physical location of another host in order to send it data. The currently deployed Internet infrastructure runs mostly over IPv4 [41], so it is common to see visualization tools representing IPv4 addresses. IPv4 addresses are written in adotted-decimal format that contains four 8-bit numbers. All IP addresses contain 2 parts: a host segment and a network segment. The following example illustrates how an IP address is split into two segments.
Decimal Binary
IP address : 192.168.1.20 11000000.10101000.00000001.00010100
Subnet mask : 255.255.255.0 11111111.11111111.11111111.00000000
Network addr. : 192.168.1.0 11000000.10101000.00000001.00000000
Host address : 0.0.0.20 00000000.00000000.00000000.00010100
A logical AND operation between the IP address and the subnet mask reveals the network address, and the inverse operation reveals the host address. IP addresses belong to one of 4 classes: A (IP addresses that start with 0-127), B (128-191), C (192-223) or D (224-255). Each class has a fixed number of bits for subnet masks. This number can be varied to make smaller networks.
Subnets are important specifically for terminology, as many IP-based visualization tools display only a part of the address, like the network segment of a class A or class B address, and don’t visualize the host level. Other visualization tools only display the host segment.
2.4 Related Work
To the best of our knowledge, there has been very limited work in attempting to match specific types of attacks with specific visualization tools or techniques. The two most complete references are security visualization books by Greg Conti [25] and Raffael Marty [62].
InSecurity Data Visualization [25], Conti presents an introduction to network security visualization. A number of security-related actions such as port scans, firewall logs man-agement and vulnerability assessment are reviewed, with example visualizations. Other examples include the visualization of malware and binary files, which are not covered in this thesis. Conti highlights the importance of selecting the right visualization tool for the job, but the tools he chooses for specific events are his personal choice, with the rationale behind the selection rarely discussed.
In Applied Security Visualization [62], Marty focuses on visualizing data that helps secure organizations operationally. Rather than visualizing files, Mary shows examples of visualization of log files, perimeter network monitoring and insider attacks. The book has a heavy emphasis on the theory of information visualization and in understanding the different types of data available in network security. Marty also briefly discusses how a type of graph should be selected. His analysis is geared primarily towards understanding the number of variables and what type of information can be obtained from each visu-alization technique (comparison of absolute values, or displaying how variables relate). Our approach focuses on identifying a specific type of attack, and then selecting the most appropriate visualization technique.
There has also been some initial work in designing security visualization tools based on requirements of the user [39] which seems to have some positive results. A drawback of this study is that undergraduate students were representing the “expert” network administrators. However, user studies should not be discarded as they are a useful first step in designing visualization tools and, in addition to this thesis, could lead to more focused evaluations and user-centered designs.
Three-Phase Model and Classes of Network Attacks
This chapter provides a brief introduction to network security and discusses how visu-alization can help analysts detect threats. We also review the work flow of a typical network security analyst, and describe three major classes of security-relevant events.
3.1 Introduction
Visualization is one of the many tools in the arsenal of a network security analyst. Graph-ically representing textual data can not only help detect new attacks as they unfold, but can also help analysts understand how attacks took place, and thereby how to prevent them in the future. Visualization for network security is a helpful way to interpret the vast amounts of data to be reviewed by administrators.
In this chapter, we review key network security concepts and define the phases in the work flow of a network security analyst. By clearly defining these phases, we are able to more accurately understand the requirements for each phase, which in turn will help facilitate selection of the most suitable visualization techniques. For each phase, examples of well-known attacks are discussed.
In Section 3.4, we analyze real-time network monitoring, and how administrators can benefit from working with real-time data. Section 3.5 reviews the analysis and diagnosis phase of network security. Finally in Section 3.6, we discuss denial of service attacks, network scanning, and brute-force password guessing attacks against services that require authentication.
3.2 Network Security
Network security analysts are tasked with defending resources and minimizing downtime created by attacks. A wide variety of freely available tools can help analysts perform their job quickly and effectively. Most of these tools (SiLK [11], Argus [1], tcpdump [13], Wireshark [16]) are text-based and not very user-friendly, requiring the analyst to leverage skill and prior knowledge in order to accurately detect attacks. There are also a variety of visualization tools that can help the analyst, but due to the lack of “real-world” testing, their value is questionable.
Network security is frequently associated withintrusion detection, and while there are other functions which are part of network security, intrusion detection is one of the most widely encompassing, covering all of the stages of an attack (reconnaissance, exploitation, post-exploit). Intrusion detection includes unauthorized attempts of accessing network resources (servers, end-user devices and other infrastructure).
Intrusion detection systems (IDS) work under one of two main approaches (or a com-bination thereof): signature-based detection and anomaly-based detection. The former relies on a database of patterns associated with packets or behaviour that should not be allowed on the network, while the latter uses heuristics and machine learning to detect packets or behaviour that are abnormal or suspicious.1 When an IDS detects malicious or suspicious activity, it generates an alert (and can also be configured to drop that particular packet or block the activity).
Regardless of the type of network IDS being deployed, the motivation for its use is generally to discover and prevent attackers from disrupting or abusing the network infras-tructure. Information learned from an intrusion detection system can also be correlated with data captured from different sources, such as those discussed in Section 2.2.
1In anomaly detection, there is a training phase in which normal network behaviour is modeled, and
3.2.1 The Three-phase Model for Network Security
To select a visualization tool, it is useful break down the problem we are trying to visu-alize. Recently work has gone into carrying out studies with the purpose of researching and understanding the steps in the work flow of a security analyst. By understanding the work flow, we can tailor visualizations to each phase rather than look for a tool that can visualize a broader range of events. In one of these user studies, Goodall et al. [39] deter-mined that analysts routinely use a three-phase model for network intrusion detection. The phases were identified to be:
1. Monitoring phase. The network is observed, and the analyst looks for signs of anomalies and malicious behaviour. It is in the monitoring phase that the analyst builds a mental image of the current network, trying to include as many variables as possible for increased comprehension.
2. Analysis and diagnosis phase. In this phase, an event has triggered the analyst’s attention, who proceeds to gather more specific details to determine if the event requires further investigation. If the event turns out to be an intrusion or attack, then more data from other sources can be analyzed, focusing specifically on the context and time period of the intrusion.
3. Response phase. This phase involves the analyst deploying countermeasures or safeguards against the attack, with the objective of preventing the attack from reoccurring.
We believe that this three-phase model is extremely useful since it provides a clear separation of the tasks involved in network security analysis. Furthermore, these phases appear to be widely accepted. Network security visualization is heavily task-oriented, with no single tool capable of solving all problems at once. By leveraging the three-phase model, we are able to more accurately identify the key requirements for each phase (as described in Sections 3.4 and 3.5), and find a well-tailored visualization tool that meets the requirements for that specific phase.
A different user study by Yurcik et al. [84] suggests that an overall situational aware-ness of the entire network is essential for network administrators. However, they also require the ability to drill-down and view specific details of the event being analyzed. Based on these requirements, the information visualization mantra, and the existing tools surveyed in Chapter 4, we believe that it is difficult for a visualization tool to provide both a high level overviewand fine-grained detailed view at the same time. We also note that the requirements of visualization tools may vary from network to network, but in general requirements differ from the monitoring phase to the analysis phase. Therefore different visualization techniques might be appropriate at each phase.
Killcrece et al. [53] conducted a study of 29 Computer Security Incident Response Teams and found that a large percentage of the interviewed analysts’ time is spent on analyzing artifacts (66%), monitoring IDS alerts (62%) and monitoring network and system logs (38%). These tasks were confirmed in a different user study by Botta et al. [20].
Goodall et al. [39] point out that most current visualization tools available are designed to graphically represent the monitoring phase. This is somewhat intuitive, since the monitoring phase requires the analyst to keep track of events occurring in real-time and also review data from a large number of sources. In the monitoring phase, a large number of independent variables are displayed (e.g., characteristics and trends of the data set in question), allowing visualization to be used to a greater extent. The response (third) phase is beyond the scope of this thesis (visualization helps detect attacks and analyze traffic, but the administrator or analyst’s decision on how to proceed once they have obtained this knowledge is a further topic); we will focus on the monitoring phase as well as the analysis and diagnosis phase.
3.2.2 The Importance of Context and Time Context
It is nearly impossible for a network administrator to accurately evaluate the severity, importance or impact of a particular event from simply examining a single log entry or alert. The importance of an alert will be heavily dependent on the context (i.e., other alerts, events, packets, etc. that were seen during the same time frame2) surrounding that particular alert. This means that the event is merely a starting point for exploration of data, with the end objective of classifying the event as an actual threat or as a false positive.
Once an event has gained the analyst’s attention, he will generally proceed to supple-ment the event with data from other sources and proceed with further analysis depending on personal knowledge and experience. Aggregating this data provides the analyst with more information to reconstruct the timeline of the event and gain a better understanding of what actually happened.
For example a spike in network activity at 3 A.M. may mean that someone has gained unauthorized access to the network and is using resources. However, if this spike begins with a log message saying: “Nightly backup started at 3 A.M.”, then the spike is most likely the backup taking place, and not a suspicious event.
Time
Most data in network security has a timestamp (a field containing the date and time at which the packet, log, or message was generated). If the data does not contain a built-in timestamp, the operating system or software can record the date and time at which that particular data was generated.
Time is one of the most frequently used variables in security visualization. Scatter plots, histograms, parallel coordinate plots and surface plots all use this variable to
2It is also possible to see attacks that occur in a different time frame, but typically there is a chain
communicate the temporal context of data. Time is also useful to see what was happening at the same timestamp or near that timestamp to frame a better context.
Visualization with respect to time is a useful way of understanding the progression of an incident. Furthermore, time-based visualizations can help discover incidents that are related (occurring in the same time-frame) to the event that triggered the analyst’s attention.
3.2.3 Network Security Analyst Work Flow
D’Amico et al. [27] offer insight into the work flow of a network security analyst. They identify the main steps taken by security analysts for moving from raw data to classifying a suspicious event as a security incident.
1. Monitor raw data. The analyst monitors various data sources with the objective of maintaining situational awareness (defined in Section 3.4). While many analysts look at alerts generated by IDS and firewalls to cue them when interesting events are detected, some administrators leverage their expertise (and perhaps visualization tools) to locate attacks.
2. Search for interesting data. At this step, some portion of the data set has fo-cused the analyst’s attention either by showing unexpected behaviour, or behaviour that is unexpected at that time of the day (e.g., heavy web browsing at 2 A.M.).
3. Detect suspicious activity. The analyst performs some basic anomaly detection by identifying unexpected behaviour in the previous step, and decides that the event merits further investigation to isolate the root cause and locate other instances of the same type of activity.
4. Event classification. If the suspicious activity has actually compromised hosts or disrupted business continuity, all data related to the suspicious activity is flagged as a security event that must be handled by a Computer Security Incident Response Team (CSIRT).
5. Incident handling. The response team locates infected systems and isolates them from the network. Countermeasures are put in place to prevent the same incident from occurring again.
These steps might vary depending on the size of the security team at a particular organization. This thesis focuses on steps 1-3, where visualization can be used most effectively.
3.3 Data Filtering
Visualization tools can be useful because they are capable of displaying large amounts of data on a single image, and leverage human processing to locate complex patterns and trends. However, when attempting to visualize massive amounts of network data, analysts run into problems with processing this data, generating graphs, and interpreting them. Graphs with massive amounts of data tend to be very susceptible to occlusion, thereby counteracting the main motivation of visualization which is to simplify detection of malicious events.
Our work (published jointly with Mansour Alsaleh and Paul van Oorschot [17]) in the area of data filtering has produced results which are useful for visualization. The exposure maps technique of Whyte et al. [83, 82, 81] is used to identify remote hosts that are more likely to be malicious by using heuristics based on the success of previous connections. Once suspicious hosts are located, they are added to a pool of remote addresses for which flows will be visualized. Comparing the images before and after filtering reveals patterns that were not obvious in the original views. For example, Figure 3.1 (generated from a small university data set) reveals vertical lines in the filtered image. The data that is filtered out of the image corresponds to services that were offered by the destination network, and therefore is classified as expected or legitimate traffic.
This exposure map filtering technique is a good example of how current visualization tools can be improved without requiring access to source code or performing any other modifications to the tool. As noted in Section 2.1.2, the data filtering phase is usually
(a) Unfiltered Image
(b) Filtered Image
Figure 3.1: Scatter plot showing source ports used over time both before and after filtering with the exposure map technique [17].
done after parsing and before data mining. It is therefore critical to select the appropriate filtering technique with caution, to avoid losing important data.
3.4 Monitoring in Real-time
There are millions of Internet-enabled hosts online at any given time. Any single one (or many) could try to attack the network being defended. It is impossible to predict when one of these attacks, be it a massive worm outbreak or a targeted intrusion attempt, will take place. As an example, the Slammer worm (also known as Sapphire) infected 75,000 hosts in 10 minutes in July 2003 [65]. With this in mind, it is safe to say that reaction to an incident must often be quick in order to limit damage and ensure business continuity. Visualizations are used to help the analyst build a mental image of the network and help make decisions quickly in the event of a breach or attack. The mental image may help the analyst in gaining situational awareness [61]. When a network administrator has this mental picture of the current network status, it is easier to decide if an IDS alert or a firewall log message is a false positive or an actual threat worth investigating.
Situational awareness is defined as the perception of environmental elements, the comprehension of their meaning and the projection of their status in the near future. This definition describes three phases: perception, comprehension andprojection [30]. In the perception phase, data is gathered and monitored for interesting activity. The mental model of the network is built at this stage. During the comprehension stage, correlation, analysis and personal expertise are combined to determine if the interesting activity is dangerous enough to pose a threat. The analyst’s mental image of the network is refined as well. Finally at the projection stage, threats are understood in depth, and it is possible for the analyst to forecast related types of incidents, and implement safeguards to prevent those incidents in the future.
An important use of real-time monitoring is event triage. The term triage is more often used in a medical context, referring to the priority with which patients are treated depending on their health status (i.e., when medical supplies are scarce, they will be given to patients with higher possibilities of surviving). Triage in network security is analogous to this concept, and refers to prioritizing alerts and log messages for more accurate response. Just like in the medical context, for analysts to perform accurate
triage, they must have up-to-date information about the event and its context.
Later subsections 3.6.1 and 3.6.2 explain two network security attacks that benefit from real-time visualization for detection and quick response.
3.5 Analysis and Diagnosis
Analysis and diagnosis of network security data implies some form of investigation or research of a particular event. The objective of the analysis is to understand how an attack took (or is taking) place, what resources are affected, and how to prevent a similar attack in the future.
Analysis is important not only in cases where the intrusion was successful, but also when it fails. Understanding trends and changes in attacker behaviour can aid in the correct configuration of network security devices. A good example is firewall configura-tion: when firewalls were first deployed in the early 1990’s, they were generally configured to allow all incoming traffic except specific types of known malicious connections. To-day, most administrators will configure their firewalls to operate in a default-closed mode where incoming traffic is denied unless specified otherwise in a firewall rule.
While real-time monitoring uses dynamic, live data, the analysis phase will typically use somewhat more static data, such as network traces that have been captured and will no longer be changing (due to the analysis of a specific time-window), and logs no longer being added to the set; new information is being recorded elsewhere.
Later subsection 3.6.3 reviews an example attack where data must be analyzed to gain insight into intrusions and intrusion attempts.
3.6 Three Common Classes of Network Security Attacks
In this section we discuss the three common classes of network security attacks which are matched up with specific visualization techniques later in the thesis.
3.6.1 Denial of Service (Monitoring in Real-time) i) High-level Summary
Denial of Service (DoS) and Distributed Denial of Service (DDoS) (expressed as DoS from here on) refer to the act of, through remotely originated actions, making a resource unavailable to its intended users. Resources generally refer to services running on a network enabled host (such as a web server, or a secure shell server). DoS is frequently accomplished by flooding the victim service with a high volume of requests. The server cannot tell the difference between the attacker’s requests and legitimate requests, and with high probability will not be able to answer real requests. This type of attack may go on for a short period of time, or indefinitely, and may be associated with some kind of extortion [60] or other financial exploitation.
As an example, in 2003, the country of Estonia fell victim to several DoS attacks launched from across the globe [4]. The attack led to the shutdown of many government sites, as well as banks and other critical country infrastructure. Other examples of DoS attacks have targeted the root Domain Name Servers (DNS) [9] and large corporations [14].
ii) Technical Details
As the name implies, users can be denied access to many types of services. DoS attacks can been further classified according to the type of resource that is being manipulated. Some classes are as follows.
1. Consumption of computational resources, such as bandwidth, disk space, or pro-cessor time.
2. Disruption of configuration information, such as routing information.
3. Disruption of state information, such as unsolicited resetting of TCP sessions.
Early DoS attacks [64] were based on simple Internet Message Control Protocol (ICMP, a.k.a. ping) flooding, and several other bandwidth consumption related attacks. The objective was to send more data to the server than their bandwidth could handle, saturating their connection and limiting capacity to answer legitimate requests. As In-ternet access became more widespread and access to bandwidth increased, ICMP DoS attacks became less common, largely due to their ineffectiveness.
Other more sophisticated attacks like SYN flooding [64] exploit the network stack of the operating system, by keeping a large number of half-open3 connections active. Operating systems have a limit on how many half-open connections can be kept, and when the limit is reached, no new connections are accepted. Without necessarily flooding the bandwidth, the attack is effectively preventing new connections from being established, and therefore denying service to the users.
Bot networks (or botnets) are computer networks of zombie machines. These com-puters have been taken over by attackers and are being controlled remotely. As of 2009, there have been many denial of service attacks by these zombie networks, presumably controlled by a small number of people. These attacks are particularly difficult to stop because users of the end devices carrying out the attack are frequently unaware that their machine has been compromised.
Attacks by botnets can be considerably more damaging if reflectors [71] are used. A reflector is a host that responds with a new packet when a packet is sent to it. Web servers and DNS servers, for instance, fall under this category. When the zombie machines send spoofed packets to a victim machine, the victim attempts to complete a three-way handshake with a third party server. This amplifies the attack because the third party server will initiate a new connection back to the victim, using up another connection slot.
iii) Defenses
While DoS attacks are largely regarded as unsolvable problems (i.e., the attacker will always succeed as long as his bandwidth is greater than the victims’), there are some mechanisms that help reduce the impact of the attack, or reduce its effectiveness. Ingress filtering [32] will drop any packets that come from non-routable networks such as 10.* or 192.168.*. However, if enough packets with spoofed addresses are sent, then the burden is moved to the inspection of each packet’s source address, and network flooding might still occur. Working with ISPs can also help stop an attack, by dropping packets higher up in the network topology. In the Estonia DoS attack mentioned above, the only way city officials were able to mitigate the attack was by working with local Internet Service Providers (ISP), and temporarily blocking inbound connections originating from outside the country, which made it difficult for the rest of the world to learn what was happening within the borders. It is more difficult to DoS a backbone inter-ISP peering connection that has hundreds of megabits of bandwidth.
iv) Important Variables and Rationale
Any DoS attack that attempts to exhaust bandwidth or CPU resources is likely to hap-pen within a short period of time (i.e., there is no such thing as a low-and- slow flooding attack). The connection flood must remain constant in order for the attack to be suc-cessful, otherwise a simple reboot would be enough to mitigate the attack. Thus, the analyst must have the capacity to detect changes in specific variables corresponding to relevant features of the data set that occur within small time increments. The changes the analyst is looking for to detect a DoS attack are related to networking metrics such as throughput, bandwidth, and port activity. Spikes in any of these measures are common, for example if a backup is started, but these events should be known to the administrator, and can be confirmed as normal when they occur. When several of these variables spike at once, and there is no other legitimate activity scheduled, a DoS may be taking place. For the analyst to detect significant changes in any of the DoS-related variables, there
must be a frame of reference as to how much traffic or activity is normally (as in in conformance to the average) seen. This means that simply displaying how a variable increases or decreases (without reference to the norm or previous values) will not provide the analyst with any insight, unless he can see if it is growing significantly beyond the average.
It is important to note that there may also be DoS attacks which, by sending a small number of packets to the victim, are able to cause the remote service to crash, forcing a manual restart to come back online. In some instances, only a single packet4 or very few are needed to stop a service. In these cases, the analyst is not looking for spikes in activity, but rather the lack of activity on a particular server. In this case as well, the analyst is looking for a deviation from the norm.
Besides the frame of reference, it may also be useful to monitor port statistics. This will help the analyst identify ports that are seeing more traffic, and help decide on mod-ifications to firewall rules. Port information will also reveal if a specific service is being attacked.
Finally one more useful variable is the number of source addresses, and if possible, the geolocation [67] of those addresses. One of the mitigation techniques during a DoS attack is to contact the relevant ISPs of the source hosts and have them limit their throughput or block their connections entirely. Having the capacity to see what countries are harbouring most infected hosts can help speed up response time.
3.6.2 Network Scanning (Monitoring in Real-time) i) High-level Summary
Network scanning is usually the initial phase (reconnaissance) of an attack. If the attacker has no prior knowledge of the network being targeted, an initial enumeration of hosts and services is typically necessary. Scanning involves repeatedly (even if the frequency
4For example, the old Microsoft Windows 95 “land attack” exploit caused computers to crash upon
is very low) probing a remote system to discover what services are listening to incoming connections, and further service discovery will allow the attacker to determine if the discovered service is vulnerable to attack. While there is still debate within the security community as to whether or not scans are precursors to attacks [70], we believe this issue largely depends on the definition of “scan” being used. We also note that attempting to exploit an unknown system would be difficult.
Network scanning is easy to detect when a single host is rapidly probing all ports on a target machine. However, as of 2009, these types of scans are rarely seen, presumably due to the decline of scanning worms such as Slammer [65] and Code Red [66], as well as attackers moving to more stealthy techniques. Also, as we discovered [17], many attackers probe on average at most 4 ports each on a target machine to avoid detection with IDS. It is more common today to see low-and-slow scans (those that happen over an extended period of time), and distributed scans (where many different hosts scan a victim simultaneously).
ii) Technical Details
A simple network scan involves the attacker sending one or more packets to a victim ma-chine and waiting for responses. If the target victim responds and is willing to establish a connection, then the attacker has successfully discovered an open port on the target system. Other responses such as “ICMP destination unreachable” and “TCP resets” might indicate the remote host is up, but not offering that particular service. The basic networking concept behind a TCP scan is the 3-way handshake. An attacker will send a TCP SYN packet to a particular destination port. If that destination port has a service running and accepting incoming connections, the system will reply with a TCP acknowl-edgement (ACK) packet. Once the victim responds, the attacker can optionally complete the three-way-handshake with a TCP ACK packet and establish the TCP session (this is known as a connect scan). Establishing the full TCP session is not always necessary for simple discovery since the victims’ response is enough to detect if a service is listening
or not; if the attacker does not complete the connection, this known as a syn scan or
half-open scan. Scans that look for open ports on a single host are known as vertical scans or simply port-scans, and scans that try to find the same service/port on a range of machines are called horizontal scans orport-sweeps.
A number of difficulties arise when attempting to decide if an incoming connection is a scanning attempt, or simply a benign request. There have been a number of techniques developed to detect scans. Most of these techniques use the concept of detecting n
events in t seconds. For example, Snort [12] and NSM [44] both check if a specific IP address has contacted more than n ports in a specific time period. This technique can help identify aggressive scanners, but will fail at detecting low-slow scanners (e.g., machines that attempt a single connection every day). More advanced algorithms such as Threshold Random Walk (TRW) [52] and exposure maps [83] are capable of detecting more sophisticated scanners, but suffer from high memory requirements and high false positives (under default configurations), respectively.
iii) Defenses
The main defense against network scanning is a properly configured firewall which drops unsolicited incoming connections, and can log connections from different sources. Fire-walls will prevent access to specific hosts/ports, but if a publicly facing service is being offered, then inevitably it will be discovered. The objective of trying to detect scanning is to identify malicious remote hosts before they locate publicly facing services.
There are several intrusion detection systems that can detect specific types of scan-ning, but some preconfigured threshold must usually be set. For instance, Snort will classify a remote host as a scanner if it attempts 4 connections to different ports within a 60 second time window. Bro [3] will monitor the number of half-open connections and failed connection attempts. TRW will give remote hosts a score based on how many successful connections they make in comparison to failed connections. The score of each
remote host is compared to pre-established thresholds that will classify that host as be-nign or as a scanner. Whyte et al. [83] classify a source as a scanner after a single failed connection, under the assumption that a properly configured host should not fail at all.
iv) Important Variables and Rationale
An obvious independent variable for port scan detection is the port number. More specif-ically, it is important to know which ports are being accessed and what protocol is being used. Simple (quick) scans tend to show up very obviously on graphical displays (long horizontal or vertical lines in the case of scatter plots), but low-and-slow scans will not be as clear. For this reason, having the ability to represent data over long time periods is useful. Coordinated and distributed scan detection is more difficult because it requires a wider view of the Internet (i.e., a highly distributed scan can be originating from multiple network blocks scattered over the IP address space).
3.6.3 Brute-force Password Guessing (Analysis and Diagnosis) i) High-level Summary
In brute-force password attacks, services on the Internet that require some form of au-thentication to gain access are bombarded with a constant stream of login attempts. These attempts come from remotely controlled computers trying to guess authentication credentials with the objective of accessing and/or taking over the host. While Telnet and SSH (both used for remote shell logins) are frequently targeted, Telnet lacks some of the security features that SSH provides, so SSH is more widely deployed, and also more frequently attacked [8].
The SANS Institute maintains a list of the top 20 security vulnerabilities and issues. In their late 2008 report [10], SANS describes brute-force attacks as “the most common form of attack to compromise servers facing the Internet”. The impact of this is severe: fully up-to-date systems are just as likely to be compromised as older, unpatched systems if a weak username/password combination is being used.
ii) Technical Details
A brute-force attack is fairly simple to execute. The attack begins with the discovery of a remote service accepting username/password combinations. Once the host has been detected, an automated program will iterate through a dictionary, containing a list of candidate username/password pairs. Common usernames seen in dictionaries include: root, guest, admin, test and mysql. Passwords dictionaries frequently include simple strings like: letmein123, logmein, trustno1 or p4ssw0rd. If the target system rejects some specific credentials, new ones are tested until the attacker gives up, or access to the system is obtained.
Because each failed attempt might get logged, attackers run the risk of being easily detected and prevented from making further guesses. Distributing the attack is one way to overcome the limit, by having n different remote machines attempting unique combinations, but covering the targeted username/password pairs together.
iii) Defenses
According to the SANS institute [10], the best defense against brute-force password guessing is avoiding the use of simple, interactive username/password pairs for logging in to a system. It is advisable to use a stronger form of authentication such as key-based authentication to minimize the risk of a successful break-in. SSH keys are generally at least 1024-bits in length, making a brute-force attack against them very unfeasible. When key-based authentication is not possible, the best defense against brute-force password guessing is to use strong passwords which do not contain dictionary words. It is also helpful to limit the number of guesses a host can attempt in a defined period of time (e.g., 3 attempts every 10 minutes).
![Figure 3.1: Scatter plot showing source ports used over time both before and after filtering with the exposure map technique [17].](https://thumb-us.123doks.com/thumbv2/123dok_us/353731.2538929/35.892.230.714.142.913/figure-scatter-showing-source-ports-filtering-exposure-technique.webp)
![Figure 4.1: Impulse graph displaying the number of unique hosts seen probing a specific port (on any machine in the subnet) each day during the capture period [17].](https://thumb-us.123doks.com/thumbv2/123dok_us/353731.2538929/51.892.242.710.587.885/figure-impulse-displaying-number-probing-specific-machine-capture.webp)
![Figure 4.2: Scatter plot showing source IP and destination port [17].](https://thumb-us.123doks.com/thumbv2/123dok_us/353731.2538929/53.892.131.801.405.910/figure-scatter-plot-showing-source-ip-destination-port.webp)
![Figure 4.3: Existence plot of a host performing network scans [51]. The plot graphs source and destination port numbers vs](https://thumb-us.123doks.com/thumbv2/123dok_us/353731.2538929/54.892.135.809.575.942/figure-existence-performing-network-graphs-source-destination-numbers.webp)
![Figure 4.4: Screenshot of the IP Matrix visualization tool [54]. The most significant 8 bits of the IP address segment are shown on the x-axis in each scatter plot.](https://thumb-us.123doks.com/thumbv2/123dok_us/353731.2538929/56.892.139.814.140.651/figure-screenshot-matrix-visualization-significant-address-segment-scatter.webp)
![Figure 4.5: Screenshot of the NVisionIP tool displaying the mouse-hovering zoom feature [55].](https://thumb-us.123doks.com/thumbv2/123dok_us/353731.2538929/57.892.137.812.149.566/figure-screenshot-nvisionip-tool-displaying-mouse-hovering-feature.webp)
![Figure 4.6: Screenshot of the Portvis tool [63].](https://thumb-us.123doks.com/thumbv2/123dok_us/353731.2538929/58.892.139.811.395.1066/figure-screenshot-of-the-portvis-tool.webp)
![Figure 4.7: 3D visualization similar to the spinning cube of potential doom [17].](https://thumb-us.123doks.com/thumbv2/123dok_us/353731.2538929/60.892.133.812.152.568/figure-d-visualization-similar-spinning-cube-potential-doom.webp)
![Figure 4.8: The Contact Surface graph [36].](https://thumb-us.123doks.com/thumbv2/123dok_us/353731.2538929/61.892.254.707.149.428/figure-the-contact-surface-graph.webp)