This PDF is a selection from an out-of-print volume from the National Bureau of Economic Research
Volume Title: Employment in Manufacturing, 1899-1939: An Analysis of Its Relation to the Volume of Production
Volume Author/Editor: Solomon Fabricant Volume Publisher: NBER
Volume ISBN: 0-87014-040-X
Volume URL: http://www.nber.org/books/fabr42-1 Publication Date: 1942
Chapter Title: Employment, Output and Related Quantities in Individual Industries
Chapter Author: Solomon Fabricant
Chapter URL: http://www.nber.org/chapters/c4876 Chapter pages in book: (p. 83 - 113)
Chapter 4
Employment, Output and Related
Quantities in Individual Industries
IN THE preceding chapter, which was devoted to trends in labor per unit, we found that in five out of every six indus-tries covered by our data there was a reduction in the number of workers employed to make a unit, of product. In turning now to observe the behavior of employment and of output in individual industries, we shall try to determine how growth
in these magnitudes was related to the rate at which their
unit labor requirements declined. Once we have established the relationship, we shall consider what factors might have helped to shape it, and in particular whether growth in capi-tal and reductions in costs and prices have played significant roles in its formation.
EMPLOYMENT, OUTPUT AND LABOR PER UNIT
As one might well expect, individual industries varied
widely with respect to changes in both employment and out-put from 1899 to 1937. At the same time there is observable a high degree of correlation between the trends in produc-tion and in number of workers within particular industries (Table 6). Employment fell to one twenty-fifth in the indus-try making carriages, wagons and sleighs and was multiplied 210 times in automobile manufacture; the same industries supply the extremes for changes in output, the former
regis-tering a decline to one twentieth and the latter an 1800-83
84 MANUFACTURING EMPLOYMENT
TABLE 6
INDIVIDUAL MANUFACTURING INDUSTRIES
Percentage Changes in Physical Output, Number of Wage Earners, and Wage Earners per Unit of
Product, 1899—1937
Wage Earners Physical Wage per Unit of
Industry Output Earners Product
Percentage Change,1899—1937
Foods
Meat packing 66 85 12
Flour —8 —18 —10
Rice 416 241 —34
Fruits and vegetables, canned 792 213 —65
Butter, cheese and canned milk 460 157 54
Beet sugar 1,690 375 —73 Cane sugar 86 29 —30 Ice 668 173 —64 Beverages Liquors, malt 60 19 —26 Liquors, distilled 315 153 —39 Tobacco products Cigars 0.0 —44 —44
Chewing and smoking tobacco —6 —65 —63
Textile products
Cotton goods 101 42 —30
Woolen and worsted goods 60 25 —22
Silk and rayon goods 512 79 —71
Knit goods 506 177 —54
Carpets and rugs, wool 52 8 —29
Cordage and twine 38 7 —23
Jute goods 134 45 —38 Linen goods —44 —43 0.3 Hats, fur-felt 26 —16 33 Hats, wool-felt 90 92 2 Leather produas Leather 61 —3 —40 Shoes 87 52 —19 Gloves 29 —3 —25 Rubber products Shoes 59 28 —20 Paper products
LABOR AND RELATED QUANTITIES 85
Wage Earners Physical Wage per Unit of
Industry Output Peráentage Earners Change, Product 1899—1937
Printing and publishing
Total 494 78 —70
Chemical products
Chemicals, industrial, mc!.
com-pressed gases and rayon 2,500 693 —70
Cottonseed products 63 51 —8
Wood-distillation products 259 184 —21
Explosives 267 20 —67
Fertilizers 248 80 —48
Paints and varnishes 391 228 —33
Salt 82 —3 —47
Tanning and dye materials 292 71 —56
Petroleum and coal products
Petroleum refining 1,920 583 —66
Coke-oven products 380 21 —75
Stone, clay and glass products
Glass 553 50 —77
Forest products
Lumber-mill products —32 —20 19
Turpentine and rosin —32 —22 15
Iron and steel products
Blast-furnace products 171 —41 —78 Steel-mill products 313 162 —36 Xonferrous-metal products Copper - 272 28 —66 Lead 51 —51 —68 Zinc 318 132 —45 Transportation equipment Automobiles, mci. bodies and
parts 180,000 21,300 —88
Carriages, wagons and sleighs —95 —96 —33
Cars, railroad —22 9 39
Locomotives —79 —53 126
Ships and boats —17 33 61
86 MANUFACTURING EMPLOYMENT fold rise.' Though less spectacular than the great increases in the automobile industry, growth in both output and em-ployment was very rapid also in the manufacture of chemi-cals, in petroleum refining and in fruit and vegetable can-fling; and at the other end of the scale there was slow growth or even decline in output and employment not only in car-riages and wagons but in the industries producing railroad locomotives, lumber-mill products, flour, and chewing and smoking tobacco.
While changes in output and employment were closely related, increases in output tended to be greater than the cor-responding rises in employment, as we already know from study of the labor-product ratio. More novel is .the finding, plotted in Chart 15, that the breach between growth in out-put and growth in employment was usually wider among the
rapidly growing industries than among the laggard ones.
This is shown by the fact that the slopes of the regression lines (the dotted lines) fitted to the points in Chart 15 are both greater than 45 degrees (the slope of the solid line). The difference between rate of growth in output and employment is measured also, of 'course, by the decline in workers per unit. This decline was greatest in the automobile industry, which is to be credited also with the greatest expansions in output and employment. In industrial chemicals the product increased 2,500 percent and employment 690 percent, but employment per unit fell by 70 percent, a very sharp' decline indeed. In lumber mills, on the other hand, output actually fell by 32 percent and employment by 20 percent; the result was a 19 percent increase in employment per unit.
There are some exceptions to the general findings just set forth. In meat packing, for example, the number of workers employed increased 85 percent, almost as much as in total
1The coefficient of rank correlation between percentage changes, 1899— in output and employment in the 51 industries listed in Table 6 is .86.
r
-
-LABOR AND RELATED QUANTITIES 87
Chart 15
RELATION BETWEEN INDEXES OF WAGE-EARNER EMPLOYMENT AND OF PHYSICAL OUTPUT, 1937 (1899:100)
100,000 50,000 10,000 5,000 1,000 500 100 50 10 5 Based on Table 6
Index of wage earners employed, 1937 (1699 100)
For an explanation of the tines see the accompanying text Double logarithmic scale
Index of physical output, 1937
(1899 ioo)
88 MANUFACTURING EMPLOYMENT
manufacturing, yet employment per unit of product rose
12 percent. A few other industries also fail to conform to the
dominant pattern. But by and large there was an inverse
relation between change in both output and employment and the movement of labor per unit of product.2
2 The coefficient of rank correlation between change in employment and in
employment per unit is —.31; and between change in output and in
employ-ment per unit of output, —.73. The former coefficient is so low that it scarcely seems to differ significantly from zero. However, it should be noted that errors
of measurement would in themselves tend to cause a positive correlation
be-tween changes in employment and those in employment per unit, and a nega-tive correlation between changes in output and those in employment per Unit.
The relations found above may be checked by fitting regression lines to the logarithms of the points in Chart 15. The lines obtained are as follows,
with Q representing the index of output (1937 on the 1899 base), N the index of employment, and a and A being constants which need not be specified:
IogQ. a + 1.23logN, and
log Q =A+ 1.43 log N.
(Exclusion of the extreme point for automobiles or of the extreme points for
both automobiles and carriages and wagons does not change the slopes of the
regression lines in any important degree.) These equations may be
trans-formed into:
and
or
According to these results, the relation between and N is inverse, as is N
also the relation between and Q. This confirms the signs of the correla-tions given in the preceding paragraph.
As noted above, random errors tend to cause employment (or output) and employment per unit of product to be correlated. It is for this reason that we have studied these relations indirectly, through the data on employment and on output. But the employment and output indexes are also subject to error, and to some extent to common errors. Those the latter type (e.g.,
variation in degree of coverage by the Census) will cause measurable changes
in employment and output to be related. However, these errors affect both indexes to the same relative extent; they therefore tend to cause the slopes of the regression lines to be 45 degrees, not what we find them to be.
LABOR AND RELATED QUANTITIES 89
These relationships are expressed somewhat differently in Chart 16, in which industries are ranked in descending order of increase in output. The bars representing declines in the employment-output ratios shrink from left to right, just as do the bars that stand for changes in output and employment. (If the industries were to be arranged in descending order of increase in employment, we would find a similar order for
output, and an inverse order for employment per unit,
though there would be less regularity of relationship.) In the industries that expanded output rapidly, even a substantial cut in the number of men employed per unit was not usually accompanied by a decline in jobs. In those with only a mod-erate rise in output, a decline in the ratio of men employed to units produced ordinarily meant rather slow growth in
employment, and sometimes actually fewer jobs. On the
other hand, the few industries that increased the number of workers per unit usually reduced the total number of their employees because they were the ones to suffer declines in output.
The same general conclusions apply to the relations be-tween output, aggregate manhours, and manhours per unit of product. According to the records given in detail below
in employment per unit is absent for shorter periods. Indeed, the measurable correlations appear to be mildly positive, though these may easily be due to chance errors of measurement. For output and employment per unit, on the other hand, the correlations are negative even during the shorter periods;
but these results, too, must be qualified because of the possibility of spurious
correlation. The coefficients of rank correlation between percentage changes in employment and employment per unit, and output and employment per
unit, are as follows:
Coefficient of Rank Correlation between Changes in:
Employmentand Output and
Employmentper Unit Employment per Unit
Period of Product of Product
1899—1909 +.17 —.46
1909—1919 +.12
1919—1929 +.os —.57
LABOR AND RELATED QUANTITIES 9'
INDUSTRY
I Automobiles, md. bodies and parts
2 Chemicals, industrial, md. compressed gases and rayon
3 Petroleum refining
4 Beet sugar
S Fruits and vegetables, canned
6 Ice 7 Glass
Paper and pulp Silk and rayon goods Knit goods
Printing and publishing, total Butter, cheese and canned milk Cigars
Rice
Paints and varnishes Coke—oven products Zinc
liquors, distilled Steel—mill products Tanning and dye materials Copper
Explosives
Wood —distillation jiroducts Fertilizers
Blast — furnace products Jute goods INDUSTRY 21 Cotton goods 28 Hats, wool-felt 29 Shoes, leather 30 Cane sugar 31 Salt 32 Meat packing 33 Cottonseed products 34 leather
35 Woolen and worsted goods 36 liquors, malt 37 Shoes, rubber 38 Carpets and rugs, wool 39 Lead
40 Cordage and twine
41 Gloves, leather
42 Hats, fur—felt
Chewing and smoking tobacco 43
44
45 Ships and boats 46 Cars, railroad 47 Lumber—mill products 48 Turpentine and rosin 49 Linen goods 50 Locomotives
51 Carriages, wagons and sleighs 8 9 10 Ii 12 13 14 •I5 IS 18 19 20 21 22 23 24 25 26 Flour Perce niage C change 200 too 0 —20 —40 —60 —80 —90 —95 Based on Table 6 27 28 29 30 31 32 33 34' 35 36 31 38 39 40 41 42 43 44 45 46 47 48 49 50 51 Industry
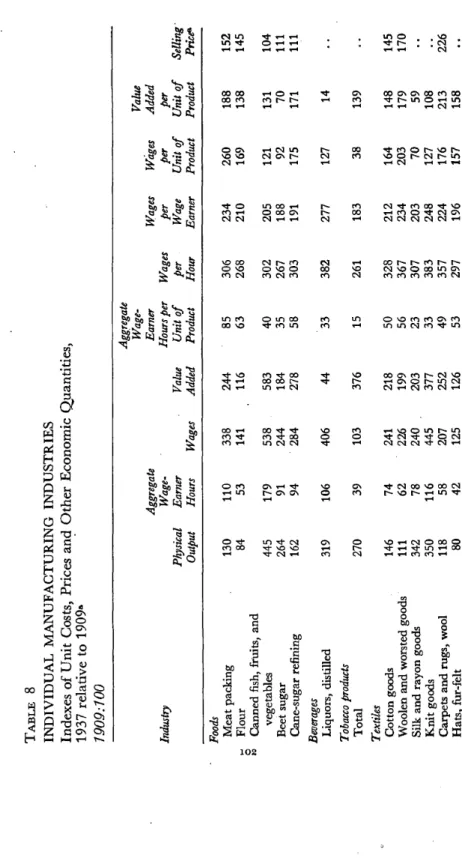
92 MANUFACTURING EMPLOYMENT (Table 8, pp. 102-04),available only for 1909—37 and for fewer than 51 industries, exceptionally rapid growth in output was associated with above-average increase in total manhours and
with unusually drastic cuts in manhours per unit. Slow
growth or actual decline in output was accompanied by less-than-average increase in total manhours and by relatively small declines in the manhour-output ratio.3
The interrelations among trends in employment, in output
and in labor input per unit of manufactured goods pose a
number of problems. They bring into question, for example, the role played by capital investment and other factors of
production in growing and declining industries; the
con-nection between unit labor requirements and wage 'costs; the effect of changes in costs of materials and overhead; the course of selling prices in relation to changes in unit labor requirements. Because of the limited scope of this report and also because data are inadequate, we cannot deal with all these problems, or fully with any of them. In the remainder of this chapter we shall, however, inquire briefly into long-run changes in one kind of capital, namely, that represented by fixed capital assets, and into modifications in hourly earn-ings àf labor, labor costs, value added per unit, and selling
3There is one important difference between the conclusions concerning
change in number of workers and those concerning change in number of manhours. Since hours of labor fell, an above-average increase in manhours
frequently meant a rather slight absolute increase in manhours, while an
above-average rise in number of workers indicated an unusually large
abso-lute increase in number employed. Similarly, a below-average change usually
meant for manhours a rather severe absolute reduction, rather than the slow rate of growth or mild decline that a below-average change indicated for
absolute number employed. (The data in Table 8 apply, of course, to the
shorter period 1909—37, and exclude the decade of expanding output and
employment beginning with 1899. It is partly for this reason that so few
increases in manhours appear in the table. But it is hardly likely that exten-sion of the table back to 1899, if this could be done accurately, would mate-rially affect the conclusion stated in the text.) Thus, only 10 of the 19 indus-tries in Table 8 with above-average increase in output and decline in manhours per unit had increases in manhours, while 17 had increases in
number of wage earners. Of the other 19 industries, 17 were characterized by declines in manhours, and 5 showed rises in employment.
LABOR AND RELATED QUANTITIES 93
prices, in an endeavor to determine the relation between
these developments and those already noted for output, em-ployment and labor per unit. Since the industrial classifica-tion of capital assets varies from that of costs and prices, and because there is no uniformity in the time periods for which data are available, we shall have to treat capital assets apart from the other factors to be reviewed.
CAPITAL ASSETS
A swelling stock of capital goods is only one of the means by which the level of output is raised, and there may be cases of industrial growth in which capital assets have increased only slightly, or not at all. It is conceivable, too, that capital assets, by displacing other factors of production, have grown even in some declining industries. Yet what we can learn of in-dustrial history from the rather crude information at hand bears out the generalization that the expansion of an industry has seldom been accomplished without an influx of capital; and that the aggregate volume of assets in declining indus-tries has, as a rule, contracted. In the automobile industry,
for example, total assets rose from less than $6 million
in 1899 to $1,780 million in 1919. By 1937 automobile
man-ufacturers held over $3,100 million in assets.4 In rayon, another rapidly growing industry, total investment in the
principal companies (measured in this case by stockholders' investment plus long-term borrowing) increased from $8
mil-lion in 1915 to $30 milmil-lion in
1919, $228 million in1929, and $281 million in On the other hand, total
4The figures for 1899 and 1919, which indude assets other than fixed assets,
are taken from the Census of Manufactures; that for 1937 has been obtained from Statistics of income, 1937, Part ii. The last figure covers all assets held by automobile corporations, including investments in business other than
motor vehicles.
Principal rayon companies, covering 99 percent of total production of rayon and 'yarn and staple fiber in 1920, 94 percent in 1929, and 88 percent
in 1937. A Study Submitted by the Federal Trade Commission to the Tempo-rary National Economic Committee, Part 31 (1941), pp. 17982 and 17988.
94 MANUFACTURING EMPLOYMENT
assets held by manufacturers of carriages and wagons, includ-ing materials and parts, amounted to $152 million in 1904, $175 million in 1909, $177 million in 1914, and—despite the great rise in prices—only $97 million in 1919. And for marble and stone work, another industry which reached its peak early in the period, the corresponding figures are: $79
million in 1904; $115 million in 1909; $118 million in
1914; and $113 million in
Allowance for price changes, revaluations, differences in coverage and other incomparabilities in the statistics would modify the contours of these pronounced trends only slightly. Yet this statement is an admission, too, that available data on capital are difficult to interpret when trends are not so well defined as to obviate the need for precise statistics.7 Even from such sparse information as we can command it is pos-sible, however, to make a few observations.
It was noted above that employment rose most rapidly in the industries whose output also rose at record speed. If, in addition, better-than-average increases in output have been associated with a rising volume of capital equipment, as is likely, then growth in capital has coincided with growth in employment more often than with decline in employment. Despite some deficiencies, the available statistics reinforce
this inference. In Table 7 we present percentage changes
between 1904 and 1937 8 in book values of net capital assets and other series for groups of manufacturing industries and
for two individual industries. The capital data are
uncor-rected for price changes, their industrial classification is not
quite identical with that underlying the employment and output data, and the groupings are often rather
heteroge-neous. Yet certain conclusions are obvious. The largest
in-6Figures for both declining industries are from the Census of
Manufac-tures. Data for subsequent years are not available.
7 Appendix E.
8Unfortunately, lack of data prevents comparisons over periods consistent in length with those used in other tables in this volume.
LABOR AND RELATED QUANTITIES 95
TABLE 7
GROUPS OF MANUFACTURING INDUSTRIES
Indexes of Output, Number of Wage Earners, Net
Book Value of Capital Assets and Derived Ratios, 1937 relative to 1904
1904. 100
Wage Capital Capital
.
Physical .
IndustrialGroup Output
Number oj Wage Earners Capital Assetsa (net book value) Earners per Unit of Product Assets per Wage Earner Assets per Unit of Product Foods 281 217 432 77 199 154 Beverages 183 130 188 71 144 102 Tobacco products 313 59 283 19 483 90 Textile products 223 Leather products 147 155 125 230 126 70 85 149 101 103 86 Rubber products .. 294 890 .. 303 .. Paper products 467 212 621 45 293 133
Printing and publishing 386 158 292 41 185 76 Petroleum refining 1,660 496 5,450 30 1,100 329 Chemical and coal products 542 218 443 40 203 82
Stone, clay andglass
proilucts .. 110 363 .. 329 ..
Forest products 100 95 308 95 325 309
Iron and steel products 309 198 432 64 218 140
Nonferrous-metal products .. Electncalmaclnnery .. 175 483 267 781 .. .. 153 162 •. ..
Machinery, other than
electrical 188 258 .. 138 ..
Automobiles, md. bodies .
and parts 36,000 3,980 12,300 11 308 34
Transportation equipment,
other than automobiles 58 76 308 131 407 534
Miscellaneous products .. 162 773 .. 478 ..
TOTAL MANUFACTURING 302 166 438 55 264 145
Sources: The indexes of output are from Appendix F, except that for
chemical and coal products, which was specially computed for this table,
according to our usual procedure. The indexes of wage earners are based on
data in Appendix Table B-I; and those of capital assets are constructed on the basis of information collected in Appendix E.
96 MANUFACTURING EMPLOYMENT creases in employment over the 33-year period 1904—37 occurred in those groups in which fixed capital investment also rose most rapidly. Automobile manufacture, petroleum refining, electrical machinery, chemicals and rubber products stand out in this respect. And among the groups with rela-tively slight growth in employment are also those with less-than-average increases in capital assets: tobacco, beverages, leather, textiles, forest products, and transportation equip-ment (other than automobiles). Exceptions exist, of course— one of them is nonelectrical machinery manufacture—but the correlation remains impressive.9
Not only has there been a strong bond between
employ-ment and capital trends in manufacturing industries, but
there has been a tendency for capital assets per worker, as well as for total capital assets, to rise more rapidly in growing than in declining industries.10 Increase in means of produc-tion—machines, tools, structures—has accompanied rise in output and, at the same time, decline in unit labor require-ments.
Investment lessens employment per unit of product by
increasing the volume of capital assets made available to each worker, and by augmenting the scale of operations and the
volume of output. Since capital additions are likely to be
improvements over existing equipment, investment helps to reduce labor per unit further than would otherwise be the case. Indeed it provides one of the major channels through which technological advances cut into unit labor input. Many
such technological innovations take on concrete form only through changes in the character of new capital goods. Such embodiment of new ideas may occur not only in net addi-tions to capital, but also through the reinvestment of funds freed by capital consumption, such as depreciation, though
9Thecoefficient of rank correlation is .71.
10The coefficient of rank correlation between changes in output and in capital assets per worker is .27. The coefficient of rank correlation between changes in aggregate capital assets and in output is .71.
LABOR AND RELATED QUANTITIES 97 the speed with which improvements in tools, equipment and
structures are put into operation is stepped up when the
stock of capital assets is growing and not merely maintained. Even if the stock of capital assets held by an industry rises less rapidly than employment—and even if aggregate assets (de-flated for price changes) decline—new investment or replace-ment can help reduce labor per unit. Although employreplace-ment fell in relation to output in all groups listed in Table 7, in some of them the rises in book value of capital assets per worker were almost negligible, and in some there were actual declines in capital assets per unit of product."
The conclusions just stated derive quite simply from the premise that improvements are continually being effected in the capital goods utilized by all industries. If we can assume
further that the rate of innovation in techniques has been
greater, on the average, in rapidly growing industries than in the mature or stagnant ones—and this is not at all unlikely— then the rate of increase in the average "quality" of capital goods would usually be higher in the growing industries. Thus capital investment would tend still further to cut unit labor requirements in the thriving industries, and to stimu-late even greater increases in their output.
UNIT COSTS AND PRICES
in preceding pages we have considered certain aspects of the development of manufacturing industries since 1899. We have found that the most rapidly growing industries were, as a rule, those with better-than-average increases in
employ-ment and capital assets as well as output, and with the
11Even the increases in book value of capital assets per worker shown in Table 7 do not all reflect growth in the physical stock of capital goods per worker. Some part of these increases is attributable to the upward movement of prices. Rises of as much as 50 percent in capital assets per worker or per unit of product might easily be accounted for by the price increases between
1904 and 1937. For all manufacturing combined the most acceptable estimate
of the rise in the prices underlying book values of capital assets is around
g8 MANUFACTURING EMPLOYMENT
sharpest reductions in labor per unit. The industries that
lagged in pushing up output were also usually backward in raising the number of their workers and the stock of their capital goods; moreover they tended either to cut labor per unit only slightly or actually to raise it. In this section we shall trace the course followed by unit costs and prices in growing and declining industries, and note how costs and prices have behaved in relation to growth in output and
em-ployment and to decline in labor per unit. First of all we shall describe briefly the pattern we discover among the
changes in the several indexes.
Chart 17 brings together the various quantities for 25
in-dustries: unit wage costs, unit value added (selling price
minus unit cost of materials and fuel), and selling price, in
addition to manhours, output, and manhours per unit—
material already familiar to the reader. By ranking each in-dustry, as we do in the chart, with respect to each of the 6 series,'2 the rather complex picture described by the original
indexes (given in Table 8 below), is seen in a clearer light.
Even a casual glance at the chart indicates a tendency toward similarity of ranks. For example, the automobile
industry ranks high, while lumber manufacture stands low, in respect of each quantity. Averages of the ranks in each row of Chart 17 differ from one another more widely than one would expect if the variation were a matter merely of
chance. 13
A still simpler picture emerges if the 25 industries in
12Unit labor requirements, value added per unit, wage cost per unit, and selling price are ranked in reverse order.
13MiltonFriedman's "method of ranks" (Journal of the American Statistical
Association, Dec. 1937, pp. 675-701) was applied as a test, with the result indicated in the text.
The "coefficient of concordance" for the ranked data in Chart 17 is .57.
Since the value of this ratio approaches unity when all ranks in each row become identical, and zero when they are entirely unrelated (see W. Allen
Wallis, Journal of the American Statistical Association, Sept. 1939, pp. 533-38),
there is an appreciable degree of concordance among the ranks of all six series.
LABOR AND RELATED QUANTITIES 99
I
wLa.hihIiIlLIiIIIIlllhl: — v0c -c v o a: 2?100 MANUFACTURING EMPLOYMENT
Chart 17 are divided into two groups, the 12 in the upper
half with respect to each one of the quantities, and the 13 in the lower half. If the rankings were purely matters of chance, we would expect no pronounced consistency of position.
About one third of the industries would be ranked above
average in respect of three quantities and below average in respect of the other three; about one half consistently above (or below) average for four quantities and below (or above) for two; about one fifth, consistentlyabove (or below) average for five quantities; and the remainder, less than one twen-tieth, consistently above (or below) average for all six quan-tities.14 In fact, we find almost the reverse frequencies. Ten of the 25 industries are consistently high (or low) for all 6 series; 6, for 5 series; 5, for 4 series; and 4 are divided equally. In other words, five industries—automobiles, petroleum re-fining, chemicals, beet sugar and canned foods—are above average in increase in output, increase in manhours of em-ployment, decrease in unit labor requirements, decrease in
wage cost per unit, decrease in value added per unit, and
decrease in selling price of products. Five others—cotton goods, woolen and worsted goods, carpets and rugs, lime, and
lumber—are below average in all these respects. Fertilizers and copper are above average in five respects; meat, flour, leather and shoes, below average in five respects.15
It is clear that a pattern is to be found in the mosaic of changes defined summarily by Chart 17 and in detail by
Table 8. Industries with most rapid rates of growth in output and employment and deepest cuts in labor per unit (three concomitant characteristics, as was noted in earlier sections), are also those with lowest increases (or actual decreases) in wage cost per unit, value added per unit, and selling price.
14 These theoretical frequencies were computed by reference to the
coeffi-cients of the terms in the binomial expansion of ('/2 + ½)6. A slightly more correct procedure would be based on (12/25 + 13/25)6, hut this is hardly
worth while.
15 Some degree of spurious correlation undoubtedly affects these results, but it is impossible to say just how seriously. It is very difficult to believe that the
LABOR AND RELATED QUANTITIES 101 And the laggard industries, in which output and
employ-ment fell or rose but slightly, are characterized not only by rises or modest cuts in labor per unit but also by greater-than-average increases in unit wage costs, in value added per unit, and in selling price.
So much for a summary of the pattern outlined by
Chart 17. A more detailed description of the interrelation-ships defined by the chart will be obtained if we trace the rather devious connection between changes in labor per unit
and changes in volume of output. In the course of this
analysis we shall note (1) how reductions in manhours per 0
unit have tended to coincide with reductions in costs; (2) how
lowering of costs has been associated with downward revisions
of price; and finally, (3) how decline in price has been accom-panied by increase in sales. In studying these links in the chain between labor per unit and output we shall cover all the factors included in Table 8 and mention some others in addition.
The first relationship to be described is that between unit costs and unit labor requirements. Here it is necessary to look into changes in wage rates and their bearing on unit wage costs; and then note the possible effects of changes in non-labor costs, as well as wage costs, upon total costs per unit of product.
Now it is true that reductions in manhours per unit were accompanied by increases in wage cost per unit more fre-quently than by cuts.16 One reason, of course, is the rise in
the general level of wage rates. As the data assembled in
Table 8 indicate, wage rates (measured roughly by average hourly earnings)17 rose in all manufacturing industries be-tween 1909 and 1937, with increases ranging from 87 to 300
16 Labor per unit may be measured either by workers per unit or by man-hours per unit. Workers per unit did not move identically with manman-hours
per unit, but changes in the two are sufficiently proportionate to permit
interchangeable citation in the present context. This is true also of aggregate
employment and aggregate manhours.
17 Average hourly earnings should not be regarded as exact measures of wage rates because, among other reasons, they relate to groups of workers
TABLE 8 INDIVIDUAL
MANUFACTURING INDUSTRIES
Indexes of Unit Costs, Prices and Other Economic Quantities, 1937 relative to 1909a 1909:100
Aggregate Wage-Value Aggregate Earner Wages • Wages Added Industry Physical Output Wage- Earner Hours
Wages
Value Added Hours per Unit of Product Wages per Hour
per Wage Earner per Unit of Product per Unit of Product Selling Prices
Foods Meat packing
130 110 338 244 85 306 234 260 188 152 — Flour 84 53 141 116 63 268 210 169 138 145 Canned
fish, fruits, and
vegetables 445 179 538 583 40 302 205 121 131 104 Beet sugar 264 91 244 184 35 267 188 92 70 111 Cane-sugar refining 162 94 •284 278 58 303 191 175 171 111
Bezierages Liquors, distilled
319 106 406 44 33 382 277 127 14
Tobacco products Total
270 39 103 376 15 261 183 38 139 Textiles Cotton goods 146 74 241 218 50 328 212 164 148 145
Woolen and worsted goods
111 62 226 199 56 367 234 203 179 170
Silk and rayon goods
342 78 240 203 23 307 203 70 59 Knit goods 350 116 445 377 33 383 248 127 108
Carpets and rugs, wool
118 58 207 252 49 357 224 176 213 226 Hats, fur-felt 80 42 125 126 53 297 196 157 158
Aggregate Wage-Value Aggregate Earner Wages Wages Added Industry Physical Output Wage- Earner Hours
-Value Added Hours per Unit of Product Wages per Hour per Wage Earner per Unit of Product per Unit of Product Selling Pricea
Leather products Leather
126 57 191 146 46 334 234 152 116 140 Shoes, leather 143 81 207 214 57 256 178 145 149 193
Paper products' Paper and pulp
328 129 430 474 39 334 237 131 144 154
Printing and publishing Total
286 108 314 355 38 290 234 110 124 .. Chemicals ,
Chemicals, industrial, mci. rayon and compressed gases
1,370 365 1,210 1,190 27 332 227 88 87 85 Cottonseed products 113 78 146 165 69 187 151 129 146 .. Soap 178 80 307 296 45 385 284 173 167 129 Explosives 151 62 200 196 41 322 233 133 131 .. Fertilizers 177 81 206 191 46 254 180 116 108 87 Paints and varnishes 291 176 518 494 61 293 233 178 170 ..
Petroleum and coal products
. Petroleum refining 1,080 392 1,430 1,300 36 365 240 132 120 64
Stone, clay and glass products Cement
158 62 222 334 39 360 225 141 211 160 Lime 112 52 163 197 46 313 229 145 176 168 Glass 361 80 258 412 22 323 225 72 114 153 — 0
a The
base for the index of selling price is 1913.
Sources: The sources for most of the indexes have been
cited
in earlier
tables. The data on value added and wages
were obtained from the Census of Manufactures; and on sell- ing price, from the Bureau of Labor Statistics bulletins on wholesale prices, together with indexes given in Frederick C. Mills' Prices in Recession and Recovery (National Bureau of Economic Research, 1936), Appendix V. extended through 1937 in the present study.
TABLE 8 (concluded) 0 Aggregate Wage-Value Aggregate Earner Wages Wages Added Industry Physical Output Wage- Earner Hours
Wages
Value Added Hours per Unit of Product Wages per Hour
per Wage Earner per Unit of Product per Unit of Product . Selling Pri.cea Forest products . Lumber-mill products 69 47 118 112 68 250 194 171 163 183
Iron and steel products Blast-furnace products
151 39 154 180 25 400 257 102 119 160 Steel-mill products 224 135 478 457 60 354 239 213 204 138 Wire 135 92 329 343 68 357 242 245 255 ..
Nonferrous-metal products Copper
172 76 156 155 44 205 168 91 90 84 Lead 92 42 102 127 45 243 188 110 138 137 Zinc 212 116 398 454 55 344 235 188 215 118
Transportation equipment Automobiles, md.
bodies and parts 5,010 423 1,550 1,280 8.4 368 245 31 26 Cars, railroad 82 65 202 225 79 314 233 246 274 .. Locomotives 20 47 166 199 242 351 276 854 1,020 ..
Ships and boats
109 110 371 357 101 338 242 341 328 ..
LABOR AND RELATED QUANTI'FIES 105
percent. Despite these large advances in wage rates,increases in wage cost per unit of product were low in many industries, and in several there were actual declines in wage cost per unit. Furthermore, and this is the significant conclusion, the industries with low increases or actual declines in wage cost
per unit were those in which manhours per unit were
re-duced most, whereas the largest rises in wage cost per unit occurred in industries with the smallest cuts (or actual in-creases) in manhours per unit. In short, there was an appre-ciable correlation between changes in wage cost per unit of product and changes in manhours employed per Unit.'8 Ac-cording to Table 8 there were seven industries in which wage cost per unit of product declined between 1909 and 1937, despite the fairly considerable rises in the Bureau of Labor Statistics index of wholesale prices (28 percent, 1909 to 1937) and in its index of cost of living (45 percent from 1913, the first year available, to 1937). And it is in these industries— beet sugar, tobacco products, silk and rayon goods, chemicals, glass, copper, and automobiles—that unit labor requirements
fell by exceptionally large percentages.19
The change in an industry's unit labor requirements may
18 The coefficient of rank correlation is .87. Because the two series
corre-lated are not independently constructed (they were derived by dividing
in-dexes of wage payments and of manhours, respectively, by inin-dexes of output) there iS some danger of spurious correlation.
19The coefficient of rank correlation between changes in aggregate man-'hours and in wages per worker is .30. Dr. Wesley C. Mitchell points out that while changes in wages per worker may not be highly correlated with rates of growth in employment or output, average amounts paid in a given year
to workers attached to an industry, whether fully employed or not, may be correlated with rates of growih in employment and output in that year or in the period immediately preceding. For it is likely that workers in
declin-ing industries suffer to an exceptional degree from unemployment, part-time, and short hours, which cut down their annual earnings. It seems safe to
say, however, that some part of the social gains yielded by reductions in real costs per unit seem to have reached workers in every industry, regardless of the particular gains made in the industry employing them, for the coefficient of correlation between changes in unit labor requirements and in wages per
io6 MANUFACTURING EMPLOYMENT exercise considerable influence on its unit labor cost. But it is total fabricational cost, rather than labor cost alone, that may be expected to affect prices and output. And changes in labor costs and in total costs of manufacture are never in precise one-to-one correspondence, because changes in nonlabor costs usually differ from changes in wage costs, and because the proportion of total factory cost accounted for by payrolls varies from industry to industry.20 Yet there has been a strong correlation between changes in the total cost of fabrication and changes in aggregate manhours employed, as well as
be-tween fabricational costs per unit and unit labor
require-ments (Table 8).21 Despite the rise in wholesale prices already
mentioned, value added (costs of fabrication, including
profits) per unit fell in 6 industries, 5 of these being among those which cut wage cost per unit. Just as unit labor require-ments declined most in the industries that grew most rapidly in terms of output, so the value added to each unit fell most (or rose least) in the advancing industries; and in the back-ward industries, just as unit labor requirements shrank least, so value added per unit also declined least.22 The obvious explanation is that labor cost constitutes an important por-tion of the total costs of fabricapor-tion. It is possible, too, that nonlabor factory costs tend to drop more sharply in rapidly growing, than in stagnant, industries. If this is true, and the data on capital assets previously discussed seem to suggest that
20 See Charles A. Bliss, The Structure of Manufacturing Production, A Cross-Section View (National Bureau of Economic Research, 1939), pp. 63 and 70. Dr. Bliss shows in his detailed analysis of the Census data [or 1929
that wage costs ranged from less than 5 percent of value of product to
slightly more than 55 percent, and from less than 10 percent of value added
(value of product less cost of materials and fuel) to a top figure of 65 percent. 21 The coefficient of rank correlation between unit labor requirements and
fabricational cost per unit (measured by value added, the difference between
value of products and cost of materials) is .78.
22 relation between growth in outpu.t and change in value added or
value per unit is discussed in more detail in Chapter 5 of The Output of Manufacturing Industries, 1899—1937 (National Bureau of Economic Research,
LABOR AND RELATED QUANTITIES 107
it then reductions in nonlabor costs per unit would tend to augment, rather than to offset, the effects of reductions in unit labor requirements.
Up to this point we have lookea into the relation between
labor per unit and costs of fabrication per unit. We have
found that the in which labor per unit fell drasti-cally are also those in which wage cost per unit of product usually fell or rose less than the average, arid that the value added by these industries per unit (i.e., their unit costs of fabrication, including profits) was reduced or pushed up only slightly in comparison to the increase in total value added per unit in all factories. Industries in which reductions in labor per unit lagged were also slow to reduce unit wage costs and costs of fabrication per unit.
The next link in the chain we are tracing between unit
labor requirements and output is that between unit costs of fabrication and unit prices. Here the relation is quite natu-rally affected by the cost of materials per unit of product, by the character of the particular industry, and the prevailing state of competition. The unit cost of materials is a function not only of the price of materials, but also of the amount of
materials consumed per unit of product.' But changes in
prices of materials and savings in materials used per unit are too complex to be dealt with summarily. It is also impossible to remark both briefly and accurately upon the extent of, and the industrial variatiOn in, the degree of monopoly. Aside from the weighty theoretical problem of measuring monopoly power, there are the serious practical difficulties arising not only from the lack of statistical data but from the changing status of individual industries in respect of the control they can exercise over the relation between their unit costs and their prices. Ironically enough, the very fact that an industry may be highly integrated makes it impossible for the Bureau
io8 MANUFACTURING EMPLOYMENT of the Census to publish separate data for it without revealing confidential information. For this reason the aluminum in-dustry, among others, has never been shown separately in the Census of Manufactures.24 Despite the paucity of data, there is no doubt that material costs and price controls, as well as changes in costs of fabrication, affect selling prices, and that they do so in varying degree from industry to industry. Here also, therefore, there is loose articulation in the structure of the relationships we are tracing, and considerable room for varia-tion, as is observable from the indexes of selling prices col-lected in Table 8. Owing to gaps in the data, the indexes of selling prices cover the period 1913—37 rather than 1909—37, but the difference of 4 years is hardly likely to affect the
results appreciably. Outweighing by far this slight disadvan-tage is the fact that the indexes of selling prices were obtained from a non-Census source.25 There is therefore no danger of spurious correlation, so that one does not tend to question the fairly considerable degree of correlation found to exist
between changes in value added per unit and in selling
prices.26 Between wage cost per unit and selling price, and between unit labor requirements and selling price, too, the correlation is fairly definite.27
So far we have seen that industries at the head of the list with respect to reductions in manhours per unit are also, as a rule, those with greatest reductions in unit costs of fabrica-tion and selling prices. The final link between labor per unit and output is the connection between selling price and out-put. This relation depends on the nature of the demand for the product, which is conditioned, of course, by the prices
24Up through 1937 aluminum production was included in "industrial
chemicals," and beginning with 1939 in "primary nonferrous metals."
25Prices could have been derived from Census reports, and for practically
all industries for which output data are available, but the advantage of an independent source would have been lost.
26The coefficient of rank correlation is .57.
The coefficients of rank correlation are, respectively, .49 and .89. These
LABOR AND RELATED QUANTITIES 109
of related commodities, whether competitive or
tary. Thus the demand for gasoline at a specified price de-pends on such variables as the number of motor cars com-peting for road space, the price of rubber tires, and so on; and the nature of the demand for lumber is a function of the price of steel, brick, and cement, as well as of wage rates in the construction industry. Since elasticities of demand vary from industry to industry and period to period, no single or rigid relation between the trends we have analyzed is to be expected. Yet the correlation between changes in output and those in selling price is quite definitely negative, and fairly substantial (Table 8).28
Actual cuts in selling price, despite the average rise in
wholesale prices, were effected in the industries producing fertilizers, copper, chemicals, petroleum products and auto-mobiles. The last three increased their output far more than
the other industries listed in the table. The first two also
pushed up production more than the remaining industries for which we have indexes of selling prices. The greater in-creases in price, on the other hand, apply to those products,
notably lumber and flour, which usually either lagged in
growth or actually declined.
The foregoing analysis has proceeded from change in unit
labor requirements to change in output, in an attempt to
trace the connection between them. We have observed that rate of decline in labor per unit has been associated with rate of decline in unit cost of fabrication; that costs of fabrication, in turn, have fallen or risen with selling price; and finally, that selling price has dropped most precipitately in industries in which output has climbed most rapidly. The causal
se-quence may run in the other direction as well. Growth in
output, whatever the initial stimulus, will tend to eventuate in economies of large-scale production, one of which
fre-quently is a reduction in unit labor requirements. Capital
110 MANUFACTURING EMPLOYMENT equipment is more readily acquired when output is rising. As we have noted above, there is a fairly strong correlation
between trends in output and in capital assets.
Organiza-tional changes are more easily introduced in growing indus-tries. Even the rate of improvement arid innovation in equip-ment, methods and organization may be stimulated morein growing than in' declining industries. In this concatenation
of relationships, also, we find reason to anticipate some
degree of correlation (though not a high one) between de.
dine in employment per unit of output and growth in
output.
We have now completed a rather sketchy survey of the in-tricate chain of relationships between changes in unit labor requirements and changes in output. We have said nothing, however, about the character of the equally complex relation between changes in manhours of employment and in unit labor requirements. It will be remembered that these also have been negatively correlated, just as have changes in out-put and in unit labor requirements.
The basis for an understanding of the inverse relation
be-tween labor per unit and manhours is implicit in the
evi-dence already presented in Table 8. We can develop it
fur-ther by taking explicit note of one aspect, not previously
mentioned, of the relation between trends in unit labor re-quirements and in output, and showing how it illuminates the relation between trends in unit labor requirements and in manhours. The fact to be observed is that movements in labor per unit, in contrast to output movements, were tightly
clustered together. The changes in labor per unit ranged, for the industries listed in Table 8, from a decline of 92
percent to a rise of 142 percent, whereas the changes in
out-put varied from a drop of 80 percent to a gain of 4,900
percent. That is, extraordinarily large increases in output, relative to the average change in output, were associated with
comparatively moderate decreases in unit labor
LABOR AND RELATED QUANTITIES 111 while large declines in output (again compared with the
average change in• output) were associated with relatively moderate declines in manhours per unit. This relation is not difficult to explain. New uses for a product develop after its unit labor requirement, initially, and its price, eventually, have fallen, and old uses formerly too costly for wide appli-cation no longer are impracticable. It is probable, too, that the industries with the most rapid rates of growth are also predominantly those whose. products are characterized by demands elastic with respect to income or price or both. Even
moderate reductions in labor per unit and thus in selling
price would then be accompanied by large increases in out-put. It is this that explains why trends in unit labor require-ments have been negatively correlated with trends in man-hour employment, as well as with trends in output.2°
Employment trends, it should be apparent by now, are an important thread in the pattern of industrial development
20Let us consider the relation that would exist between labor per unit and employment if the degree of variation in labor per unit equaled or exceeded
thee degree of variation in output (remembering always, of course, that labor per unit and output are negatively correlated). Let us suppose, first, that
given percentage changes in output (relative to the average change) were negatively associated with changes of like degree in unit labor requirements (also measured by reference to the average). In this case, there would be no significant correlation, positive or negative, between trends in unit labor requirements and trends in manhours. This does not mean that manhours
would not fall in relation to output, but rather that manhours would not
rise more rapidly (or less rapidly) in industries drastically cutting unit labor requirements than in those reducing these requirements, only moderately.
Now suppose that given percentage changes in output (relative to the average
change) were negatively associated with changes of greater degree in unit labor requirements (measured against the average). In this case, the corre-lation between trends in manhours and in unit labor requirements would
be positive rather than negative. Especially drastic declines in unit labor
requirements would then be associated with relative declines in manhours of employment rather than with relative rises; and conversely for especially moderate declines in labor per unit of product. In fact, however, neither of these cases is to be found. The degree of variation among changes in unit
labor requirements was neither greater than, nor equal to, the degree of
variation among changes in output. The former was less than the latter. As
a consequence, then, changes in 'unit labor requirements were negatively
cor-related with changes in manhours of employment.
To restate the argument, a negative correlation between trends in unit
112 MANUFACTURING EMPLOYMENT described in this chapter. Employment shot up most rapidly, as a rule, iii manufacturing industries characterized by speed of technological change, by influx of capital at rates in excess
of average investment, by particularly sharp cuts in unit
labor requirements and unit labor costs, by lowered (or only slightly increased) selling prices and by especially rapid ex-pansion in output. Employment tended to rise slowly or
actu-ally to decline in industries where innovation was slow, capital investment was moderate or absent, unit labor
re-quirements and unit wage costs fell only slightly or moved upward, selling prices were raised rather than lowered, and output lagged or declined.
The above analysis of changes during specific periods,30 namely, the three or four decades preceding the present war,
with a. positive, negative or zero correlation between trends in manhours and
in unit labor requirements. Let
log = a — b log Q, in which N is employment (manhours)
and Q is output, while a and b are parameters. If b is positive, then in the
derived relation
N a b
log
b may be either positive or negative, depending on whether b is greater
1—b
or less than unity. Whether both correlations are negative or not depends, therefore, on the magnitude of the slope of the line of relationship between trends in unit labor requirements and in output. This slope is, in fact, less than unity, as is reasonable on a priori economic grounds.
30Itshould be stressed that the preceding analysis has merely touched upon
certain crucial problems. investigation is definitely indicated; in
par-ticular, one should tap other sources for independent series of hourly earn-ings and unit labor requirements (i.e., series not derived from the data on output and employment, but obtained from different sources), expand the
number of industries examined, study other periods of time, and seek to
include data on costs and quantities of materials and other nonlabor factors
of production. It would be desirable, too, to explain more fully the high
degree of variation that seems to characterize the relationships noted. Not all industries with rapidly declining unit labor requirements, for example, have expanded output rapidly; nor have all industries with rapidly declining unit
labor requirements cut their selling prices more than industries in which
AND RELATED QUANTITIES 113
suggests a more or less systematic relationship between the level of employment in an individual industry and its stage of growth. Not all industries were in the same phase of de-velopment during these years—some were coming into being, some were reaching their prime, some were beginning to fade from the economic scene. The relations between em-ployment and stage of growth are explored in the following chapter.