BOFIT
Discussion Papers
Eugene Nivorozhkin
The dynamics of capital structure in
transition economies
2003 • No. 2
Bank of Finland
Institute for Economies in Transition
, BOFIT
Mr Timo Harell, editor Press monitoring Timo.Harell@bof.fi
Ms Liisa Mannila, department secretary Department coordinator
Publications traffic Liisa.Mannila@bof.fi
Ms Päivi Määttä, information specialist Institute’s library
Information services Paivi.Maatta@bof.fi
Ms Tiina Saajasto, information specialist Statistical analysis
Statistical data bases Internet sites
Tiina.Saajasto@bof.fi
Ms Liisa Sipola, information specialist Information retrieval
Institute’s library and publications Liisa.Sipola@bof.fi
Economists
Information Services
Mr Pekka Sutela, headRussian economy and economic policy Russia’s international economic relations Baltic economies
Pekka.Sutela@bof.fi
Bank of Finland
Institute for Economies inTransition, BOFIT PO Box 160 FIN-00101 Helsinki
Contact us
Phone: +358 9 183 2268 Fax: +358 9 183 2294 E-mail: bofit@bof.fi Ms Seija Lainela, economistRussian economy and economic policy Seija.Lainela@bof.fi
Mr Jouko Rautava, economist Russian economy and economic policy Jouko.Rautava@bof.fi
Mr Jian-Guang Shen, economist Chinese economy and economic policy Financial crises
Jian-Guang.Shen@bof.fi Ms Laura Solanko, economist Russian regional issues Public economics Laura.Solanko@bof.fi
Ms Merja Tekoniemi, economist Russian economy and economic policy Merja.Tekoniemi@bof.fi
Ms Tuuli Koivu, economist Baltic economies
Tuuli.Koivu@bof.fi
Mr Tuomas Komulainen, economist Russian financial system
Polish economy Currency crises
Tuomas.Komulainen@bof.fi
Mr Iikka Korhonen, research supervisor Baltic economies
Issues related to the EU enlargement Iikka.Korhonen@bof.fi
Mr Vesa Korhonen, economist
Russia’s international economic relations
Russia’s banking system
Issues related to the EU enlargement
BOFIT
Discussion Papers
2003 • No. 2
Bank of Finland
Institute for Economies in Transition
, BOFIT
Eugene Nivorozhkin
The dynamics of capital structure in
transition economies
BOFIT Discussion Papers 2/2003
Eugene Nivorozhkin
The dynamics of capital structure in transition economies
ISBN 951-686-852-5 (print) ISSN 1456-4564 (print) ISBN 951-686-853-3 (online) ISSN 1456-5889 (online)
Suomen Pankin monistuskeskus Helsinki 2003
Contents
Contents...3
Abstract ...5
Tiivistelmä...6
1 Introduction ...7
2 Countries in transition: Czech and Bulgarian economies during 1993-1997...8
2.1 The Czech Republic...9
2.2 Bulgaria...10
3 Model ...11
4 Dependent and explanatory variables ...12
4.1 Measures of leverage ...12
4.2 Explanatory variables ...13
4.3 Speed of adjustment...15
5 Data, estimation procedure and results ...16
5.1 Data...16
5.2 Estimation procedure ...17
5.3 Results...18
6 Conclusions and directions for future research ...21
References ...24
All opinions expressed are those of the author and do not necessarily reflect the views of the Bank of Finland.
Eugene Nivorozhkin *
The dynamics of capital structure in transition economies
Abstract
This paper uses a dynamic unrestricted capital structure model to examine the determinants of the private companies’ target financial leverage and the speed of adjustment to it in two transition economies, the Czech Republic and Bulgaria. We explicitly model the adjust-ment of companies’ leverage to a target leverage, and this target leverage is itself explained by a set of factors. The panel data methodology combines cross-section and time-series information. The results indicate that the Bulgarian corporate credit markets were less sup-ply-constrained than those of the Czech Republic during the period under investigation. Bulgarian companies adjusted much faster to the target leverage than Czech firms. The speed of adjustment related positively to the distance between target and observed ratio for Bulgarian companies while the relationship was neutral for Czech companies. The conser-vative policies of Czech banks and the exposure control were likely responsible for the slower adjustment among the larger companies while the opposite were true for Bulgarian banks and companies.
-(/&ODVVLILFDWLRQ1XPEHUV: G30, G32, O12, O52
.H\ZRUGV: capital structure; leverage; dynamic adjustment model; the Czech Republic; Bulgaria
____________________________
The earlier draft of this paper was presented at the conference on “Building Financial Institutions and Markets in Central and Eastern Europe”, Poznan, Poland, May 1999 and published in CERGU’s Project Report Series No 00:5, June 2000, Center for European Research, Gothenburg University, Sweden.
I thank Clas Wihlborg and Shubhashis Gangopadhyay for valuable comments and helpful suggestions. Almas Heshmati’s help with computer programming is gratefully acknowledged. The usual disclaimer applies.
* Eugene Nivorozhkin, Department of economics, Gothenburg University, Box 640 SE 405 30 Göteborg, Sweden, tel. +46 31 7731370, fax +46 31 773 1043, e-mail: econneug@economics.gu.se
Eugene Nivorozhkin
The dynamics of capital structure in transition economies
Tiivistelmä
Tutkimuksessa käsitellään yksityisten yritysten todellista ja tavoitevelkaantumisastetta Tšekissä ja Bulgariassa. Lisäksi selvitetään, kuinka nopeasti yritykset saavuttavat tavoite-velkaantumisasteensa. Työssä mallinnetaan sekä se, kuinka yritykset valitsevat velkaantu-misen tavoitetason että se, kuinka ne saavuttavat sen. Tutkimuksessa käytetään paneelida-taa, jossa yhdistyvät poikkileikkaus- ja aikasarjaulottuvuudet. Tulosten mukaan yritys-lainamarkkinoiden tarjonta ei Bulgariassa ollut yhtä rajoitettua kuin Tšekissä. Bulgariassa sopeutumisnopeus korreloi positiivisesti tavoitevelkaantumisasteen ja todellisen tason etäisyyden kanssa, kun taas Tšekissä tätä yhteyttä ei ollut. Pankkien konservatiivisempi lainapolitiikka Tšekissä aiheutti todennäköisesti hitaamman sopeutumisen tavoitetasoon. Bulgariassa asia oli päinvastoin.
1
Introduction
The basic objective of any corporate finance study of capital structures is to identify factors explaining the firms’ decision with respect to its financial leverage. Starting with Miller and Modigliani (1958), the finance literature recognized that there is “no magic in lever-age”, which means that if there exists an optimal financial structure for a company then it should reflect some specifically identified market imperfections1. The extent of various imperfections may vary across time and is affected by both internal and external factors to the firms. This implies that the capital structure of a firm is likely to be sub-optimal to a varying extent at any point in time. In the dynamic perspective the effects of various fac-tors result in heterogeneous leverage targets for the firms and different abilities to reach these targets.
This paper adopts the dynamic model developed in Banerjee, Heshmati, and Wihlborg (1999) and is close in nature to the target adjustment models used in empirical studies of capital structure choice, such as, for example, Jalilvand and Harris (1984). In these models, random events change actual capital structures, but transaction costs force firms to work back only gradually towards desired capital structures2. The approach of Jalilvand and Har-ris (1984) is different from the one here in two key respects. First, it emphasizes the inter-actions across a wider range of financing decisions such as issuance of long-term debt, issuance of short-term debt, maintenance of corporate liquidity, issuance of new equity, and payment of dividends, and second, firms in their model partially adjust to proxies for long run financial targets. The model in this paper simultaneously endogenizes the adjust-ment factor as well as the target and looks only at the firm’s decision with respect to its financial leverage.
The introduction of an endogenous adjustment factor and target leverage helps to avoid the shortcomings of many capital structure studies. First, these studies explain the variation in observed leverage while theoretical models relate to optimal (target) capital structure. Second, the studies typically do not capture the nature of dynamic capital struc-ture adjustments.
We use firm-level panel data to examine the dynamic adjustment of capital structures in two transition countries, the Czech Republic and Bulgaria. The dynamic model is found to provide more insights into the behavior of companies than a simple static model. Al-though the determinants of the target leverage in both countries were rather similar, results for the adjustment indicate that the Bulgarian corporate credit markets were less supply-constrained than those of the Czech Republic during the period under investigation. Bul-garian firms adjusted much faster to the target leverage than Czech firms. The speed of adjustment related positively to the distance between the target and actual leverage ratios for Bulgarian companies while the relationship was neutral for Czech companies. The conservative policies of Czech banks and exposure control were likely responsible for the slower adjustment among the larger companies while the opposite were true for Bulgarian banks and companies.
The remainder of the paper is organized as follows: Section 2 discusses some issues of studying the transition economies and describes Czech and Bulgarian economies during 1993-1995; Section 3 describes the dynamic adjustment model of capital structures;
1 Harris and Raviv (1991) provide a survey of the theoretical and empirical literature on capital structure and systematize exogenous and endogenous factors influencing the capital structure.
2
It should be mentioned that the papers rarely mention transaction costs and usually start by accepting the Modigliani and Miller Proposition I, which assumes that transaction costs are second-order.
tion 4 proceeds with the selection of dependent and explanatory variables of the model; Section 5 discusses the data set, estimation procedure, and the empirical results. Section 6 concludes.
2
Countries in transition:
Czech and Bulgarian economies during 1993-1997
This paper uses firm-level panel data from two transition economies – the Czech Republic and Bulgaria. This section will shortly discuss the issues related to the studies of transition economies of Central and Eastern European countries (CEECs) and provide a description of some developments in the economies of our choice relevant to this study.
The main issue in the study of the transition economies is to modify available theories to take into account peculiarities of such economies. In our case it means incorporating factors related to market imperfections particular to the transition economies to explain firms’ choice of financial structure.
The financial reforms in transition have the following common goals (Anderson and Kegels (1998)):
1. Imposing financial discipline 2. Decentralization
3. Introducing competition
4. Information for investment decision 5. Establishing investors’ control rights 6. Reconciling conflicting interests
The success or failure in reaching the above goals can explain incentives of borrowers and lenders in the countries we study and the consequent patterns in financial structure of firms.
The choice of countries for our empirical analysis was primarily dictated by the avail-ability of the data that allows us to conduct an empirical study. Luckily for us as research-ers, the countries under our investigation exhibited significant differences in their respec-tive transition paths and in the degree of success with reforms (see next section). That het-erogeneity between Bulgaria and the Czech Republic allows us to check its potential im-plications for the structure of companies’ financing and to apply the existing theories (stylized facts) to explain them. The period we study, 1993-1997 covers a substantial part of transition and is characterized by large changes in the macroeconomic and institutional environment in both countries. These changes are identified in the next section and incor-porated into subsequent analysis.
Next we look at the economic developments of the Czech Republic and Bulgaria and describe the macroeconomic environment in both countries during the 1993-1997 as well as the issues related to the financial and enterprise sector development.
2.1
The Czech Republic
According to Prime Minister Klaus, by the end of 1995 the Czech Republic had progressed to the "early post-transformation stage" (The Banker (February 1996)). In October 1995 the government fully liberalized all current account transactions and freed many capital account transactions, thus achieving convertibility in terms of the International Monetary Fund’s article VIII. In the following month, the Czech republic became the first among Central and Eastern European countries to join the Organization for Economic Cooperation and Development (OECD). In the same month, it was graded "A-stable" by Standard & Poor’s.
During all of 1993-1997, the Czech economy was characterized by low unemploy-ment, decreasing (to single digit) inflation and stable exchange rate3 (see Table 1 in Ap-pendix). Recognizing the so-far successful transformation of the Czech economy, foreign direct and portfolio investment kept on rising bringing the cumulative total since the tran-sition began in 1990 to over $5 billion.
The restructuring of Czech industries was characterized by the relatively low level of direct government support reflecting the general philosophy of the government "to leave things to the market". This strategy did not seem to work with respect to the bankruptcy law. Banks and other creditors appeared to be reluctant to initiate the bankruptcy proceed-ings for a long while. Between late 1992 and May 1995, a total of 4,500 bankruptcy peti-tions were filed but only 600 bankruptcies declared.
In 1995, the second and final wave of the Czech Republic’s voucher privatization pro-gram was completed boosting the share of the domestic product generated by the private sector to 76 per cent (see Table 3 in Appendix).
During the period under our investigation, the Czech banking sector was characterized by the active role and dominance of foreign banks both in the corporate and investment markets. In order to protect domestic middle-sized banks and promote their consolidation the National Bank in late 1993 temporarily halted the issuance of new banking licenses. This policy did not pay and, with a forthcoming bid for EU membership, the restrictions were lifted in 1996.
The beginning of the transition (prior to the period we consider) was generally char-acterized by the tight credit conditions. In 1991, total credit growth was lower than infla-tion (Anderson and Kegels (1998)). On the other hand, the credit flows shifted dramati-cally from public sector enterprises towards private enterprise. According to the Czech National Bank (CNB (1997)), the banking sector created necessary conditions for the ini-tial start-up of the economy, but at the same time it took on high risk, which was reflected in the following years in the low quality of its credit portfolio. The credit growth of the banking sector remained moderate in the later years, ranging between 5-10 percent in real terms4. As in 1996, the growth of total credits was lower than that of total assets as a result of the bank’s attention to strengthening liquid assets in the structure of their total assets. This trend continued on into 1997 resulting from the consistent pressure for the creation of provisions and stagnation of credit activity because of the banks’ increased prudence in granting new credit (CNB (1997)).
3 By the end of 1995, the Czech crown was pegged to the $/DM currency basket with the fluctuation band limited to 0.5 percent.
4
The estimates are based on Anderson and Kegels (1998), CNB (1997) and own calculations. Note that the credits to private sector grew much faster.
2.2
Bulgaria
Bulgarian macroeconomic reform lagged behind most of the transition countries in the region during 1990-1997. Most of the period was characterized by a decline in economic activity, with the cumulative fall in GDP reaching 37 percent (see Table 4 in Appendix). The annual rates of inflation were increasing dramatically throughout this period (see Ta-ble 2 in Appendix). The general macroeconomic environment was very volatile primarily due to inconsistent policy and the government’s inability to implement structural reforms.
In contrast to the Czech Republic, from the beginning of the transition, Bulgaria relied extensively on foreign debt from both official and private sources. As a consequence, there were a larger number of constraints imposed on its macroeconomic policy in the later years.
The progress of Bulgaria’s privatization was extremely slow up to late 1996 when the first wave of Bulgarian mass privatization took place. Its design was similar to the voucher privatization program in the Czech Republic.
In 1995, after a period of extreme macroeconomic instability that involved high infla-tion and the sharp depreciainfla-tion of the lev in March 1994, Bulgaria, practically for the first time since the beginning of reform, entered a period of financial stability with tight mone-tary and fiscal policy. By the end of 1995, the inflation was low, price controls had been abolished, and consumer goods subsidies eliminated.
Despite these positive changes, Bulgaria was still isolated from the international capi-tal markets due to the lack of agreements with the IMF and the World Bank. It was also burdened by increased interest payments on the Brady bonds issued to restructure and re-schedule Bulgaria's external debt to the London Club.
Moreover, improved growth and financial stability were not complemented by suffi-cient structural reform. The privatization program was implemented very slowly and the biggest loss-making industrial and commercial firms in the state sector continued to be subject to soft budget constraints. The losses made by state firms led to liquidity pressure on the banking sector. The National Bank of Bulgaria was facing a tradeoff between an anti-inflationary monetary policy and the protection of payment system by bailing out in-solvent banks. When the latter option was chosen the amount of the uncollateralized credit channeled to the banking system became too large to be sterilized fully by open market operations. This, in turn, was putting pressure on the foreign exchange market with an in-creasing number of depositors switching to cash holdings in foreign exchange. In the pres-ence of ineffective open market operations, the central bank had to increase interest rates and impose higher reserve requirements. The beginning of 1996 saw a sharp increase in the interest rate and a depreciation of currency. By the end of 1996, the basic interest rate had reached a record level; the country's official reserves had been reduced by more than a half, and the lev depreciated by more than a hundred percent in nominal terms (see Table 2 in Appendix).
Facing all of the above problems, the Bulgarian government realized that it would not be able to reach their solution without dealing with the problems of the loss-making core of the state-owned industrial sector. In May of 1996, the Bulgarian government announced its plans to close down 64 loss-making firms responsible for 30% of all losses. Another 68 loss-making firms were to be placed under rehabilitation programs.
Another issue facing the government was rehabilitation and restructuring of the banking sector. One factor was the presence of too many banks. Banks had to be consoli-dated and merged to improve their stability and solvency. Meanwhile, most of the banks in both the state and private sectors were treated as house banks by firms in the same area or
by firms who held shares in the bank. Consequently, in 1995, the National Bank reported that the banking system as a whole lost Leva 23.2 billion ($330 million) and, again in total, had a negative capital base. Only 22 banks achieved the required 8 percent capital ade-quacy ratio (The Banker (October 1996))5.
According to an IMF Staff Country Report, “the Bulgarian banking crisis of 1996 re-sulted from a combination of the weaknesses in governance in banks and enterprises which allowed asset stripping and the establishment of private banks to engage in insider lending; the general economic instability during the transition period; and ineffective recapitaliza-tion” (IMF (1999), p. 84).
3
Model
A model of Banerjee, Heshmati, and Wihlborg (1999) capitalizes on the idea of endoge-nous leverage targets for firms and a potential intertemporal sub-optimality of actual finan-cial leverage due to costly adjustments to a target capital structure.
Let the target leverage ratio of a company Lat time W, /LW, be determined by the fol-lowing function:
/LW )<LWW (1)
where <LW is a vector of firm specific variables, and W is the time trend.
This specification insures that target leverage may vary across firms and over time due to variations in underlying factors. The fact that the target debt ratio of a particular firm can change over time stresses dynamic aspect of the capital structure problem.
A process of costly adjustment in firm's leverage is modeled by the following relationship:
/LW/LW δLW/LW/LW (2)
where δLW is an adjustment parameter lying between zero and one.The parameter δLW itself can be a function of some variables including previous years leverage. /LW and /LW are ob-served leverage in year W and Wrespectively.
In the absence of capital market imperfections, the parameter δLW would be equal to 1 implying that the change in actual leverage between two consecutive periods should be equal to the desired one. The imperfections mentioned above basically mean that it is costly for a firm to adjust to a target capital structure. Adjustment costs can be both fixed and variable and they stem from the capital market imperfections (problems of unobserved actions (moral hazard) and/or asymmetric information (adverse selection)).
We can rewrite equation (2) as:
/LW δLW/LWδLW/LW (3)
/LW and δLW can be assumed to have the following functional form:
/LW EΣMEM<MLWΣWEWW (4)
δLW FΣNFN=NLWΣWFWW (5)
where <MLW is a MWK factor at time W explaining the target leverage of firm L at time W, and
=MLW is a NWK factor at time W explaining a speed of adjustment to the target leverage of firm L
at time W.
According to our specification, a firm’s manager uses information at the end of period
W to set up a target leverage for this period implying “perfect forecast” abilities of the man-ager. An alternative would be to use information at time W assuming that the manager is not forward looking at all. The empirical results appeared to be robust to both approaches.
4
Dependent and explanatory variables
In this section we will specify a possible set of variables for the model. We will suggest proxies for companies' leverage as well as select factors that can explain its variations and adjustment speed.
4.1
Measures of leverage
The primary concern with respect to the choice of leverage proxy is the usage of book ver-sus market data for its measurement. To the extent that market values are more accurate descriptions of future cash flows and their risks, it would be preferable to use them in the analysis of capital structure choice. Unfortunately, only a small fraction of assets is traded regularly in most of the countries. Moreover, for the listed companies it is only possible to come up with a market value of equity since the companies' debt is usually non-traded or traded only infrequently. Therefore, the best a researcher can normally do is to calculate the quasi-market values of leverage. In addition, market values often fluctuate dramatically making it difficult to use them both in empirical research and in management’s implemen-tation of financial policy. The data set used in this paper contains both listed and non-listed companies and therefore we use the book values from the companies’ financial statements. The choice of leverage proxy also depends on the objective of analysis. The alternative theories of capital structure suggest various proxies to measure leverage. We intend to study factors influencing availability and a level of debt financing as well as factors influ-encing adjustment of companies to their target leverage. An appropriate measure of finan-cial leverage, given the scope of our study and the available data, could be the ratio of debt
(both short term and long term) to total assets. An alternative measure that corrects the previous one for the effect of the gross trade credit would be the ratio of total debt to net assets, where net assets are total assets less accounts payable and other liabilities. This last measure may underestimate the company leverage by including assets held against pension liabilities. Our final and perhaps best measure of leverage is the ratio of total debt to the sum of total debt and shareholders’ equity ('().
4.2
Explanatory variables
Alternative theories of capital structure as well as previous empirical work in this area al-lows us to select a set of explanatory variables that could likely affect target leverage.
The explanatory variables of the model fall into two broad categories: stocks and flows. The first group includes various proxies describing the size and structure of compa-nies’ assets and liabilities while the second group describes the firms’ cash inflows and outflows.
One candidate to the set of explanatory variables is the proportion of tangible fixed as-sets in total asas-sets – WDQJLELOLW\ (7$1*). The higher proportion of tangible assets is posi-tively related to the availability of collateral, which in turn may reduce the agency costs of debt6. The importance of collateral increases in cases where businesses are newly estab-lished and have no close ties to creditors. These arguments suggest a positive relationship between tangibility and a firm's leverage7. Indeed, the results for developed countries (Ra-jan and Zingales (1995), Titman and Wessels (1988)) uniformly confirm this. On the other hand, there are a number of factors limiting the importance of tangible assets as collateral in the CEECs. First, underdeveloped and inefficient legal systems may hinder the creation of enforceable debt contracts. In case of default, the recovery of collateral may be costly and lengthy. Second, thin and illiquid secondary markets for firms’ assets create uncer-tainty about their "recoverable" market value. Therefore, the above two factors suggest weak or no relationship between tangibility and leverage. Finally, the maturity structure of debt liabilities might influence the relationship between fixed tangible assets and leverage. In other words, the companies match the maturities of their assets and liabilities and the higher proportion of tangible assets correspond to the higher level of long-term debt fi-nancing but not necessary total debt fifi-nancing. This phenomenon may be expected to be more profound in the emerging markets of CEECs where the lack of long-term debt fi-nancing (but the presence of the short-term one) may result in the negative relationship between target leverage and tangibility.
Both theoretical and empirical studies argue for the relevance of a firm’s sL]H as a de-terminant of the optimal debt capacity. The arguments based on the presence of fixed di-rect bankruptcy costs and the diversification effects predict a positive relationship between optimal leverage and the firm’s size. The former argument simply says that a fixed direct bankruptcy cost constitutes a smaller proportion of a larger (more valuable) firm while the latter argument points out that the larger firms may face lower probability of bankruptcy
6 This cost is related to the incentive of stockholders of leveraged firms to invest suboptimally to expropriate wealth from the firm’s bondholders (Jensen and Meckling (1976), Myers (1977).
7
The alternative theory (Grossman and Hart (1982)) is able to explain the negative relationship based on the argument that the increased amount of uncollateralized (more risky) debt would increase the monitoring by lenders. That would alleviate the conflict of interests between firm’s shareholders and self-interested managers. Given well-publicized evidence of poor corporate governance structures in CEECs we rule out that explanation of the relationship between tangibility and leverage.
because they may be better diversified (Warner (1977), Titman and Wessels (1988)). On the other hand the larger, more mature firms may be the subjects of less asymmetric infor-mation. This factor would tend to increase their incentives to raise equity instead of relying on debt financing8.
The size of a company in the transition economies instead of being a financial variable may instead capture “the social importance” of a firm. As a result, a large firm may be provided with favorable treatment from the creditors due to implicit (or explicit) guaran-tees from the authorities. In addition, the structural changes in the economies of CEECs had likely led to some form of restructuring undertaken by companies. To the extent that this restructuring requires financing, the relative importance of larger companies may re-sult in their easier access to debt. We use the logarithm of total assets as a proxy for the company’s size (6,=() and anticipate a positive relationship between the size and debt tar-gets.
In addition to borrowing from financial institutions, firms may be financed by their suppliers. Theory and empirical tests (e.g. Rajan and Petersen (1996)) suggest that firms may use relatively more trade credit when financial debt is not available. Moreover, firms with better access to debt from financial institutions may offer more trade credit. We con-trol for the effect of trade credit on the target levels of debt by including the ratios of trade credit to sales (7&6) and trade debt to sales (7'6). The evidence found for the industrial countries is expected to be reinforced due to the larger market imperfections in the credit markets of the CEECs.
Alternative theories offer competing arguments with respect to the role of SURILWDELOLW\ in the firm’s financial decision. Pecking order theory (Myers and Majluf (1984), Myers (1984)) relies on the presence of asymmetric information between “insiders” and “outsid-ers” of the firm to predict a negative relationship between leverage and profitability. Firms will turn to debt only after they exhaust internal funds. Static trade-off theory9 would pre-dict a positive relationship based on the presence of tax-shields. Higher profitability would imply more income to shield.
Cornelli, Portes, and Schaffer (1996) point to the high profit tax over GDP ratio and the low bankruptcy costs in CEECs, which make the tax advantage of debt particularly important for profitable companies. What is often missed in the argument is that the tax shields have significant value only for companies with relatively high and stable income. In other words we have to think of “the expected realizable value of the tax shields on an extra dollar of promised future interest payments” (Myers (1999)). This amount will de-pend on the probability that the firm will have taxable income and on its marginal tax rate. Therefore, the higher economic uncertainty of transitional countries may significantly de-crease the tax advantages of debt. In addition, in equilibrium, the tax advantages of debt are usually offset (at some level) by the risk of costly bankruptcy. The often-used argument is that the low bankruptcy costs of the transitional countries may lead to a higher desired level of leverage (at least for profitable companies). A closer look at the nature of the bankruptcy costs helps us to understand why this does not have to be the case. From the point of view of the companies’ managers, the costs of financial distress are low because of imperfections of the legal system. The default on interest and principal payments on debt does not necessary trigger the prompt bankruptcy (insolvency procedure). But by the same token, it makes the costs of distress high for the creditors. In the end, these expected
8
It is rather hard to form expectations with respect to equity financing. The stock market in both countries is, at best, serves only a function of a market for corporate control and it is far from being an alternative source of financing for the companies. Nevertheless, the companies might have different excess to private equity and also differ in the profit retaining policies.
ruptcy costs are incurred by firms in the form of higher interest payments on debt. At some level of debt financing, the supply side of the market (banks) might start using the quanti-tative restrictions (credit rationing) instead of pricing. Overall, the “low bankruptcy costs” may lead to an increase wedge between the costs of internal and external funds which would likely lead profitable firms to choose retained earnings over the debt financing.
We use the ratio of net income to total assets as a proxy for company profitability (352)) and expect to obtain a negative relationship.
Another possible explanatory variable is LQFRPHYDULDELOLW\. This measure does not di-rectly relate to any theoretical result but was used in a number of empirical papers (Titman and Wessels (1988), Friend and Lang (1988)). We calculate the variance of operating in-come for each firm in the sample during the period 1993-1997 (952$). It is supposed to account for the effect of riskiness of the firm's cash flow on the target level of debt financ-ing. On the supply side the banks are likely to control their credit risks by credit rationing rather than by using a range of interest rates or prices. In these circumstances the higher income variability may lead to a lower level of indebtedness. On the demand side the risk attitude of the firms’ managers may have an effect on the relationship between volatility of income and target leverage. The potential financial distress implied by a higher variability of a firm’s income may lead a risk-averse manager to have relatively lower debt targets.10 The weak insolvency laws and their enforcement in the economies of CEECs may result in a lower risk-aversion of the managers with the corresponding higher debt targets. Taking into consideration all factors the expected effect of the income variability on leverage tar-gets is positive for both countries and perhaps more pronounced in Bulgaria.
The firms in our sample represent a wide array of industries. Based on the first digit of their primary US SIC code we created dummy variables to control for the effect of LQGXV
WULDOFODVVLILFDWLRQ on the level of target debt ratio. The literature points to both the nature of the business of firms in different industries and the differences in regulation as being responsible for “the industry effect” (Titman (1984), Guedes and Opler (1996)).
Our data set include both the joint-stock companies and private partnerships. We con-trol for heterogeneity across these groups by including the dummy variable /(* and hav-ing it take the value of one if the firm is a joint-stock company and zero otherwise.
4.3
Speed of adjustment
This section identifies the factors influencing the speed of adjustment of companies to their optimal capital structures. These factors are expected to matter once we realize that the adjustments of capital structure are costly and these costs may vary across firms. These costs are likely to have both fixed and variable components.
Recognizing that the speed of adjustment toward the optimal capital structure is likely to depend on how far the firm is from the optimum, we included variable ',67$1 equal to the absolute value of difference between last period’s actual capital structure and the next period’s optimal, _/LW±/LW_The speed of adjustment is expected to be higher the further away the company is from its target capital structure.
The speed of adjustment can also be influenced by the VL]Hof the firm. In fact, in-cluding this variable is equivalent to testing the presence of adjustment costs, which were not captured by the variable ',67$1. A number of arguments can justify the use of “size”
10
The degree of a risk-aversion would be influenced by the personal wealth diversification of a manager as well as by the labor market conditions for the managers.
as factor influencing the costs of adjustment. First, the fixed costs of changing capital structure are proportionally smaller for larger firms. Second, the larger firms may be less rationed due to smaller informational asymmetries. The expected sign of this variable is therefore positive.
We also control for the legal form of the company (variable /(*$/) in the equation for speed of adjustment.
5
Data, estimation procedure and results
5.1
Data
The data used in this study is a firm level company accounts database complied by “Bu-reau Van Dyck”, Amadeus (January, 1999). The data set includes a wide array of informa-tion on the companies including the annual balance sheet, profit and loss account and in-dustry classification. Companies included in Amadeus satisfy the following criteria: oper-ating revenue of at least 8 million USD, total assets of 16 million dollars or more than 100 employees. Some smaller companies can also be included if there are some serious reasons for that. Thus, it is mostly the largest firms, which are represented in the sample.
We select two former socialist economies: Czech Republic and Bulgaria. Taking into account the well-known problem of excessively large size of industrial enterprises in the socialist economies one can assert that the Amadeus sample is representative of a signifi-cant share of these countries’ industries.
Given the dynamic nature of our model we selected companies with five consecutive years of reports with non-missing statements. We also removed from the sample the com-panies with the negative equity. Finally we ended with 667 comcom-panies for Bulgaria and 596 Czech firms for the period of 1993-1997. Tables 5 in and 6 in Appendix illustrate the cross-industry distribution of these companies and provide summary statistics for the vari-ables in the data set.
5.2
Estimation procedure
The model we estimate takes the following form:
Lit = (1- δLW) L it-1 + δLW L*it + ηLW (6)
where /LW is the ratio of debt to the sum of debt and equity ('$), and ηLW is an error term. The target ratio of debt to shareholders’ equity, /LW, and the speed of adjustment, δLW, are modeled by the following linear relationships:
L*it = E + ΣjEM Yjit + Σt btt + ΣsEVSIC (7)
where the vectors of explanatory variables, <MLW includes the following variables:
• income variability (VROA)
• profitability (PROF)
• tangibility (TANG)
• size (SIZE)
• trade creditors (TCS)
• trade debtors (TDS)
• legal form dummy (LEG)
• time dummies (T95-T97)
• US SIC dummies (IND1, IND2, IND3, IND4, IND45, IND7)
and the vector Zjit includes:
• distance (DISTAN)
• size (SIZE)
• legal form dummy (LEG)
• time dummies (T95-T97)
• US SIC dummies (IND1, IND2, IND3, IND4, IND45, IN')
For comparative purposes, we also estimated the static model that relates the observed lev-erage ratio to the set of explanatory variables:
Lit = E + ΣjEM Yjit + ΣtEWt + ΣsEVSIC+eit (9)
The dynamic model is estimated separately for two countries using non-linear regression procedure11. The model is flexible which leads to possible negative estimates of the firms’ target leverage. These negative values were replaced by zero in each iteration prior to the calculation of distance between the target leverage in period W and observed leverage in period W
The data is the pooled cross-section time series data for each firm over the period 1993-1997. As a dependant variable we use the ratio of total debt to the sum of total debt and shareholders’ equity (DE). The summary statistics for dependent and explanatory vari-ables are provided in Table 6 in Appendix.
11 We use the nonlinear regression procedure (PROC MODEL) of SAS (Statistical Analysis System, version 6.12) to compute least squares estimates of the parameters of the nonlinear model. The modified Gauss-Newton method is used.
5.3
Results
Tables 7 and 8 in the Appendix report the results of estimation of the dynamic and static capital structure model for the Czech Republic and Bulgaria.
According to our results, higher operating profit variability has a negative effect on the Czech companies’ debt targets and a positive effect on the Bulgarian ones. The first result is similar to the findings for the developed countries12 while the latter is different. Why do we observe a different pattern in Bulgaria? Effectively the debt represents the put option on company assets and the interest paid is the premium. The value of this option increases with the increase in the volatility of the underlying assets but that would also imply an upward adjustment in the premium. At some level of volatility the creditor might prefer to use the quantitative restrictions on the amount lend. The positive sign of 952$ for Bulgaria might be an indicator of the lax lending policies of the Bulgarian banks and the segmented credit market where mispriced debt led to the riskier companies setting higher leverage targets. The result indicates that the Bulgarian firms’ debt targets were demand driven while the supply side effect dominated in the Czech Republic.
The profitability variable (352)) has a strong negative effect on debt targets in both countries. The results support the pecking order theory of finance indicating that in general the firms, which are lacking internal funds, would like to close the gap by setting higher targets for debt. The static model indicates that lower profitable firms do reach these lever-age targets and exceed the high profitable companies in their reliance on debt. We com-plemented this result by including the ratio of net current assets as an explanatory variable in the regression13. The coefficient is negative and significant indicating that the decrease in the proportion of current assets not funded by the debt (lack of liquidity) positively af-fects the debt targets. We also tried to include the profit margin variables in the model14. Again, the coefficient was negative and significant.
The tangibility of the companies’ fixed assets (7$1*) has a negative effect on the debt targets. This finding is in line with the evidence from the previous studies (Cornelli, Portes, and Schaffer (1996), Hussain and Nivorozhkin (1997), and Nivorozhkin (2002)). The interpretation of the result, though, significantly differs across papers. The more real-istic one is in the Nivorozhkin (2002) who concludes for the sample of Hungarian compa-nies that the observed relationship is the result of “maturity matching” on the balance sheet. The long-term debt is likely to be used for the investment in the fixed assets while the short-term debt is matched by the current assets. The lack of long-term debt financing in the CEECs leads to the domination of short-term debt effect in the regression with the total debt. The role of the tangible assets as collateral might still exist but does not imply a higher level of WRWDOGHEWILQDQFLQJ for more “tangible” companies.
Size of the companies is positively related to the target leverage in both countries. Even though the size of the company is closely related to tangibility, these variables cap-ture different phenomenae of the firms’ financing. The size of the company most likely serves as a stability proxy for creditors. In the economies of CEECs, the large companies are also the likely targets of government bailout due to higher social costs imposed by their distress. Quite often the large companies are subject to some form of
12 Banerjee, Hesmati, and Wihlborg (1999) obtain a negative coefficients for this variable in the sample of US and UK companies.
13
This result is not reported.
sponsored investment programs. The financing within these programs can take the form of guarantees or direct financing15.
According to our results the higher proportion of trade credits on the Bulgarian firms’ balance sheets decreases their debt targets indicating the substitution between these two forms of financing. The coefficient of 7&6(the proportion of trade credits in total sales) is negative in all regressions for Czech companies but significant only in the static model. The amount of extended trade credits as a proportion of total sales (7'6) positively affects the actual and target leverage in the Czech sample but the relationship in the Bulgarian sample is neutral. One of the specifications of the model included the ratio of net trade credits to revenues as an explanatory variable16. The coefficient was negative and signifi-cant for both countries. Our results are somewhat mixed but indicate that the credit ration-ing is likely to be relatively more persistent when it comes to financial debt as opposed to the trade credits. This is due to the fact that the latter might be more closely related to the production and distribution process and often harder to avoid in the supplier-customer re-lationships. Who is then extending those trade credits? Our results for Czech Republic in-dicate that the firms with higher target and actual debt levels do have higher account re-ceivables, which are supposedly someone else’s trade credits. The overall results indicate that the firms with better access to debt financing use less but may extend more of the trade credits as a proportion of their sales relative to other companies. This further indicates the existence of the substitution between intermediated debt and trade credits.
Controlling for the legal form of the companies in our samples produces rather sur-prising results. The joint-stock companies have lower leverage targets than private partner-ships in Czech Republic and all other legal forms in Bulgaria. The proportion of non-join-stock companies is rather small in both samples – 11 percent in the Czech sample and 15 percent in the Bulgarian one. The simple statistics for two subgroups based on the ex-planatory variables of our model did not reveal any clear patterns. The final relationship is likely to be the result of several factors working in different directions. One possible ex-planation is the different profit-retaining practices of the two groups of companies. The joint-stock companies tend to be manager-owned to a lesser extent than private partner-ships and therefore might have greater incentives to maximize the free cash flow by re-taining more profits.
The time trend is insignificant in the target leverage equations for both countries ex-cept for one year in Bulgaria17. It is worth mention that all time dummies continued to be insignificant in the static model for Czech Republic but all coefficients in Bulgarian model are positive and significant. The more erratic and pronounced time trend in Bulgaria may be attributed to its earlier stage of transition relative to Czech Republic and a volatile mac-roeconomic environment during the period we investigate.
When we look at the equations for the speed of adjustment (Table 7 and 8, Panel B) we find that the significance and the signs of parameters differ across the models. The co-efficient of variable ',67$1 is significant and positive in the Bulgarian sample and insig-nificant in the Czech one. An increase in the distance from actual to target leverage in-creases the speed of adjustment of the Bulgarian companies and has a neutral effect on adjustments of Czech companies. According to our hypothesis it indicates that the large adjustments of leverage were less costly relative to a smaller ones in Bulgaria but the dis-tance to targets did not play an important role for the Czech companies. One explanation of
15 This direct financing could be channeled through the banking sector.
16 It was defined as a difference between trade creditors (TCS) and trade debtors (TDS) divided by total sales. 17
The Wald test rejects the hypothesis of the Bulgarian time dummies coefficients jointly equal to zero at 1% level.
this result could be the lower variance of the distance between target and observed leverage for the Czech companies. In fact, the results indicate that the Bulgarian companies’ targets were fluctuating substantially more over time relative to the Czech ones (see Table 9 and 10, panel C in Appendix).
The size of the companies appeared to influence the speed of adjustment to target lev-erage in opposite directions in two countries. It increases the speed of adjustment to target leverage in Bulgaria but decreases it in the Czech Republic. This supports the stylized fact of political forces behind bank’s lending policies with the resulting better excess to debt financing of larger Bulgarian firms (see Section II of this paper). The more conservative policies of the Czech banks are probably responsible for the inability of larger companies to adjust to the same extent as the smaller firms since the lending to a larger firm usually implies a higher exposure for a bank18.
As indicated by the coefficient of variable /(*$/ in the adjustment equation, the pri-vate partnerships adjust faster than the other ownership forms toward their target leverage in Bulgaria and slower in Czech Republic. The results are puzzling and perhaps have to be investigated in a separate study.
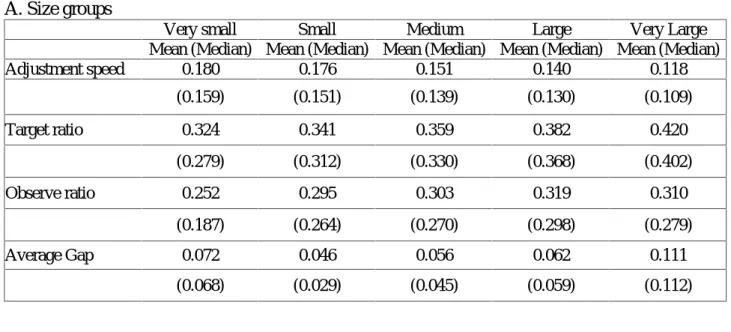
Next we investigate the speed of adjustment and the gap between observed and target leverage across five size groups (see Table 9 and 10 in Appendix). The speed of adjust-ment appears to be much greater for Bulgarian companies relative to the Czech companies – over 40 percent in Bulgaria relative to maximum of 18 percent in Czech Republic. The median firm within each size subgroup tends to adjust slower toward the target than the average firm but the dispersion is quite small. The companies in all size groups appeared to be on average below the target leverage during the whole period under investigation and the median firm’s gap within each size subgroup tend to be smaller then the average one.
The adjustment speed and the average gap exhibit some variation across industries but the differences are rather small. An interesting observation is that the median company in an industry with 866,& has an actual leverage in excess of the target one in both coun-tries. This industry code covers the company specializing in the wholesale and retail trade. The results are not surprising given that these sectors of the transition economies expanded perhaps the most.
The speed of adjustment exhibits some substantial non-monotonic changes over time capturing the economic shocks during the period we consider. In general, the Bulgarian companies adjusted faster but did not get systematically closer to their debt targets.
6
Conclusions and directions for future research
In this paper we investigated the patterns of financial development of private corporations in the transition economies of Bulgaria and the Czech Republic during the period of 1993-1997. Differences between these two countries in the success of reforming their economies allowed us to inspect various implications for the companies’ finance.
We adopt a dynamic adjustment model where firms endogenously choose target level of leverage and adjust to it over time with an endogenous speed. This setup stresses the idea that firms’ goals and the strategies of achieving them vary over time and depend on the persistence of various market imperfections.
Our results support the theoretical conjecture: the target leverage and the speed of ad-justment fluctuate over time. The direction of these changes is traceable to the firm char-acteristics, macroeconomic environment of the country, and the policies of financial inter-mediaries.
The dynamic model is found to provide more insight into the behavior of companies than a simple static model. Although the determinants of the target leverage in both coun-tries were rather similar, results for the adjustment indicate that the Bulgarian corporate credit markets were less supply-constrained than those of the Czech Republic during the period under investigation. Bulgarian companies adjusted much faster to the target lever-age than Czech firms. The speed of adjustment related positively to the distance between the target and actual leverage ratios for Bulgarian companies while the relationship was neutral for Czech companies. It seems tat the conservative policies of Czech banks and exposure control were responsible for the slower adjustment among the larger companies while the opposite were true for Bulgarian banks and companies.
One disadvantage of our dynamic target adjustment model pointed out in earlier stud-ies (Myers (1989) referring to Shyam-Sunder (1988)) is that it typically does not do better relative to other dynamic models in discriminating among alternative theories of optimal capital structure. In particular, our type of models work fairly well if one assumes that the static trade-off theory holds and that each firm has a well defined target debt ratio. Unfor-tunately, the models often work equally well when the firm has no long-run target and fol-lows a pure pecking order strategy (as in our model). Rephrasing, the dynamic adjustment models do not seem to provide support for the static trade-off theory against the competi-tor. This paper does not test whether it is true for the data on hand but the future research is warranted.
References
Anderson R.W. and C. Kegels (1988), “Transition Banking: Financial Developments of Central and Eastern Europe”, &ODUHQGRQ3UHVV, Oxford.
7KH%DQNHU, “The Second Time Around”, February 1996
7KH%DQNHU “Showdown in Sofia”, October 1996
Banerjee, S., Heshmati, A. and C. Wihlborg (1999), “The Dynamics of Capital Structure”,
:RUNLQJ 3DSHU1R , SSE/EFI Working Paper series in Economics and Finance, Stockholm Scholl of Economics.
IMF (1999), “Bulgaria: Recent Economic Developments and Statistical Appendix”, ,0)
6WXIIFRXQWU\UHSRUWNo. 99/26, April 1999.
Coase R.H. (1937), “The Nature of the Firm”, (FRQRPLFD4, 386-405.
Cornelli F., Portes R., and M.E. Schaffer (1996), “The Capital Structure of Firms in Central and Eastern Europe, &(35'LVFXVVLRQ3DSHU1R.
Czech National Bank (1997), “Banking Supervision in the Czech Republic”, Czech National Bank Report.
Friend I., and L. Lang (1988), “An Empirical Test of the Impact of Managerial Self-Interest on Corporate Capital Structure”, -RXUQDORI)LQDQFH 43, 271-281.
Grossman S.J. and O. Hart (1982), “ Corporate Financial Structure and Managerial Incentives”, in J. McCall, ed.: 7KH (FRQRPLFV RI ,QIRUPDWLRQ DQG 8QFHUWDLQW\, University of Chicago Press, Chicago.
Guedes, J. and T. Opler (1996), “The Determinants of the Maturity of Corporate Debt Issues”, -RXUQDORI)LQDQFH 51(5), 1809-33.
Harris M. and A. Raviv (1991), “The Theory of Capital Structure”, -RXUQDORI)LQDQFH46, 297-355.
Hussain, Q., and E., Nivorozhkin (1997), "The Capital Structures of Listed Companies in Poland”, ,0):RUNLQJ3DSHU:3.
Jalilvand A. and R. Harris (1984), “Corporate Behavior in Adjusting to Capital Structure and Dividend Targets: An Econometric Study, -RXUQDORI)LQDQFH39(1), 611-625. Jensen M.C. and W.H. Meckling (1976), “Theory of the Firm: Managerial Behavior,
Agency Costs, and Ownership Structure”, -RXUQDORI)LQDQFLDO(FRQRPLFV3,305-360 Masulis R. W. (1988), “The debt/equity choice”, )LQDQFLDO 0DQDJHPHQW $VVRFLDWLRQ
6XUYH\DQG6\QWKHVLV6HULHV, Cambridge, Mass.: Harper and Row, Ballinger.
Miller M.H. and F. Modigliani (1958), “The Cost of Capital, Corporation Finance and the Theory of Investment ”, 7KH$PHULFDQ(FRQRPLF5HYLHZ 48, 261-297.
Myers S.C. (1977), “Determinants of Corporate Borrowing”, -RXUQDO RI )LQDQFLDO
(FRQRPLFV 5, 147-175.
Myers S. C. (1989), “Still Searching for Optimal Capital Structure”, in “Are the Distinctions between Debt and Equity Disappearing? ”, 3URFHHGLQJVRID&RQIHUHQFH
+HOGLQ2FWREHU, Federal Reserve Bank of Boston.
Myers S.C. (1999), “The Search for Optimal Capital Structure”, in H. Chew, Jr., ed.: 7KH
1HZ &RUSRUDWH )LQDQFH :KHUH 7KHRU\ 0HHWV 3UDFWLFH, Second Edition, Irwin McGraw-Hill.
Myers S.C., and N. Majluf (1984), “Corporate Finance and Investment Decisions When Firms Have Information That Investors Do Not Have”, -RXUQDO RI )LQDQFLDO
(FRQRPLFV 13, 187-221.
Nivorozhkin, E., (2002), “Capital Structures in Emerging Stock Market: the Case of Hungary“, The Developing Economies Volume 40, Number 2.
Petersen, M., A. and R. Rajan (1997), “Trade Credit: Theory and Evidence”, 5HYLHZ RI
)LQDQFLDO6WXGLHV 10(3), 661-91.
Rajan, R. and L. Zingales (1995), “What Do We Know About Capital Structure? Some Evidence from International Data”, -RXUQDORI)LQDQFH50(5), 1421-460.
Shyam-Sunder, L. (1988), “Essays in Corporate Financing”, Ph.D. dissertation, MIT Titman, S. (1984), “The Effect of Capital Structure on a Firm's Liquidation Decision”,
-RXUQDORI)LQDQFLDO(FRQRPLFV13 (1), 137-51
Titman, S, and R. Wessels (1988), “The Determinants Of Capital Structure Choice”,
-RXUQDORI)LQDQFH43(1),1-19
Warner J. (1977), “Bankruptcy Costs: Some Evidence”, -RXUQDORI)LQDQFH32, 337-47. Williamson O.E. (1981), “The Modern Corporation: Origins, Evolution and Attributes”,
Appendix
Table 1. The Czech Republic: Selected macroeconomic indicators (1990-1998)
Indicator 1990 1991 1992 1993 1994 1995 1996 1997 1998
Nominal GDP ($bn) 32.3 25.4 29.9 34.3 39.7 50.3 56.6 52.9 56.8
GDP per capita PPP ($) 9526 8721 8951 9273 9794 10531 11211 11566 10787
GDP (% change) -1.2 -11.5 -3.3 0.6 3.2 6.4 3.9 1 -2.7
Industrial production (% change) -3.3 -22.3 -7.9 -5.3 2.1 8.7 1.8 4.5 2.2
Budget balance (% of GDP) - -1.9 -3.1 0.5 -1.2 -1.8 -1.2 -1 -1.6
Unemployment (%) 0.8 4.1 2.6 3.5 3.2 2.9 3.5 5.2 7.5
Average monthly wage ($) 183 129 164 200 240 307.8 356.4 333.4 362.8
Inflation (%) 9.7 56.6 11.1 20.8 10 9.1 8.8 8.5 10.7
Exports ($bn) 5.9 8.3 8.4 13 14 21.5 21.7 22.8 26.4
Imports ($bn) 6.5 8.8 10.4 13.3 14.9 25.1 27.6 27.2 28.9
Trade Balance ($bn) -0.7 -0.5 -1.9 -0.3 -0.9 -3.7 -5.9 -4.4 -2.5
Current-account balance ($bn) -1 0.3 -0.3 0.1 0 -1.4 -4.3 -3.2 -1
Foreign direct investment flow ($m) - - 100 600 700 2500 1400 1300 2540
Foreign exchange reserves ($bn) 1.1 0.7 0.8 3.9 6.2 14 12.4 9.8 12.6
Foreign debt ($bn) 6.4 6.7 7.1 8.5 10.7 16.5 20.8 21.6 24.4
Discount rate (%) - 9.5 9.5 8 8.5 9.5 10.5 13 7.5
Exchange rate (/$) 18 29.5 28.3 29.2 28.8 26.6 27.1 31.7 32.3
Population (m) 10.3 10.3 10.3 10.3 10.3 10.3 10.3 10.3 10.3
Source: Business Central Europe (calculations based on WIIW, EBRD, and national statistics)
Table 2. Bulgaria: Selected macroeconomic indicators (1990-1998)
Indicator 1990 1991 1992 1993 1994 1995 1996 1997 1998
Nominal GDP ($bn) 19.2 7.5 8.6 10.8 9.7 12.9 9.4 10.2 11.7
GDP per capita PPP ($) 4487 4114 4098 4195 4384 4369 4039 3860 4414
GDP (% change) -9.1 -11.7 -7.3 -1.5 1.8 2.1 -10.9 -6.9 4.5
Industrial production (% change) -16.7 -21 -6.4 -6.2 6 -5.4 -8.3 -7 -9.4
Budget balance (% of GDP) -4.9 -3.7 -5.2 -10.9 -5.8 -5.6 -11.5 -2.9 1.3
Unemployment (%) 1.7 11.1 15.3 16.4 12.8 11.1 12.5 13.7 12.2
Average monthly wage ($) 158 55 87.7 117 91.4 113.1 75.5 82.1 118.2
Inflation (%) - 334 82 73 96.3 62 123 1082 22.3
Exports ($bn) 2.5 2.7 4 3.7 3.9 5.3 4.9 4.9 4.3
Imports ($bn) 3.3 2.3 4.2 4.6 4 5.2 4.7 4.9 5
Trade balance ($bn) -0.8 0.4 -0.2 -0.9 0 0.1 0.2 0 -0.7
Current-account balance ($bn) -1.2 -0.4 -0.8 -1.4 -0.2 -0.1 0.1 0.4 0
Foreign direct investment flow ($m) - 56 42 40 105 82 100 497 270
Foreign exchange reserves ($bn) - 0.3 0.9 0.7 1 1.2 0.5 2.5 2.8
Foreign debt ($bn) 10.9 11.8 12.5 13.9 11.4 10.2 9.7 9.7 10.1
Discount rate (%) - 54 47.8 63.1 93.9 38.6 342.1 6.8 5.2
Exchange rate (/$) 0.8 16.7 23.3 27.7 54.3 67.2 175.8 1677 1754
Population (m) 8.7 8.6 8.5 8.5 8.4 8.4 8.4 8.3 8.4
Table 3. Estimated private sector share in GDP and enployment (1992-1997)
1992 1993 1994 1995 1996 1997
Private sector share in GDP (in percent)
Bulgaria 26 35 39 48 53 59 Czech Republic 28 45 56 64 75 75
Private sector share in employment (in percent) Bulgaria 18 28 36 41 47 55 Czech Republic 40 60 64 76 78 -Source: IMF (1999)
Table 4. Cumulative change in GDP in Bulgaria and the Czech Republic, 1989-1997 (in per cent)
1989-1997 Peak decline since 1989 Bulgaria -36.8 -37.0
Czech Republic -8.0 -21 Source: IMF (1999)
Table 5. Distribution of firms across industries according to the first digit primary US SIC code (in per cent)
Bulgaria Czech Republic
SIC1 17 14 SIC2 31 22 SIC3 28 33 SIC4 12 10 SIC5 8 14 SIC7 4 6 TOTAL 100 100
Table 6. Summary statistics of the capital structure data set
A. The Czech Republic
Variable Definition Mean Median Std dev Minimum Maximum DE Ratio of book value of debt to
the sum of debt and equity 0.296 0.258 0.226 0,000 0.996 VAR Variance of operating income 0.003 0.001 0.006 0,000 0.042 TANG Tangibility 0.480 0.484 0.193 0.003 0.977 PROF Profitability 0.007 0.009 0.068 -0.520 0.332 SIZE Size 9.457 9.290 1.367 6.153 14.910 TCS Trade creditors 0.196 0.126 0.361 0.000 7.676 TDS Trade debtors 0.264 0.159 0.884 0.005 20.825 B. Bulgaria
Variable Definition Mean Median Std dev Minimum Maximum DE Ratio of book value of debt to
the sum of debt and equity 0.289 0.226 0.221 0.007 0.994 VAR Variance of operating income 0.012 0.005 0.016 0.000 0.121 TANG Tangibility 0.548 0.572 0.233 0.019 0.994 PROF Profitability 0.034 0.012 0.113 -0.998 0.664 SIZE Size 7.044 6.944 1.579 2.382 13.662 TCS Trade creditors 0.067 0.035 0.121 0.000 2.599 TDS Trade debtors 0.064 0.040 0.086 0.000 1.252
Table 7. Czech Republic: Dynamic adjustment model and static model
Dynamic Model Static Model
Variable Parameter Standard Error Parameter Standard Error
$7DUJHW/HYHUDJH INTERCEPT 0.392*** 0.129 0.342*** 0.032 VROA -5.325** 2.306 0.682 TANG -0.334*** 0.067 -0.254*** 0.020 PROF -3.487*** 0.256 -0.823*** 0.055 SIZE 0.040*** 0.011 0.017*** 0.003 TCS 0.047 -0.021*** 0.005 TDS 0.014 0.019*** 0.005 TIME94 . . 0.001 0.011 TIME95 0.029 0.034 0.008 0.011 TIME96 0.038 0.016 0.011 TIME97 0.038 0.034 0.025** 0.011 LEGAL -0.269*** 0.032 -0.169*** 0.013 SIC1 -0.038 0.090 -0.018 0.018 SIC2 0.106 0.089 0.117*** 0.017 SIC3 -0.026 0.086 0.042*** 0.016 SIC4 0.002 0.113 0.019 SIC5 0.013 0.085 0.143*** 0.018 %$GMXVWPHQW6SHHG INTERCEPT 0.322*** 0.057 DISTAN 0.018 SIZE -0.011** 0.005 TIME95 -0.021 0.021 TIME96 -0.043** 0.022 TIME97 -0.019 0.021 LEGAL -0.108*** 0.019 SIC1 0.059 0.036 SIC2 0.037 0.033 SIC3 0.052 0.032 SIC4 -0.014 0.038 SIC5 0.166*** 0.036 Adj. R2 = 0.80 N=596 T=4 Adj. R2 = 0.71 N=596 T=5
Table 8. Bulgaria: Dynamic Adjustment Model and Static Model
Dynamic Model Static Model
Variable Parameter Standard Error Parameter Standard Error
$7DUJHW/HYHUDJH INTERCEPT 0.828*** 0.042 0.488*** 0.022 VROA 0.735** 0.340 0.442** 0.180 TANG -1.026*** 0.030 -0.662*** 0.014 PROF -1.684*** 0.060 -1.123*** 0.029 SIZE 0.023*** 0.003 0.018*** 0.002 TCS -0.275*** 0.044 -0.046*** 0.011 TDS -0.056 0.057 0,017 0.029 TIME94 . . 0.040*** 0.008 TIME95 0.010 0.020 0.035*** 0.008 TIME96 0.193*** 0.027 0.113*** 0.010 TIME97 0.008 0.016 0.120*** 0.009 LEGAL -0.032* 0.017 -0.002 0.008 SIC1 -0.028 0.026 -0.007 0.014 SIC2 -0.027 0.026 0.015 0.014 SIC3 -0.051** 0.025 0.002 0.014 SIC4 -0.025 0.027 -0.003 0.015 SIC5 -0.122*** 0.034 -0.048*** 0.016 %$GMXVWPHQW6SHHG INTERCEPT 0.238*** 0.060 DISTAN 0.125*** 0.038 SIZE 0.010** 0.005 TIME95 -0.135*** 0.031 TIME96 -0.040 0.034 TIME97 0.214*** 0.029 LEGAL 0.074*** 0.023 SIC1 0.029 0.045 SIC2 -0.015 0.043 SIC3 -0.004 0.043 SIC4 0.047 0.046 SIC5 -0.140*** 0.051 Adj. R2 = 0.80 N=667 T=4 Adj. R2 = 0.71 N=667 T=5
Table 9. Czech Republic: Mean and median of adjustment speed (δit), target leverage ratio (L*it), observed leverage ratio (Lit), and a gap between target and observed ratios (L*it-Lit)
A. Size groups
Very small Small Medium Large Very Large Mean (Median) Mean (Median) Mean (Median) Mean (Median) Mean (Median) Adjustment speed 0.180 0.176 0.151 0.140 0.118 (0.159) (0.151) (0.139) (0.130) (0.109) Target ratio 0.324 0.341 0.359 0.382 0.420 (0.279) (0.312) (0.330) (0.368) (0.402) Observe ratio 0.252 0.295 0.303 0.319 0.310 (0.187) (0.264) (0.270) (0.298) (0.279) Average Gap 0.072 0.046 0.056 0.062 0.111 (0.068) (0.029) (0.045) (0.059) (0.112) B. Industry classification
SIC1 SIC2 SIC3 SIC4 SIC5 SIC7 Mean (Median) Mean (Median) Mean (Median) Mean (Median) Mean (Median) Mean (Median) Adjustment speed 0.160 0.130 0.146 0.076 0.275 0.102 (0.151) (0.124) (0.140) (0.071) (0.261) (0.096) Target ratio 0.330 0.443 0.333 0.299 0.422 0.313 (0.295) (0.429) (0.316) (0.274) (0.390) (0.267) Observe ratio 0.229 0.343 0.280 0.230 0.410 0.203 (0.197) (0.318) (0.237) (0.181) (0.383) (0.140) Average Gap 0.102 0.101 0.053 0.069 0.013 0.111 (0.101) (0.095) (0.056) (0.074) (-0.007) (0.115)
C. Year of observation
1994 1995 1996 1997 Mean (Median) Mean (Median) Mean (Median) Mean (Median) Adjustment speed 0.174 0.152 0.129 0.157 (0.157) (0.135) (0.113) (0.140) Target ratio 0.314 0.351 0.391 0.405 (0.292) (0.328) (0.369) (0.375) Observe ratio 0.274 0.287 0.303 0.318 (0.228) (0.252) (0.268) (0.277) Average Gap 0.040 0.064 0.088 0.087 (0.042) (0.068) (0.077) (0.080)
Table 10. Bulgaria: Mean and Median of adjustment speed (δit), target leverage ratio (L*it), observed leverage ratio (Lit), and a gap between target and observed ratios (L*it-Lit)
A. Size groups
Very small Small Medium Large Very Large Mean (Median) Mean (Median) Mean (Median) Mean (Median) Mean (Median) Adjustment speed 0.435 0.427 0.419 0.440 (0.415) (0.420) (0.416) (0.433) (0.443) Target ratio 0.422 0.306 0.324 0.305 0.341 (0.427) (0.280) (0.296) (0.251) (0.308) Observe ratio 0.323 0.254 0.285 0.275 0.307 (0.288) (0.189) (0.212) (0.202) (0.239) Average Gap 0.099 0.052 0.039 0.029 0.034 (0.102) (0.043) (0.027) (0.013) (0.013)
B. Industry classification
SIC1 SIC2 SIC3 SIC4 SIC5 SIC7 Mean (Median) Mean (Median) Mean (Median) Mean (Median) Mean (Median) Mean (Median) Adjustment speed 0.469 0.414 0.452 0.486 0.290 0.444 (0.450) (0.405) (0.138) (0.437) (0.277) (0.428) Target ratio 0.360 0.368 0.343 0.305 0.256 0.274 (0.345) (0.333) (0.250) (0.310) (0.217) (0.237) Observe ratio 0.291 0.316 0.303 0.255 0.218 0.210 (0.237) (0.256) (0.233) (0.244) (0.151) (0.153) Average Gap 0.068 0.052 0.040 0.050 0.039 0.064 (0.060) (0.036) (0.189) (0.020) (-0.001) (0.060) C. Year of observation 1994 1995 1996 1997 Mean (Median) Mean (Median) Mean (Median) Mean (Median) Adjustment speed 0.427 0.266 0.401 0.643 (0.441) (0.280) (0.414) (0.658) Target ratio 0.282 0.343 0.559 0.174 (0.250) (0.324) (0.563) (0.117) Observe ratio 0.248 0.275 0.391 0.241 (0.195) (0.223) (0.346) (0.167) Average Gap 0.034 0.068 0.167 -0.066 (0.022) (0.062) (0.166) (-0.058)
No 2 Juha-Pekka Niinimäki: Bank Panics in Transition Economies
No 3 Jouko Rautava: The role of oil prices and the real exchange rate in Russia’s economy No 4 Marketta Järvinen: Exchange rate regimes and nominal convergence in the CEECs
No 5 Axel Brüggemann and Thomas Linne: Are the Central and Eastern European transition countries still vulnerable to a financial crisis? Results from the signals approach
No 6 Balázs Égert: Investigating theBalassa-Samuelson hypothesis in transition: Do we understand what we see?
No 7 Maurizio M. Habib: Financial contagion, interest rates and
the role of the exchange rate as shock absorber in Central and Eastern Europe No 8 Christoph Fischer: Real currency appreciation in accession countries:
Balassa-Samuelson and investment demand
No 9 John Bonin and Paul Wachtel: Financial sector development in transition economies. Lessons from the first decade
No 10 Juhani Laurila: Transition in FSU and sub-Saharan countries: The role of institutions No 11 Antje Hildebrant: Too many to fail? Inter-enterprise arrears in transition economies
No 12 Alexander Muravyev: Federal state shareholdings in Russian companies: Origin, forms and consequences for enterprise performance
No 13 Jian-Guang Shen: Democracy and growth: An alternative empirical approach
No 14 Tuuli Koivu: Do efficient banking sectors accelerate economic growth in transition countries No 15 Byung-Yeon Kim and Iikka Korhonen: Equilibrium exchange rates in transition countries:
Evidence from dynamic heterogeneous panel models
No 16 Monika Blaszkiewicz, Jerzy Konieczny, Anna Myslinska, Artur Radziwil and Przemyslaw Wozniak: Some benefits of reducing inflation in transition economies
No 1 Karsten Staehr: Reforms and economic growth in transition economies: Complementarity, sequencing and speedISBN 951-686-852-5 (print) ISSN 1456-4564 (print)
ISBN 951-686-853-3 (online) ISSN 1456-5889 (online)
Editor-in-Chief Iikka Korhonen
Bank of Finland
Institute for Economies in Transition BOFIT
PO Box 160
FIN-00101 Helsinki
Phone: +358 9 183 2268
Fax: +358 9 183 2294
bofit@bof.fi
www.bof.fi/bofit